空气污染在 Īshwaenagar :实时空气质量指数和烟雾警报。
城市污染和空气质量 Īshwaenagar 。 今天是 2026年5月13日星期三 。 已记录下列空气污染值 Īshwaenagar :- 颗粒物(PM10)悬浮尘埃 - 346 (非常糟糕的危险性)
- 二氧化氮(NO2) - 4 (好)
- 一氧化碳 (CO) - 960 (好)
- 臭氧 (O3) - 28 (好)
- 尘埃 - 225 (非常糟糕的危险性)

今天,美国 Īshwaenagar 。 空气中的空气是否 Īshwaenagar ?有烟雾吗?
今天下午的 PM10 Īshwaenagar ? (颗粒物(PM10)悬浮尘埃)
目前颗粒物PM10的 Īshwaenagar :
346 (非常糟糕的危险性)
最高 PM10 值通常以月份为 470 (2018年12月) 。
颗粒物PM10污染的最低值 Īshwaenagar 记录为: 八月 (74) 。
NO2 水平有多高? (二氧化氮(NO2))
4 (好)
CO 级别有多高? (一氧化碳 (CO))
960 (好)
今天 O3 级别在 Īshwaenagar ? (臭氧 (O3))
28 (好)
目前 PM2.5 的当前 Īshwaenagar ? (尘埃)
今天的 PM2.5 级别是:
225 (非常糟糕的危险性)
相比之下,过去 7 天内 PM2.5 Īshwaenagar 的最高水平是: 225 (2022年10月31日星期一) 和最低: 225 (2022年10月31日星期一) 。
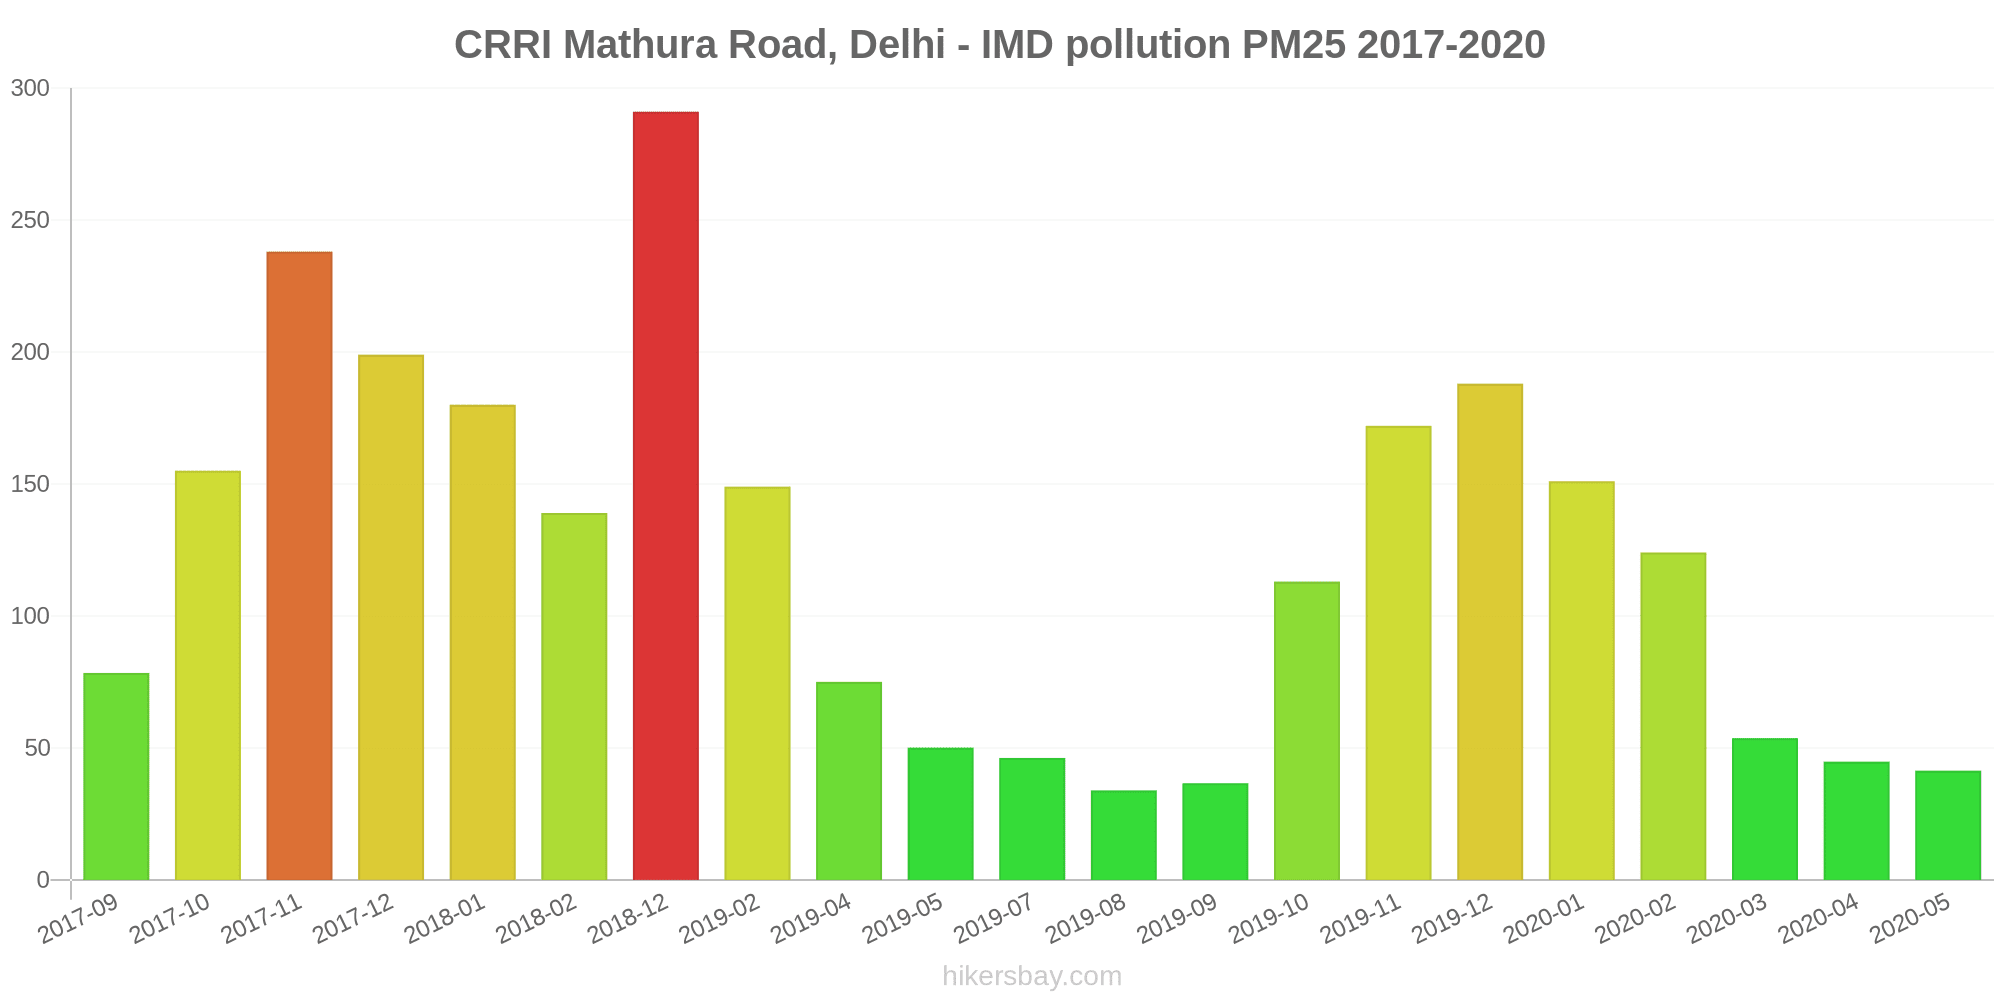
记录的最高 PM2.5 值: 291 (2018年12月) 。
颗粒物PM2.5污染的最低水平发生在月份: 八月 (34) 。
当前数据 2022年10月31日星期一 上午1:15
PM10 346 (非常糟糕的危险性)
NO2 4 (好)
CO 960 (好)
O3 28 (好)
PM2,5 225 (非常糟糕的危险性)
最近几天的空气污染数据 Īshwaenagar
index
2022-10-31
pm10
346
Very bad Hazardous
no2
4
Good
co
960
Good
o3
28
Good
pm25
225
Very bad Hazardous
data source »
空气污染在 Īshwaenagar 从 2017年9月 2020年5月

index
2020-05
2020-04
2020-03
2020-02
2020-01
2019-12
2019-11
2019-10
2019-09
2019-08
2019-07
2019-05
2019-04
2019-02
2018-12
2018-02
2018-01
2017-12
2017-11
2017-10
2017-09
pm25
41 (Unhealthy for Sensitive Groups)
45 (Unhealthy for Sensitive Groups)
54 (Unhealthy for Sensitive Groups)
124 (Very bad Hazardous)
151 (Very bad Hazardous)
188 (Very bad Hazardous)
172 (Very bad Hazardous)
113 (Very bad Hazardous)
37 (Unhealthy for Sensitive Groups)
34 (Moderate)
46 (Unhealthy for Sensitive Groups)
50 (Unhealthy for Sensitive Groups)
75 (Very Unhealthy)
149 (Very bad Hazardous)
291 (Very bad Hazardous)
139 (Very bad Hazardous)
180 (Very bad Hazardous)
199 (Very bad Hazardous)
238 (Very bad Hazardous)
155 (Very bad Hazardous)
78 (Very Unhealthy)
pm10
93 (Unhealthy)
108 (Unhealthy)
128 (Very Unhealthy)
249 (Very bad Hazardous)
267 (Very bad Hazardous)
312 (Very bad Hazardous)
295 (Very bad Hazardous)
236 (Very bad Hazardous)
80 (Unhealthy for Sensitive Groups)
74 (Unhealthy for Sensitive Groups)
125 (Very Unhealthy)
204 (Very bad Hazardous)
277 (Very bad Hazardous)
217 (Very bad Hazardous)
470 (Very bad Hazardous)
258 (Very bad Hazardous)
341 (Very bad Hazardous)
339 (Very bad Hazardous)
354 (Very bad Hazardous)
271 (Very bad Hazardous)
146 (Very Unhealthy)
no2
11 (Good)
17 (Good)
29 (Good)
75 (Moderate)
79 (Moderate)
87 (Moderate)
128 (Unhealthy for Sensitive Groups)
135 (Unhealthy for Sensitive Groups)
33 (Good)
31 (Good)
19 (Good)
22 (Good)
26 (Good)
16 (Good)
52 (Moderate)
32 (Good)
31 (Good)
31 (Good)
33 (Good)
32 (Good)
32 (Good)
co
371 (Good)
435 (Good)
656 (Good)
1 (Good)
1 (Good)
1 (Good)
1 (Good)
1 (Good)
979 (Good)
1 (Good)
1 (Good)
1 (Good)
2 (Good)
1 (Good)
3 (Good)
1 (Good)
1 (Good)
1 (Good)
1 (Good)
- (Good)
- (Good)
o3
14 (Good)
16 (Good)
17 (Good)
16 (Good)
13 (Good)
9.9 (Good)
14 (Good)
42 (Good)
27 (Good)
40 (Good)
56 (Good)
44 (Good)
31 (Good)
33 (Good)
41 (Good)
- (Good)
- (Good)
- (Good)
- (Good)
- (Good)
- (Good)
data source »
CRRI Mathura Road, New Delhi - IMD
2022年10月31日星期一 上午1:15
PM10 346 (非常糟糕的危险性)
颗粒物(PM10)悬浮尘埃
NO2 3.5 (好)
二氧化氮(NO2)
CO 960 (好)
一氧化碳 (CO)
O3 28 (好)
臭氧 (O3)
PM2,5 225 (非常糟糕的危险性)
尘埃
CRRI Mathura Road, New Delhi - IMD
index
2022-10-31
pm10
346
no2
3.5
co
960
o3
28
pm25
225
CRRI Mathura Road, Delhi - IMD
2017-09 2020-05

index
2020-05
2020-04
2020-03
2020-02
2020-01
2019-12
2019-11
2019-10
2019-09
2019-08
2019-07
2019-05
2019-04
2019-02
2018-12
2018-02
2018-01
2017-12
2017-11
2017-10
2017-09
no2
11
17
29
75
79
87
128
135
33
31
19
22
26
16
52
32
31
31
33
32
32
pm25
41
45
54
124
151
188
172
113
37
34
46
50
75
149
291
139
180
199
238
155
78
pm10
93
108
128
249
267
312
295
236
80
74
125
204
277
217
470
258
341
339
354
271
146
co
371
435
656
1
1
1
1
1
979
1
1
1
2
1
3
1
1
1
1
-
-
o3
14
16
17
16
13
9.9
14
42
27
40
56
44
31
33
41
-
-
-
-
-
-
* Pollution data source:
https://openaq.org
(caaqm)
The data is licensed under CC-By 4.0
PM10 346 (非常糟糕的危险性)
NO2 4 (好)
CO 960 (好)
O3 28 (好)
PM2,5 225 (非常糟糕的危险性)
最近几天的空气污染数据 Īshwaenagar
| index | 2022-10-31 |
|---|---|
| pm10 | 346 Very bad Hazardous |
| no2 | 4 Good |
| co | 960 Good |
| o3 | 28 Good |
| pm25 | 225 Very bad Hazardous |

| index | 2020-05 | 2020-04 | 2020-03 | 2020-02 | 2020-01 | 2019-12 | 2019-11 | 2019-10 | 2019-09 | 2019-08 | 2019-07 | 2019-05 | 2019-04 | 2019-02 | 2018-12 | 2018-02 | 2018-01 | 2017-12 | 2017-11 | 2017-10 | 2017-09 |
|---|---|---|---|---|---|---|---|---|---|---|---|---|---|---|---|---|---|---|---|---|---|
| pm25 | 41 (Unhealthy for Sensitive Groups) | 45 (Unhealthy for Sensitive Groups) | 54 (Unhealthy for Sensitive Groups) | 124 (Very bad Hazardous) | 151 (Very bad Hazardous) | 188 (Very bad Hazardous) | 172 (Very bad Hazardous) | 113 (Very bad Hazardous) | 37 (Unhealthy for Sensitive Groups) | 34 (Moderate) | 46 (Unhealthy for Sensitive Groups) | 50 (Unhealthy for Sensitive Groups) | 75 (Very Unhealthy) | 149 (Very bad Hazardous) | 291 (Very bad Hazardous) | 139 (Very bad Hazardous) | 180 (Very bad Hazardous) | 199 (Very bad Hazardous) | 238 (Very bad Hazardous) | 155 (Very bad Hazardous) | 78 (Very Unhealthy) |
| pm10 | 93 (Unhealthy) | 108 (Unhealthy) | 128 (Very Unhealthy) | 249 (Very bad Hazardous) | 267 (Very bad Hazardous) | 312 (Very bad Hazardous) | 295 (Very bad Hazardous) | 236 (Very bad Hazardous) | 80 (Unhealthy for Sensitive Groups) | 74 (Unhealthy for Sensitive Groups) | 125 (Very Unhealthy) | 204 (Very bad Hazardous) | 277 (Very bad Hazardous) | 217 (Very bad Hazardous) | 470 (Very bad Hazardous) | 258 (Very bad Hazardous) | 341 (Very bad Hazardous) | 339 (Very bad Hazardous) | 354 (Very bad Hazardous) | 271 (Very bad Hazardous) | 146 (Very Unhealthy) |
| no2 | 11 (Good) | 17 (Good) | 29 (Good) | 75 (Moderate) | 79 (Moderate) | 87 (Moderate) | 128 (Unhealthy for Sensitive Groups) | 135 (Unhealthy for Sensitive Groups) | 33 (Good) | 31 (Good) | 19 (Good) | 22 (Good) | 26 (Good) | 16 (Good) | 52 (Moderate) | 32 (Good) | 31 (Good) | 31 (Good) | 33 (Good) | 32 (Good) | 32 (Good) |
| co | 371 (Good) | 435 (Good) | 656 (Good) | 1 (Good) | 1 (Good) | 1 (Good) | 1 (Good) | 1 (Good) | 979 (Good) | 1 (Good) | 1 (Good) | 1 (Good) | 2 (Good) | 1 (Good) | 3 (Good) | 1 (Good) | 1 (Good) | 1 (Good) | 1 (Good) | - (Good) | - (Good) |
| o3 | 14 (Good) | 16 (Good) | 17 (Good) | 16 (Good) | 13 (Good) | 9.9 (Good) | 14 (Good) | 42 (Good) | 27 (Good) | 40 (Good) | 56 (Good) | 44 (Good) | 31 (Good) | 33 (Good) | 41 (Good) | - (Good) | - (Good) | - (Good) | - (Good) | - (Good) | - (Good) |
PM10 346 (非常糟糕的危险性)
颗粒物(PM10)悬浮尘埃NO2 3.5 (好)
二氧化氮(NO2)CO 960 (好)
一氧化碳 (CO)O3 28 (好)
臭氧 (O3)PM2,5 225 (非常糟糕的危险性)
尘埃CRRI Mathura Road, New Delhi - IMD
| index | 2022-10-31 |
|---|---|
| pm10 | 346 |
| no2 | 3.5 |
| co | 960 |
| o3 | 28 |
| pm25 | 225 |
CRRI Mathura Road, Delhi - IMD
| index | 2020-05 | 2020-04 | 2020-03 | 2020-02 | 2020-01 | 2019-12 | 2019-11 | 2019-10 | 2019-09 | 2019-08 | 2019-07 | 2019-05 | 2019-04 | 2019-02 | 2018-12 | 2018-02 | 2018-01 | 2017-12 | 2017-11 | 2017-10 | 2017-09 |
|---|---|---|---|---|---|---|---|---|---|---|---|---|---|---|---|---|---|---|---|---|---|
| no2 | 11 | 17 | 29 | 75 | 79 | 87 | 128 | 135 | 33 | 31 | 19 | 22 | 26 | 16 | 52 | 32 | 31 | 31 | 33 | 32 | 32 |
| pm25 | 41 | 45 | 54 | 124 | 151 | 188 | 172 | 113 | 37 | 34 | 46 | 50 | 75 | 149 | 291 | 139 | 180 | 199 | 238 | 155 | 78 |
| pm10 | 93 | 108 | 128 | 249 | 267 | 312 | 295 | 236 | 80 | 74 | 125 | 204 | 277 | 217 | 470 | 258 | 341 | 339 | 354 | 271 | 146 |
| co | 371 | 435 | 656 | 1 | 1 | 1 | 1 | 1 | 979 | 1 | 1 | 1 | 2 | 1 | 3 | 1 | 1 | 1 | 1 | - | - |
| o3 | 14 | 16 | 17 | 16 | 13 | 9.9 | 14 | 42 | 27 | 40 | 56 | 44 | 31 | 33 | 41 | - | - | - | - | - | - |