空气污染在 Guangming Dongcun :实时空气质量指数和烟雾警报。
城市污染和空气质量 Guangming Dongcun 。 今天是 2026年6月2日星期二 。 已记录下列空气污染值 Guangming Dongcun :- 颗粒物(PM10)悬浮尘埃 - 179 (非常糟糕的危险性)
- 尘埃 - 35 (敏感组不正常)
- 臭氧 (O3) - 0 (好)
- 二氧化氮(NO2) - 0 (好)
- 二氧化硫 (SO2) - 0 (好)

今天,美国 Guangming Dongcun 。 空气中的空气是否 Guangming Dongcun ?有烟雾吗?
今天下午的 PM10 Guangming Dongcun ? (颗粒物(PM10)悬浮尘埃)
目前颗粒物PM10的 Guangming Dongcun :
179 (非常糟糕的危险性)
最高 PM10 值通常以月份为 81 (2019年3月) 。
颗粒物PM10污染的最低值 Guangming Dongcun 记录为: 九月 (36) 。
目前 PM2.5 的当前 Guangming Dongcun ? (尘埃)
今天的 PM2.5 级别是:
35 (敏感组不正常)
相比之下,过去 7 天内 PM2.5 Guangming Dongcun 的最高水平是: 56 (2022年5月27日星期五) 和最低: 56 (2022年5月27日星期五) 。
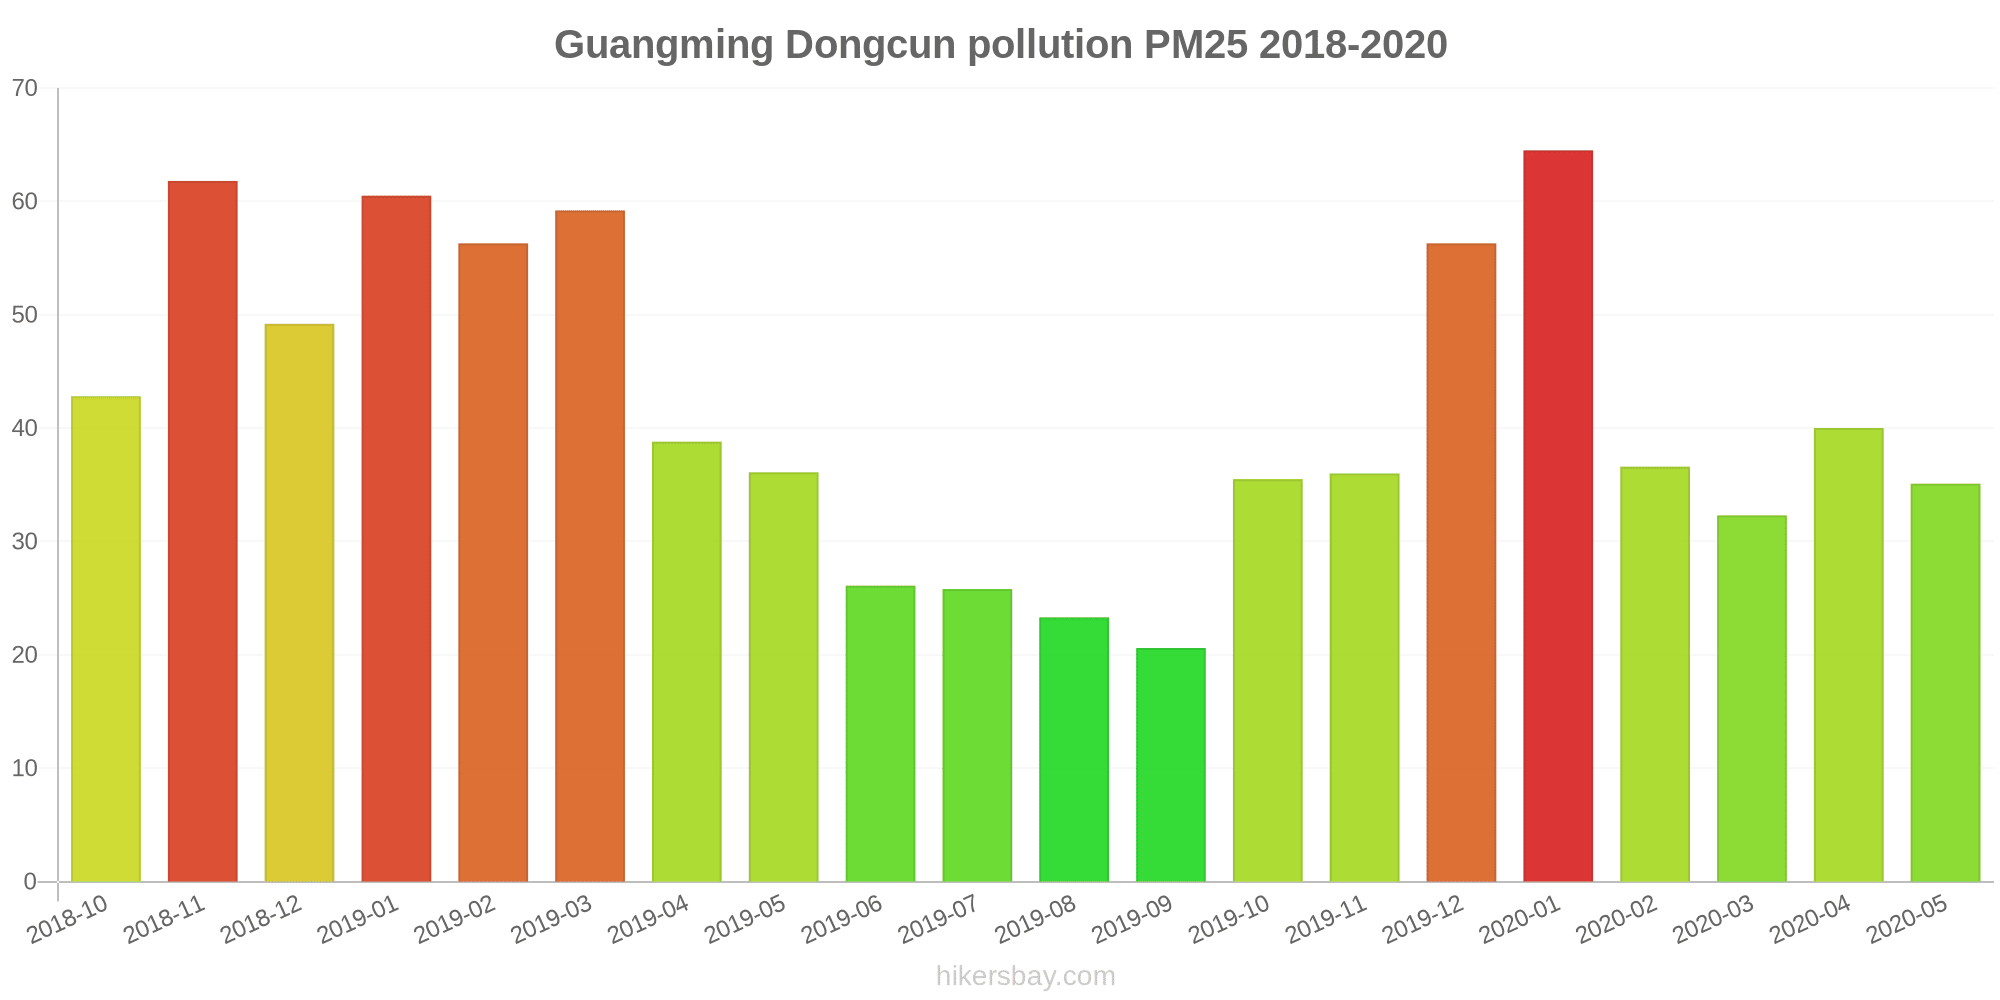
记录的最高 PM2.5 值: 65 (2020年1月) 。
颗粒物PM2.5污染的最低水平发生在月份: 九月 (21) 。
今天 O3 级别在 Guangming Dongcun ? (臭氧 (O3))
0 (好)
NO2 水平有多高? (二氧化氮(NO2))
0 (好)
SO2 污染程度如何? (二氧化硫 (SO2))
0 (好)
当前数据 2022年5月27日星期五 下午12:00
PM10 179 (非常糟糕的危险性)
PM2,5 35 (敏感组不正常)
O3 0 (好)
NO2 0 (好)
SO2 0 (好)
最近几天的空气污染数据 Guangming Dongcun
index
2022-05-27
pm10
56
Unhealthy for Sensitive Groups
pm25
56
Unhealthy
o3
0
Good
no2
0
Good
so2
0
Good
data source »
空气污染在 Guangming Dongcun 从 2018年10月 2020年5月

index
2020-05
2020-04
2020-03
2020-02
2020-01
2019-12
2019-11
2019-10
2019-09
2019-08
2019-07
2019-06
2019-05
2019-04
2019-03
2019-02
2019-01
2018-12
2018-11
2018-10
pm25
35 (Unhealthy for Sensitive Groups)
40 (Unhealthy for Sensitive Groups)
32 (Moderate)
37 (Unhealthy for Sensitive Groups)
65 (Unhealthy)
56 (Unhealthy)
36 (Unhealthy for Sensitive Groups)
36 (Unhealthy for Sensitive Groups)
21 (Moderate)
23 (Moderate)
26 (Moderate)
26 (Moderate)
36 (Unhealthy for Sensitive Groups)
39 (Unhealthy for Sensitive Groups)
59 (Unhealthy)
56 (Unhealthy)
61 (Unhealthy)
49 (Unhealthy for Sensitive Groups)
62 (Unhealthy)
43 (Unhealthy for Sensitive Groups)
co
648 (Good)
755 (Good)
617 (Good)
609 (Good)
671 (Good)
782 (Good)
649 (Good)
572 (Good)
493 (Good)
577 (Good)
422 (Good)
551 (Good)
639 (Good)
763 (Good)
698 (Good)
798 (Good)
798 (Good)
658 (Good)
697 (Good)
573 (Good)
no2
23 (Good)
32 (Good)
27 (Good)
18 (Good)
27 (Good)
46 (Moderate)
37 (Good)
32 (Good)
22 (Good)
21 (Good)
28 (Good)
31 (Good)
33 (Good)
30 (Good)
44 (Moderate)
25 (Good)
38 (Good)
37 (Good)
39 (Good)
31 (Good)
o3
143 (Unhealthy for Sensitive Groups)
142 (Unhealthy for Sensitive Groups)
110 (Moderate)
93 (Moderate)
77 (Moderate)
76 (Moderate)
95 (Moderate)
120 (Unhealthy for Sensitive Groups)
114 (Moderate)
136 (Unhealthy for Sensitive Groups)
159 (Unhealthy)
165 (Unhealthy)
163 (Unhealthy)
129 (Unhealthy for Sensitive Groups)
113 (Moderate)
89 (Moderate)
72 (Moderate)
65 (Good)
104 (Moderate)
123 (Unhealthy for Sensitive Groups)
pm10
48 (Moderate)
57 (Unhealthy for Sensitive Groups)
43 (Moderate)
38 (Moderate)
58 (Unhealthy for Sensitive Groups)
62 (Unhealthy for Sensitive Groups)
69 (Unhealthy for Sensitive Groups)
64 (Unhealthy for Sensitive Groups)
36 (Moderate)
37 (Moderate)
40 (Moderate)
39 (Moderate)
69 (Unhealthy for Sensitive Groups)
61 (Unhealthy for Sensitive Groups)
81 (Unhealthy)
67 (Unhealthy for Sensitive Groups)
75 (Unhealthy for Sensitive Groups)
72 (Unhealthy for Sensitive Groups)
77 (Unhealthy for Sensitive Groups)
70 (Unhealthy for Sensitive Groups)
so2
9.6 (Good)
8.8 (Good)
6.7 (Good)
3.9 (Good)
6.3 (Good)
8.6 (Good)
7.2 (Good)
8.1 (Good)
6.3 (Good)
9.1 (Good)
7.6 (Good)
9.6 (Good)
13 (Good)
12 (Good)
8.6 (Good)
4.1 (Good)
7.2 (Good)
14 (Good)
13 (Good)
14 (Good)
data source »
虹桥
2022年5月27日星期五 下午12:00
PM10 179 (非常糟糕的危险性)
颗粒物(PM10)悬浮尘埃
PM2,5 35 (敏感组不正常)
尘埃
O3 0.04 (好)
臭氧 (O3)
NO2 0 (好)
二氧化氮(NO2)
SO2 0 (好)
二氧化硫 (SO2)
虹桥
index
2022-05-27
pm10
56
pm25
56
o3
0.03
no2
0
so2
0
虹桥
2018-10 2020-05

index
2020-05
2020-04
2020-03
2020-02
2020-01
2019-12
2019-11
2019-10
2019-09
2019-08
2019-07
2019-06
2019-05
2019-04
2019-03
2019-02
2019-01
2018-12
2018-11
2018-10
pm25
35
40
32
37
65
56
36
36
21
23
26
26
36
39
59
56
61
49
62
43
co
648
755
617
609
671
782
649
572
493
577
422
551
639
763
698
798
798
658
697
573
no2
23
32
27
18
27
46
37
32
22
21
28
31
33
30
44
25
38
37
39
31
o3
143
142
110
93
77
76
95
120
114
136
159
165
163
129
113
89
72
65
104
123
pm10
48
57
43
38
58
62
69
64
36
37
40
39
69
61
81
67
75
72
77
70
so2
9.6
8.8
6.7
3.9
6.3
8.6
7.2
8.1
6.3
9.1
7.6
9.6
13
12
8.6
4.1
7.2
14
13
14
* Pollution data source:
https://openaq.org
(ChinaAQIData)
The data is licensed under CC-By 4.0
PM10 179 (非常糟糕的危险性)
PM2,5 35 (敏感组不正常)
O3 0 (好)
NO2 0 (好)
SO2 0 (好)
最近几天的空气污染数据 Guangming Dongcun
| index | 2022-05-27 |
|---|---|
| pm10 | 56 Unhealthy for Sensitive Groups |
| pm25 | 56 Unhealthy |
| o3 | 0 Good |
| no2 | 0 Good |
| so2 | 0 Good |
| index | 2020-05 | 2020-04 | 2020-03 | 2020-02 | 2020-01 | 2019-12 | 2019-11 | 2019-10 | 2019-09 | 2019-08 | 2019-07 | 2019-06 | 2019-05 | 2019-04 | 2019-03 | 2019-02 | 2019-01 | 2018-12 | 2018-11 | 2018-10 |
|---|---|---|---|---|---|---|---|---|---|---|---|---|---|---|---|---|---|---|---|---|
| pm25 | 35 (Unhealthy for Sensitive Groups) | 40 (Unhealthy for Sensitive Groups) | 32 (Moderate) | 37 (Unhealthy for Sensitive Groups) | 65 (Unhealthy) | 56 (Unhealthy) | 36 (Unhealthy for Sensitive Groups) | 36 (Unhealthy for Sensitive Groups) | 21 (Moderate) | 23 (Moderate) | 26 (Moderate) | 26 (Moderate) | 36 (Unhealthy for Sensitive Groups) | 39 (Unhealthy for Sensitive Groups) | 59 (Unhealthy) | 56 (Unhealthy) | 61 (Unhealthy) | 49 (Unhealthy for Sensitive Groups) | 62 (Unhealthy) | 43 (Unhealthy for Sensitive Groups) |
| co | 648 (Good) | 755 (Good) | 617 (Good) | 609 (Good) | 671 (Good) | 782 (Good) | 649 (Good) | 572 (Good) | 493 (Good) | 577 (Good) | 422 (Good) | 551 (Good) | 639 (Good) | 763 (Good) | 698 (Good) | 798 (Good) | 798 (Good) | 658 (Good) | 697 (Good) | 573 (Good) |
| no2 | 23 (Good) | 32 (Good) | 27 (Good) | 18 (Good) | 27 (Good) | 46 (Moderate) | 37 (Good) | 32 (Good) | 22 (Good) | 21 (Good) | 28 (Good) | 31 (Good) | 33 (Good) | 30 (Good) | 44 (Moderate) | 25 (Good) | 38 (Good) | 37 (Good) | 39 (Good) | 31 (Good) |
| o3 | 143 (Unhealthy for Sensitive Groups) | 142 (Unhealthy for Sensitive Groups) | 110 (Moderate) | 93 (Moderate) | 77 (Moderate) | 76 (Moderate) | 95 (Moderate) | 120 (Unhealthy for Sensitive Groups) | 114 (Moderate) | 136 (Unhealthy for Sensitive Groups) | 159 (Unhealthy) | 165 (Unhealthy) | 163 (Unhealthy) | 129 (Unhealthy for Sensitive Groups) | 113 (Moderate) | 89 (Moderate) | 72 (Moderate) | 65 (Good) | 104 (Moderate) | 123 (Unhealthy for Sensitive Groups) |
| pm10 | 48 (Moderate) | 57 (Unhealthy for Sensitive Groups) | 43 (Moderate) | 38 (Moderate) | 58 (Unhealthy for Sensitive Groups) | 62 (Unhealthy for Sensitive Groups) | 69 (Unhealthy for Sensitive Groups) | 64 (Unhealthy for Sensitive Groups) | 36 (Moderate) | 37 (Moderate) | 40 (Moderate) | 39 (Moderate) | 69 (Unhealthy for Sensitive Groups) | 61 (Unhealthy for Sensitive Groups) | 81 (Unhealthy) | 67 (Unhealthy for Sensitive Groups) | 75 (Unhealthy for Sensitive Groups) | 72 (Unhealthy for Sensitive Groups) | 77 (Unhealthy for Sensitive Groups) | 70 (Unhealthy for Sensitive Groups) |
| so2 | 9.6 (Good) | 8.8 (Good) | 6.7 (Good) | 3.9 (Good) | 6.3 (Good) | 8.6 (Good) | 7.2 (Good) | 8.1 (Good) | 6.3 (Good) | 9.1 (Good) | 7.6 (Good) | 9.6 (Good) | 13 (Good) | 12 (Good) | 8.6 (Good) | 4.1 (Good) | 7.2 (Good) | 14 (Good) | 13 (Good) | 14 (Good) |
PM10 179 (非常糟糕的危险性)
颗粒物(PM10)悬浮尘埃PM2,5 35 (敏感组不正常)
尘埃O3 0.04 (好)
臭氧 (O3)NO2 0 (好)
二氧化氮(NO2)SO2 0 (好)
二氧化硫 (SO2)虹桥
| index | 2022-05-27 |
|---|---|
| pm10 | 56 |
| pm25 | 56 |
| o3 | 0.03 |
| no2 | 0 |
| so2 | 0 |
虹桥

| index | 2020-05 | 2020-04 | 2020-03 | 2020-02 | 2020-01 | 2019-12 | 2019-11 | 2019-10 | 2019-09 | 2019-08 | 2019-07 | 2019-06 | 2019-05 | 2019-04 | 2019-03 | 2019-02 | 2019-01 | 2018-12 | 2018-11 | 2018-10 |
|---|---|---|---|---|---|---|---|---|---|---|---|---|---|---|---|---|---|---|---|---|
| pm25 | 35 | 40 | 32 | 37 | 65 | 56 | 36 | 36 | 21 | 23 | 26 | 26 | 36 | 39 | 59 | 56 | 61 | 49 | 62 | 43 |
| co | 648 | 755 | 617 | 609 | 671 | 782 | 649 | 572 | 493 | 577 | 422 | 551 | 639 | 763 | 698 | 798 | 798 | 658 | 697 | 573 |
| no2 | 23 | 32 | 27 | 18 | 27 | 46 | 37 | 32 | 22 | 21 | 28 | 31 | 33 | 30 | 44 | 25 | 38 | 37 | 39 | 31 |
| o3 | 143 | 142 | 110 | 93 | 77 | 76 | 95 | 120 | 114 | 136 | 159 | 165 | 163 | 129 | 113 | 89 | 72 | 65 | 104 | 123 |
| pm10 | 48 | 57 | 43 | 38 | 58 | 62 | 69 | 64 | 36 | 37 | 40 | 39 | 69 | 61 | 81 | 67 | 75 | 72 | 77 | 70 |
| so2 | 9.6 | 8.8 | 6.7 | 3.9 | 6.3 | 8.6 | 7.2 | 8.1 | 6.3 | 9.1 | 7.6 | 9.6 | 13 | 12 | 8.6 | 4.1 | 7.2 | 14 | 13 | 14 |