Luchtverontreiniging in Padre Las Casas: Real-time Air Quality Index en smog alert.
Vervuiling en luchtkwaliteit voorspeld voor Padre Las Casas. Vandaag is donderdag 14 mei 2026. Voor Padre Las Casas zijn de volgende luchtverontreinigingswaarden geregistreerd:- stofdeeltjes (PM10) in suspensie - 43 (Matige)
- stofdeeltjes (PM2.5) - 36 (Ongezond voor gevoelige groepen)

Wat is de luchtkwaliteit vandaag de Padre Las Casas dag? Is de lucht vervuild in Padre Las Casas? Is er smog?
Wat is het niveau van PM10 vandaag in Padre Las Casas? (stofdeeltjes (PM10) in suspensie)
Het huidige niveau van fijnstof PM10 in Padre Las Casas is:
43 (Matige)
De hoogste PM10-waarden komen meestal voor in maand: 146 (juni 2016).
De laagste waarde van deeltjes PM10 vervuiling in Padre Las Casas wordt meestal geregistreerd in: februari (18).
Wat is het huidige niveau van PM2,5 in Padre Las Casas? (stofdeeltjes (PM2.5))
Vandaag PM2.5 niveau is:
36 (Ongezond voor gevoelige groepen)
Ter vergelijking: het hoogste niveau van PM2,5 in Padre Las Casas in de afgelopen 7 dagen was: 72 (donderdag 11 april 2024) en het laagste: 36 (maandag 15 april 2024).
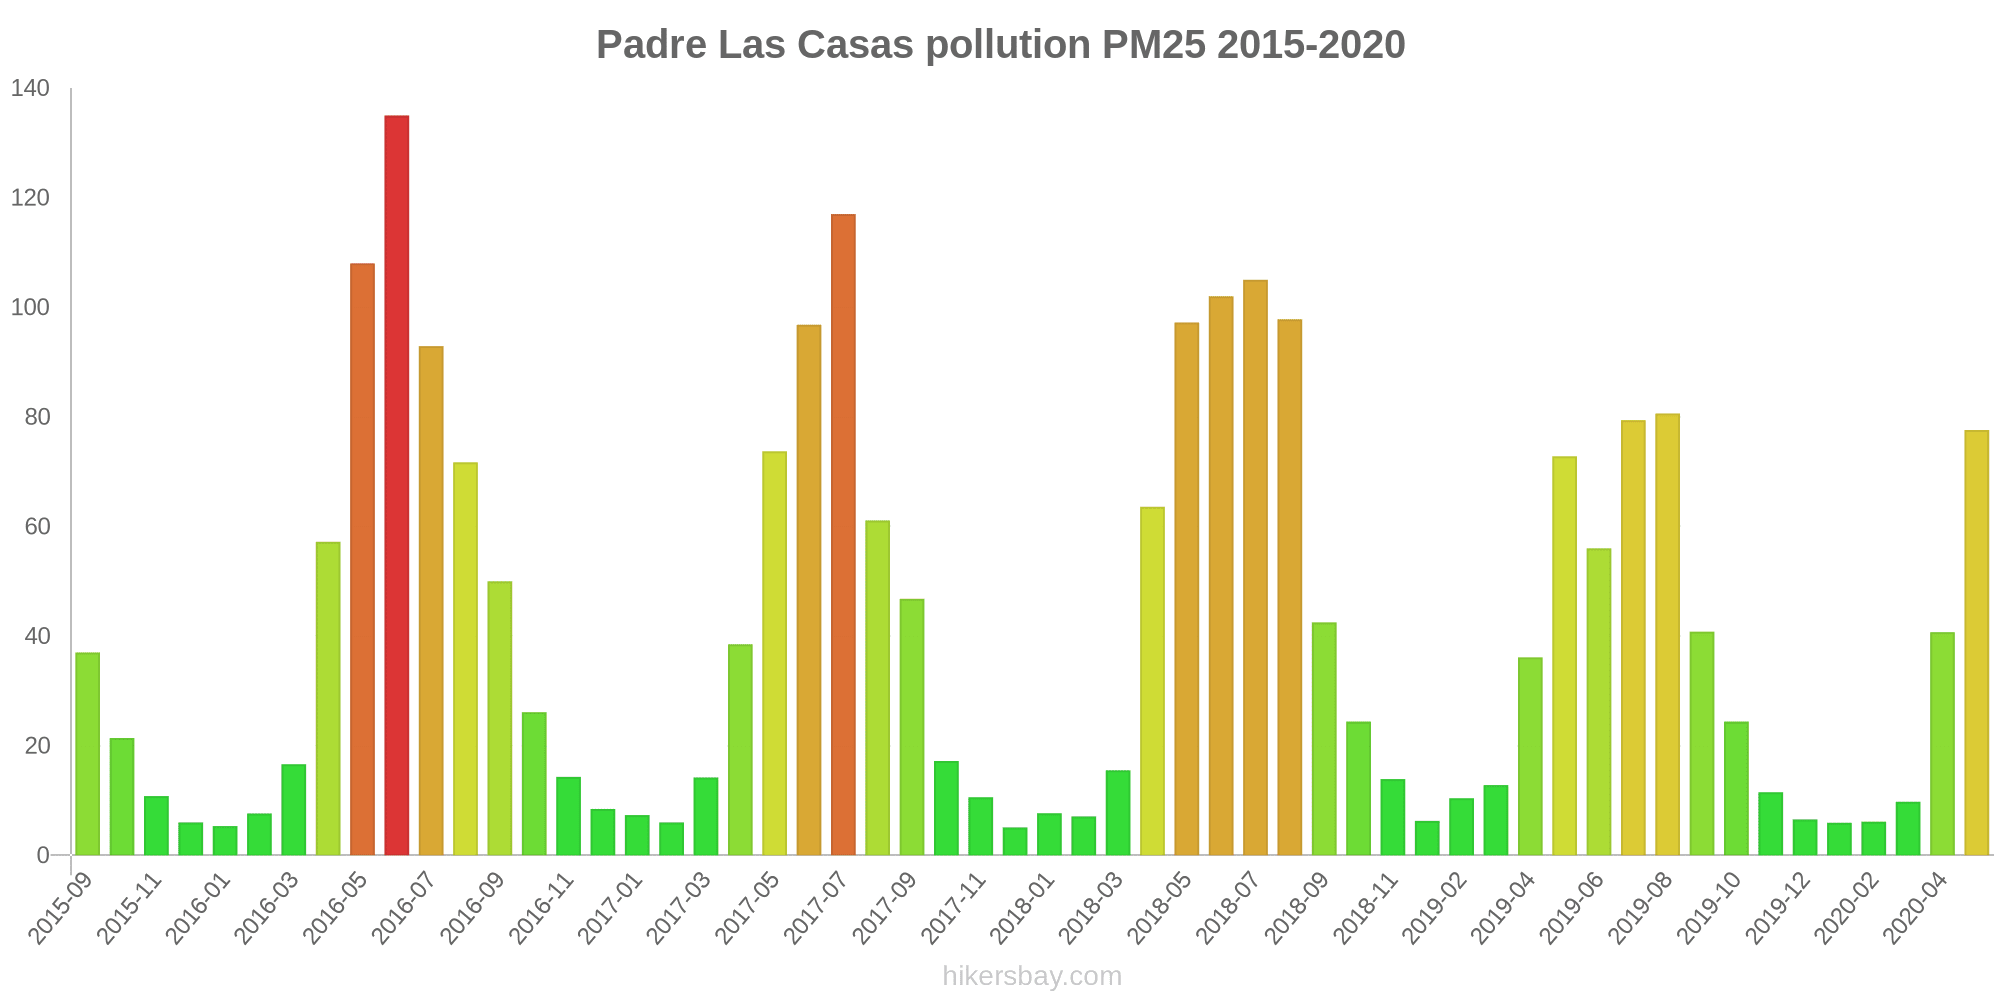
De hoogste PM2,5-waarden werden geregistreerd: 135 (juni 2016).
Het laagste niveau van fijnstof PM2,5 vervuiling vindt plaats in maand: december (5.1).
Huidige gegevens dinsdag 16 april 2024 08:00
PM10 43 (Matige)
PM2,5 36 (Ongezond voor gevoelige groepen)
Gegevens over luchtvervuiling van de afgelopen dagen in Padre Las Casas
index
2024-04-10
2024-04-11
2024-04-12
2024-04-13
2024-04-14
2024-04-15
2024-04-16
pm10
26
Moderate
84
Unhealthy
57
Unhealthy for Sensitive Groups
63
Unhealthy for Sensitive Groups
50
Unhealthy for Sensitive Groups
40
Moderate
44
Moderate
pm25
39
Unhealthy for Sensitive Groups
72
Unhealthy
46
Unhealthy for Sensitive Groups
48
Unhealthy for Sensitive Groups
38
Unhealthy for Sensitive Groups
36
Unhealthy for Sensitive Groups
38
Unhealthy for Sensitive Groups
data source »
Luchtvervuiling in Padre Las Casas van september 2015 to mei 2020

index
2020-05
2020-04
2020-03
2020-02
2020-01
2019-12
2019-11
2019-10
2019-09
2019-08
2019-07
2019-06
2019-05
2019-04
2019-03
2019-02
2019-01
2018-11
2018-10
2018-09
2018-08
2018-07
2018-06
2018-05
2018-04
2018-03
2018-02
2018-01
2017-12
2017-11
2017-10
2017-09
2017-08
2017-07
2017-06
2017-05
2017-04
2017-03
2017-02
2017-01
2016-12
2016-11
2016-10
2016-09
2016-08
2016-07
2016-06
2016-05
2016-04
2016-03
2016-02
2016-01
2015-12
2015-11
2015-10
2015-09
co
1 (Good)
874 (Good)
220 (Good)
131 (Good)
73 (Good)
261 (Good)
312 (Good)
433 (Good)
771 (Good)
1 (Good)
1 (Good)
814 (Good)
1 (Good)
630 (Good)
250 (Good)
448 (Good)
173 (Good)
308 (Good)
653 (Good)
862 (Good)
1 (Good)
1 (Good)
1 (Good)
1 (Good)
1 (Good)
405 (Good)
244 (Good)
311 (Good)
172 (Good)
322 (Good)
385 (Good)
983 (Good)
889 (Good)
1 (Good)
1 (Good)
1 (Good)
795 (Good)
434 (Good)
540 (Good)
335 (Good)
356 (Good)
312 (Good)
463 (Good)
812 (Good)
965 (Good)
1 (Good)
1 (Good)
1 (Good)
967 (Good)
277 (Good)
304 (Good)
229 (Good)
277 (Good)
372 (Good)
672 (Good)
688 (Good)
pm25
78 (Very Unhealthy)
41 (Unhealthy for Sensitive Groups)
9.8 (Good)
6.1 (Good)
5.9 (Good)
6.5 (Good)
12 (Good)
24 (Moderate)
41 (Unhealthy for Sensitive Groups)
81 (Very Unhealthy)
79 (Very Unhealthy)
56 (Unhealthy)
73 (Unhealthy)
36 (Unhealthy for Sensitive Groups)
13 (Good)
10 (Good)
6.3 (Good)
14 (Moderate)
24 (Moderate)
43 (Unhealthy for Sensitive Groups)
98 (Very Unhealthy)
105 (Very Unhealthy)
102 (Very Unhealthy)
97 (Very Unhealthy)
64 (Unhealthy)
16 (Moderate)
7.1 (Good)
7.7 (Good)
5.1 (Good)
11 (Good)
17 (Moderate)
47 (Unhealthy for Sensitive Groups)
61 (Unhealthy)
117 (Very bad Hazardous)
97 (Very Unhealthy)
74 (Unhealthy)
39 (Unhealthy for Sensitive Groups)
14 (Moderate)
6 (Good)
7.3 (Good)
8.4 (Good)
14 (Moderate)
26 (Moderate)
50 (Unhealthy for Sensitive Groups)
72 (Unhealthy)
93 (Very Unhealthy)
135 (Very bad Hazardous)
108 (Very Unhealthy)
57 (Unhealthy)
17 (Moderate)
7.6 (Good)
5.3 (Good)
6 (Good)
11 (Good)
21 (Moderate)
37 (Unhealthy for Sensitive Groups)
pm10
79 (Unhealthy for Sensitive Groups)
47 (Moderate)
22 (Moderate)
19 (Good)
19 (Good)
19 (Good)
24 (Moderate)
34 (Moderate)
41 (Moderate)
84 (Unhealthy)
79 (Unhealthy for Sensitive Groups)
61 (Unhealthy for Sensitive Groups)
81 (Unhealthy)
47 (Moderate)
31 (Moderate)
32 (Moderate)
22 (Moderate)
27 (Moderate)
38 (Moderate)
58 (Unhealthy for Sensitive Groups)
117 (Very Unhealthy)
120 (Very Unhealthy)
113 (Very Unhealthy)
109 (Unhealthy)
70 (Unhealthy for Sensitive Groups)
29 (Moderate)
22 (Moderate)
24 (Moderate)
22 (Moderate)
28 (Moderate)
29 (Moderate)
79 (Unhealthy for Sensitive Groups)
70 (Unhealthy for Sensitive Groups)
120 (Very Unhealthy)
100 (Unhealthy)
85 (Unhealthy)
52 (Unhealthy for Sensitive Groups)
31 (Moderate)
18 (Good)
19 (Good)
18 (Good)
26 (Moderate)
33 (Moderate)
65 (Unhealthy for Sensitive Groups)
78 (Unhealthy for Sensitive Groups)
95 (Unhealthy)
146 (Very Unhealthy)
125 (Very Unhealthy)
71 (Unhealthy for Sensitive Groups)
38 (Moderate)
23 (Moderate)
27 (Moderate)
21 (Moderate)
26 (Moderate)
34 (Moderate)
44 (Moderate)
data source »
Padre Las Casas II
dinsdag 16 april 2024 08:00
PM10 43 (Matige)
stofdeeltjes (PM10) in suspensie
PM2,5 36 (Ongezond voor gevoelige groepen)
stofdeeltjes (PM2.5)
Padre Las Casas II
index
2024-04-16
2024-04-15
2024-04-14
2024-04-13
2024-04-12
2024-04-11
2024-04-10
pm10
44
40
50
63
57
84
26
pm25
38
36
38
48
46
72
39
Padre Las Casas II
2015-09 2020-05

index
2020-05
2020-04
2020-03
2020-02
2020-01
2019-12
2019-11
2019-10
2019-09
2019-08
2019-07
2019-06
2019-05
2019-04
2019-03
2019-02
2019-01
2018-11
2018-10
2018-09
2018-08
2018-07
2018-06
2018-05
2018-04
2018-03
2018-02
2018-01
2017-12
2017-11
2017-10
2017-09
2017-08
2017-07
2017-06
2017-05
2017-04
2017-03
2017-02
2017-01
2016-12
2016-11
2016-10
2016-09
2016-08
2016-07
2016-06
2016-05
2016-04
2016-03
2016-02
2016-01
2015-12
2015-11
2015-10
2015-09
co
1
874
220
131
73
261
312
433
771
1
1
814
1
630
250
448
173
308
653
862
1
1
1
1
1
405
244
311
172
322
385
983
889
1
1
1
795
434
540
335
356
312
463
812
965
1
1
1
967
277
304
229
277
372
672
688
pm25
78
41
9.8
6.1
5.9
6.5
12
24
41
81
79
56
73
36
13
10
6.3
14
24
43
98
105
102
97
64
16
7.1
7.7
5.1
11
17
47
61
117
97
74
39
14
6
7.3
8.4
14
26
50
72
93
135
108
57
17
7.6
5.3
6
11
21
37
pm10
79
47
22
19
19
19
24
34
41
84
79
61
81
47
31
32
22
27
38
58
117
120
113
109
70
29
22
24
22
28
29
79
70
120
100
85
52
31
18
19
18
26
33
65
78
95
146
125
71
38
23
27
21
26
34
44
* Pollution data source:
https://openaq.org
(Chile - SINCA)
The data is licensed under CC-By 4.0
PM10 43 (Matige)
PM2,5 36 (Ongezond voor gevoelige groepen)
Gegevens over luchtvervuiling van de afgelopen dagen in Padre Las Casas
| index | 2024-04-10 | 2024-04-11 | 2024-04-12 | 2024-04-13 | 2024-04-14 | 2024-04-15 | 2024-04-16 |
|---|---|---|---|---|---|---|---|
| pm10 | 26 Moderate |
84 Unhealthy |
57 Unhealthy for Sensitive Groups |
63 Unhealthy for Sensitive Groups |
50 Unhealthy for Sensitive Groups |
40 Moderate |
44 Moderate |
| pm25 | 39 Unhealthy for Sensitive Groups |
72 Unhealthy |
46 Unhealthy for Sensitive Groups |
48 Unhealthy for Sensitive Groups |
38 Unhealthy for Sensitive Groups |
36 Unhealthy for Sensitive Groups |
38 Unhealthy for Sensitive Groups |
| index | 2020-05 | 2020-04 | 2020-03 | 2020-02 | 2020-01 | 2019-12 | 2019-11 | 2019-10 | 2019-09 | 2019-08 | 2019-07 | 2019-06 | 2019-05 | 2019-04 | 2019-03 | 2019-02 | 2019-01 | 2018-11 | 2018-10 | 2018-09 | 2018-08 | 2018-07 | 2018-06 | 2018-05 | 2018-04 | 2018-03 | 2018-02 | 2018-01 | 2017-12 | 2017-11 | 2017-10 | 2017-09 | 2017-08 | 2017-07 | 2017-06 | 2017-05 | 2017-04 | 2017-03 | 2017-02 | 2017-01 | 2016-12 | 2016-11 | 2016-10 | 2016-09 | 2016-08 | 2016-07 | 2016-06 | 2016-05 | 2016-04 | 2016-03 | 2016-02 | 2016-01 | 2015-12 | 2015-11 | 2015-10 | 2015-09 |
|---|---|---|---|---|---|---|---|---|---|---|---|---|---|---|---|---|---|---|---|---|---|---|---|---|---|---|---|---|---|---|---|---|---|---|---|---|---|---|---|---|---|---|---|---|---|---|---|---|---|---|---|---|---|---|---|---|
| co | 1 (Good) | 874 (Good) | 220 (Good) | 131 (Good) | 73 (Good) | 261 (Good) | 312 (Good) | 433 (Good) | 771 (Good) | 1 (Good) | 1 (Good) | 814 (Good) | 1 (Good) | 630 (Good) | 250 (Good) | 448 (Good) | 173 (Good) | 308 (Good) | 653 (Good) | 862 (Good) | 1 (Good) | 1 (Good) | 1 (Good) | 1 (Good) | 1 (Good) | 405 (Good) | 244 (Good) | 311 (Good) | 172 (Good) | 322 (Good) | 385 (Good) | 983 (Good) | 889 (Good) | 1 (Good) | 1 (Good) | 1 (Good) | 795 (Good) | 434 (Good) | 540 (Good) | 335 (Good) | 356 (Good) | 312 (Good) | 463 (Good) | 812 (Good) | 965 (Good) | 1 (Good) | 1 (Good) | 1 (Good) | 967 (Good) | 277 (Good) | 304 (Good) | 229 (Good) | 277 (Good) | 372 (Good) | 672 (Good) | 688 (Good) |
| pm25 | 78 (Very Unhealthy) | 41 (Unhealthy for Sensitive Groups) | 9.8 (Good) | 6.1 (Good) | 5.9 (Good) | 6.5 (Good) | 12 (Good) | 24 (Moderate) | 41 (Unhealthy for Sensitive Groups) | 81 (Very Unhealthy) | 79 (Very Unhealthy) | 56 (Unhealthy) | 73 (Unhealthy) | 36 (Unhealthy for Sensitive Groups) | 13 (Good) | 10 (Good) | 6.3 (Good) | 14 (Moderate) | 24 (Moderate) | 43 (Unhealthy for Sensitive Groups) | 98 (Very Unhealthy) | 105 (Very Unhealthy) | 102 (Very Unhealthy) | 97 (Very Unhealthy) | 64 (Unhealthy) | 16 (Moderate) | 7.1 (Good) | 7.7 (Good) | 5.1 (Good) | 11 (Good) | 17 (Moderate) | 47 (Unhealthy for Sensitive Groups) | 61 (Unhealthy) | 117 (Very bad Hazardous) | 97 (Very Unhealthy) | 74 (Unhealthy) | 39 (Unhealthy for Sensitive Groups) | 14 (Moderate) | 6 (Good) | 7.3 (Good) | 8.4 (Good) | 14 (Moderate) | 26 (Moderate) | 50 (Unhealthy for Sensitive Groups) | 72 (Unhealthy) | 93 (Very Unhealthy) | 135 (Very bad Hazardous) | 108 (Very Unhealthy) | 57 (Unhealthy) | 17 (Moderate) | 7.6 (Good) | 5.3 (Good) | 6 (Good) | 11 (Good) | 21 (Moderate) | 37 (Unhealthy for Sensitive Groups) |
| pm10 | 79 (Unhealthy for Sensitive Groups) | 47 (Moderate) | 22 (Moderate) | 19 (Good) | 19 (Good) | 19 (Good) | 24 (Moderate) | 34 (Moderate) | 41 (Moderate) | 84 (Unhealthy) | 79 (Unhealthy for Sensitive Groups) | 61 (Unhealthy for Sensitive Groups) | 81 (Unhealthy) | 47 (Moderate) | 31 (Moderate) | 32 (Moderate) | 22 (Moderate) | 27 (Moderate) | 38 (Moderate) | 58 (Unhealthy for Sensitive Groups) | 117 (Very Unhealthy) | 120 (Very Unhealthy) | 113 (Very Unhealthy) | 109 (Unhealthy) | 70 (Unhealthy for Sensitive Groups) | 29 (Moderate) | 22 (Moderate) | 24 (Moderate) | 22 (Moderate) | 28 (Moderate) | 29 (Moderate) | 79 (Unhealthy for Sensitive Groups) | 70 (Unhealthy for Sensitive Groups) | 120 (Very Unhealthy) | 100 (Unhealthy) | 85 (Unhealthy) | 52 (Unhealthy for Sensitive Groups) | 31 (Moderate) | 18 (Good) | 19 (Good) | 18 (Good) | 26 (Moderate) | 33 (Moderate) | 65 (Unhealthy for Sensitive Groups) | 78 (Unhealthy for Sensitive Groups) | 95 (Unhealthy) | 146 (Very Unhealthy) | 125 (Very Unhealthy) | 71 (Unhealthy for Sensitive Groups) | 38 (Moderate) | 23 (Moderate) | 27 (Moderate) | 21 (Moderate) | 26 (Moderate) | 34 (Moderate) | 44 (Moderate) |
PM10 43 (Matige)
stofdeeltjes (PM10) in suspensiePM2,5 36 (Ongezond voor gevoelige groepen)
stofdeeltjes (PM2.5)Padre Las Casas II
| index | 2024-04-16 | 2024-04-15 | 2024-04-14 | 2024-04-13 | 2024-04-12 | 2024-04-11 | 2024-04-10 |
|---|---|---|---|---|---|---|---|
| pm10 | 44 | 40 | 50 | 63 | 57 | 84 | 26 |
| pm25 | 38 | 36 | 38 | 48 | 46 | 72 | 39 |
Padre Las Casas II

| index | 2020-05 | 2020-04 | 2020-03 | 2020-02 | 2020-01 | 2019-12 | 2019-11 | 2019-10 | 2019-09 | 2019-08 | 2019-07 | 2019-06 | 2019-05 | 2019-04 | 2019-03 | 2019-02 | 2019-01 | 2018-11 | 2018-10 | 2018-09 | 2018-08 | 2018-07 | 2018-06 | 2018-05 | 2018-04 | 2018-03 | 2018-02 | 2018-01 | 2017-12 | 2017-11 | 2017-10 | 2017-09 | 2017-08 | 2017-07 | 2017-06 | 2017-05 | 2017-04 | 2017-03 | 2017-02 | 2017-01 | 2016-12 | 2016-11 | 2016-10 | 2016-09 | 2016-08 | 2016-07 | 2016-06 | 2016-05 | 2016-04 | 2016-03 | 2016-02 | 2016-01 | 2015-12 | 2015-11 | 2015-10 | 2015-09 |
|---|---|---|---|---|---|---|---|---|---|---|---|---|---|---|---|---|---|---|---|---|---|---|---|---|---|---|---|---|---|---|---|---|---|---|---|---|---|---|---|---|---|---|---|---|---|---|---|---|---|---|---|---|---|---|---|---|
| co | 1 | 874 | 220 | 131 | 73 | 261 | 312 | 433 | 771 | 1 | 1 | 814 | 1 | 630 | 250 | 448 | 173 | 308 | 653 | 862 | 1 | 1 | 1 | 1 | 1 | 405 | 244 | 311 | 172 | 322 | 385 | 983 | 889 | 1 | 1 | 1 | 795 | 434 | 540 | 335 | 356 | 312 | 463 | 812 | 965 | 1 | 1 | 1 | 967 | 277 | 304 | 229 | 277 | 372 | 672 | 688 |
| pm25 | 78 | 41 | 9.8 | 6.1 | 5.9 | 6.5 | 12 | 24 | 41 | 81 | 79 | 56 | 73 | 36 | 13 | 10 | 6.3 | 14 | 24 | 43 | 98 | 105 | 102 | 97 | 64 | 16 | 7.1 | 7.7 | 5.1 | 11 | 17 | 47 | 61 | 117 | 97 | 74 | 39 | 14 | 6 | 7.3 | 8.4 | 14 | 26 | 50 | 72 | 93 | 135 | 108 | 57 | 17 | 7.6 | 5.3 | 6 | 11 | 21 | 37 |
| pm10 | 79 | 47 | 22 | 19 | 19 | 19 | 24 | 34 | 41 | 84 | 79 | 61 | 81 | 47 | 31 | 32 | 22 | 27 | 38 | 58 | 117 | 120 | 113 | 109 | 70 | 29 | 22 | 24 | 22 | 28 | 29 | 79 | 70 | 120 | 100 | 85 | 52 | 31 | 18 | 19 | 18 | 26 | 33 | 65 | 78 | 95 | 146 | 125 | 71 | 38 | 23 | 27 | 21 | 26 | 34 | 44 |