Yamunanagar 대기 오염: 실시간 대기 질 지수 및 스모그 경보.
Yamunanagar 대한 오염 및 대기 질 예측. 오늘은 2026년 5월 13일 수요일. 다음과 같은 대기 오염 값이 Yamunanagar 기록되었습니다.- 미세먼지(PM10) 미세먼지 - 112 (매우 건강에 해로운)
- 이산화황 (SO2) - 12 (좋은)
- 미세먼지(PM2.5) 먼지 - 54 (민감한 그룹에 대 한 건강에 해로운)
- 일산화탄소 (CO) - 1240 (좋은)
- 이산화질소 (NO2) - 4 (좋은)
- 오존 (O3) - 2 (좋은)

오늘날 Yamunanagar 공기 질은 무엇입니까? 공기는 Yamunanagar 오염되어 있습니까?. 스모그가 있습니까?
Yamunanagar PM10의 수준은 무엇입니까? (미세먼지(PM10) 미세먼지)
Yamunanagar 의 현재 수준의 미립자 물질 PM10:
112 (매우 건강에 해로운)
가장 높은 PM10 값은 일반적으로 월에서 발생합니다: 244 (2019년 2월).
미립자 물질 PM10 오염의 가장 낮은 값 Yamunanagar 은 일반적으로 기록됩니다: 4월 (80).
SO2 오염 수준은 어떻습니까? (이산화황 (SO2))
12 (좋은)
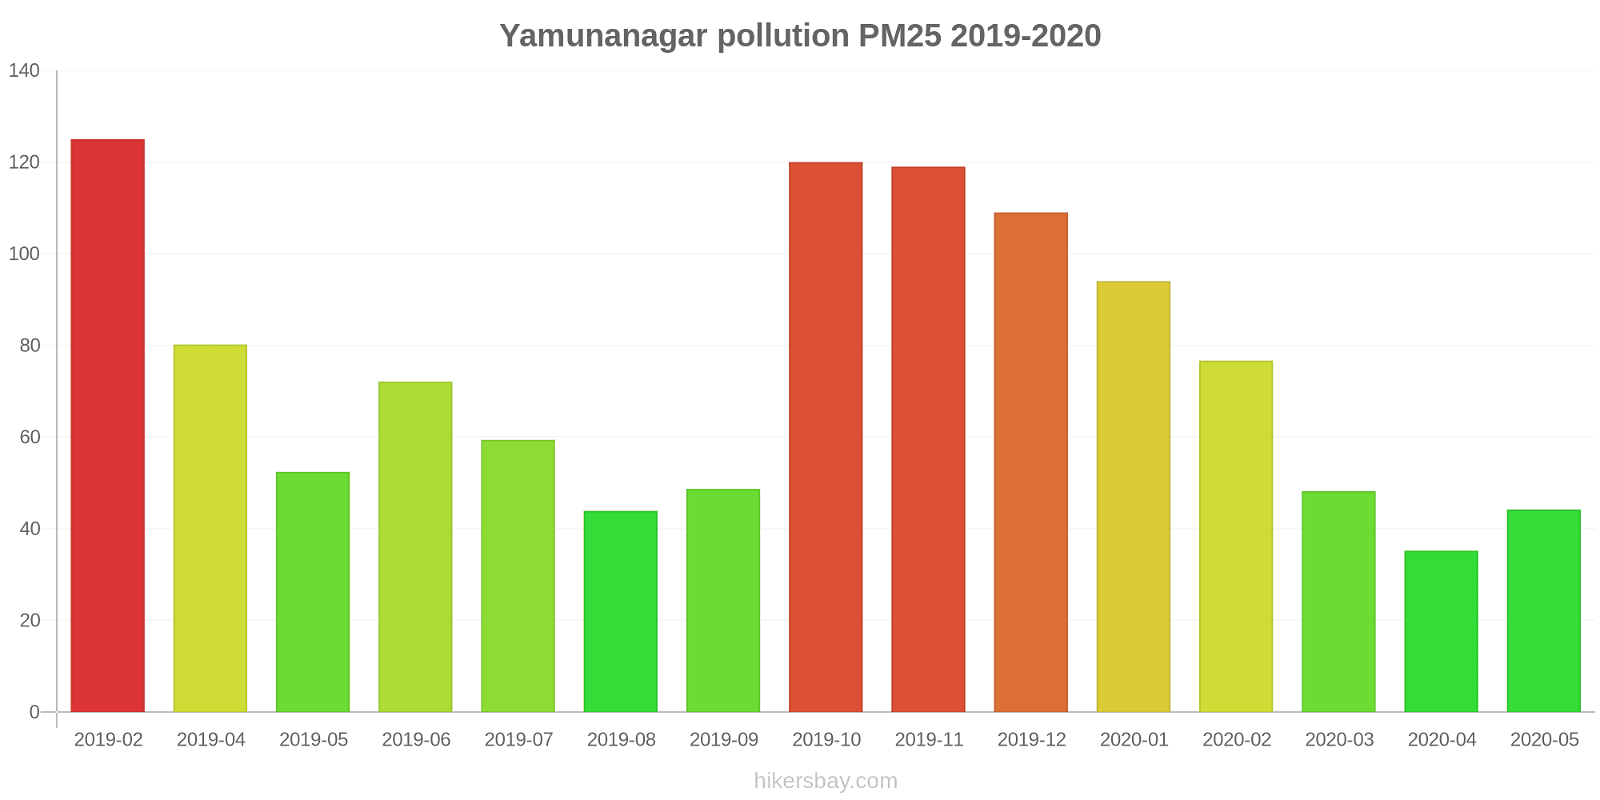
Yamunanagar PM2.5의 현재 수준은 무엇입니까? (미세먼지(PM2.5) 먼지)
오늘의 PM2.5 수준은 다음과 같은 것입니다.
54 (민감한 그룹에 대 한 건강에 해로운)
비교를 위해, 지난 7 일 Yamunanagar PM2.5의 가장 높은 수준은: 53 (2022년 10월 31일 월요일) 가장 낮은: 53 (2022년 10월 31일 월요일).
가장 높은 PM2.5 값이 기록되었습니다: 125 (2019년 2월).
미세먼지 의 최저 수준 PM2.5 오염은 월에서 발생합니다: 4월 (35).
CO 수준은 얼마나 높습니까? (일산화탄소 (CO))
1240 (좋은)
NO2 수준은 얼마나 높습니까? (이산화질소 (NO2))
4 (좋은)
오늘날 O3 수준은 Yamunanagar? (오존 (O3))
2 (좋은)
현재 데이터 2022년 10월 31일 월요일 오전 1:30
PM10 112 (매우 건강에 해로운)
SO2 12 (좋은)
PM2,5 54 (민감한 그룹에 대 한 건강에 해로운)
CO 1240 (좋은)
NO2 4 (좋은)
O3 2 (좋은)
최근 며칠 간의 대기 오염에 대한 데이터 Yamunanagar
index
2022-10-31
pm10
110
Very Unhealthy
so2
39
Good
pm25
53
Unhealthy for Sensitive Groups
co
980
Good
no2
3
Good
o3
2
Good
data source »
Yamunanagar 에서 2019년 2월 2020년 5월
index
2020-05
2020-04
2020-03
2020-02
2020-01
2019-12
2019-11
2019-10
2019-09
2019-08
2019-07
2019-06
2019-05
2019-04
2019-02
pm25
44 (Unhealthy for Sensitive Groups)
35 (Unhealthy for Sensitive Groups)
48 (Unhealthy for Sensitive Groups)
77 (Very Unhealthy)
94 (Very Unhealthy)
109 (Very Unhealthy)
119 (Very bad Hazardous)
120 (Very bad Hazardous)
49 (Unhealthy for Sensitive Groups)
44 (Unhealthy for Sensitive Groups)
59 (Unhealthy)
72 (Unhealthy)
52 (Unhealthy for Sensitive Groups)
80 (Very Unhealthy)
125 (Very bad Hazardous)
pm10
100 (Unhealthy)
80 (Unhealthy for Sensitive Groups)
92 (Unhealthy)
139 (Very Unhealthy)
145 (Very Unhealthy)
172 (Very bad Hazardous)
198 (Very bad Hazardous)
216 (Very bad Hazardous)
98 (Unhealthy)
87 (Unhealthy)
107 (Unhealthy)
159 (Very bad Hazardous)
102 (Unhealthy)
207 (Very bad Hazardous)
244 (Very bad Hazardous)
no2
19 (Good)
23 (Good)
33 (Good)
27 (Good)
30 (Good)
28 (Good)
55 (Moderate)
34 (Good)
9.8 (Good)
15 (Good)
12 (Good)
17 (Good)
44 (Moderate)
42 (Moderate)
53 (Moderate)
so2
30 (Good)
39 (Good)
47 (Good)
29 (Good)
37 (Good)
18 (Good)
28 (Good)
15 (Good)
8.5 (Good)
8.2 (Good)
7.2 (Good)
7.6 (Good)
12 (Good)
6.9 (Good)
25 (Good)
co
548 (Good)
315 (Good)
465 (Good)
648 (Good)
873 (Good)
926 (Good)
955 (Good)
1 (Good)
667 (Good)
808 (Good)
772 (Good)
640 (Good)
613 (Good)
586 (Good)
1 (Good)
o3
13 (Good)
55 (Good)
33 (Good)
33 (Good)
28 (Good)
23 (Good)
42 (Good)
59 (Good)
46 (Good)
33 (Good)
53 (Good)
52 (Good)
23 (Good)
29 (Good)
64 (Good)
data source »
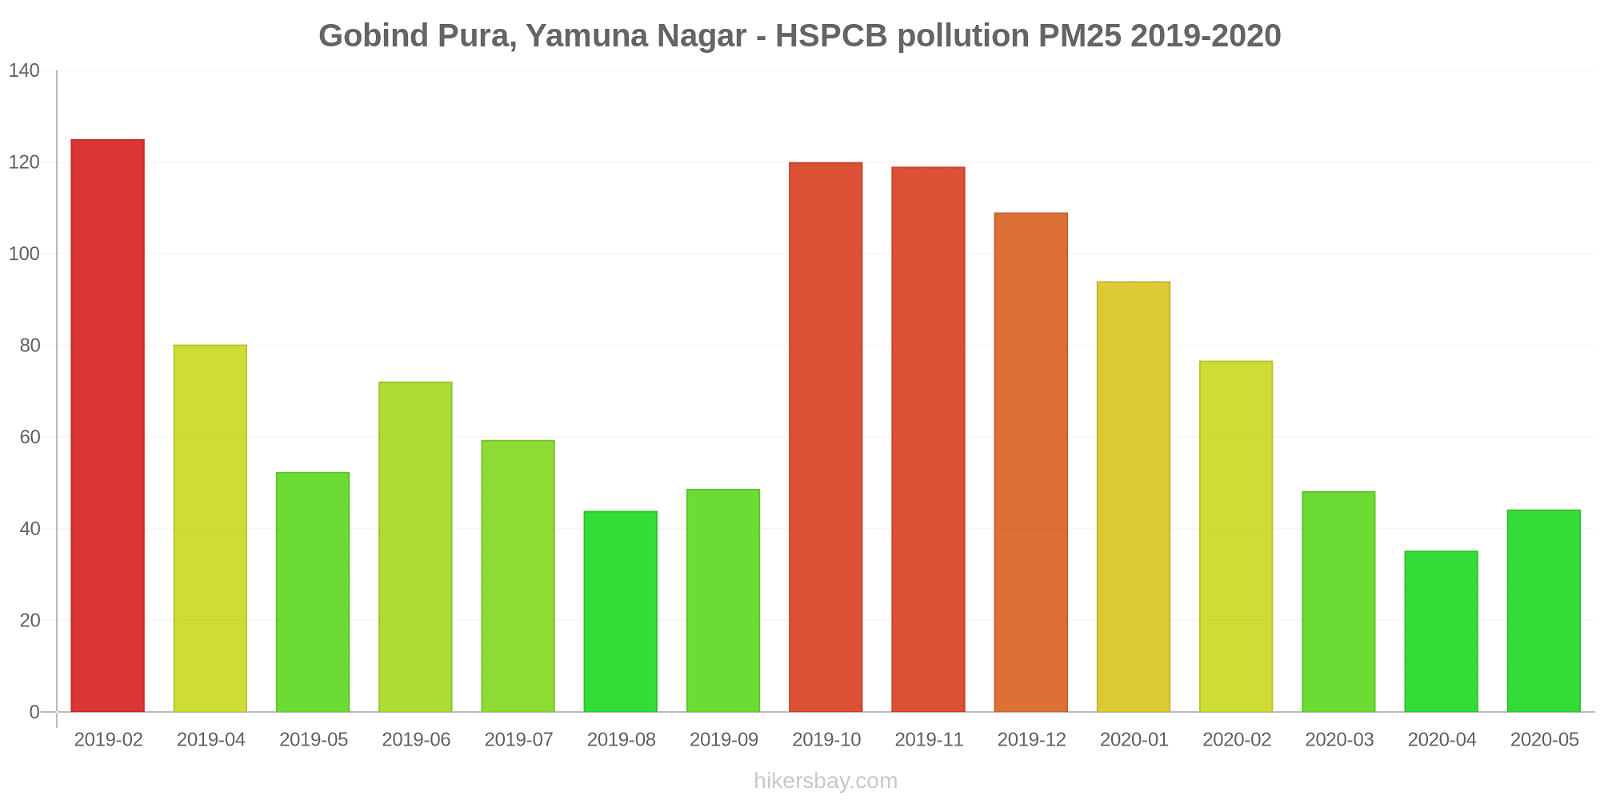
Gobind Pura, Yamuna Nagar - HSPCB
2022년 10월 31일 월요일 오전 1:30
PM10 112 (매우 건강에 해로운)
미세먼지(PM10) 미세먼지
SO2 12 (좋은)
이산화황 (SO2)
PM2,5 54 (민감한 그룹에 대 한 건강에 해로운)
미세먼지(PM2.5) 먼지
CO 1240 (좋은)
일산화탄소 (CO)
NO2 3.5 (좋은)
이산화질소 (NO2)
O3 1.7 (좋은)
오존 (O3)
Gobind Pura, Yamuna Nagar - HSPCB
index
2022-10-31
pm10
110
so2
39
pm25
53
co
980
no2
3.3
o3
1.7
Gobind Pura, Yamuna Nagar - HSPCB
2019-02 2020-05
index
2020-05
2020-04
2020-03
2020-02
2020-01
2019-12
2019-11
2019-10
2019-09
2019-08
2019-07
2019-06
2019-05
2019-04
2019-02
pm25
44
35
48
77
94
109
119
120
49
44
59
72
52
80
125
pm10
100
80
92
139
145
172
198
216
98
87
107
159
102
207
244
no2
19
23
33
27
30
28
55
34
9.8
15
12
17
44
42
53
so2
30
39
47
29
37
18
28
15
8.5
8.2
7.2
7.6
12
6.9
25
co
548
315
465
648
873
926
955
1
667
808
772
640
613
586
1
o3
13
55
33
33
28
23
42
59
46
33
53
52
23
29
64
* Pollution data source:
https://openaq.org
(caaqm)
The data is licensed under CC-By 4.0
PM10 112 (매우 건강에 해로운)
SO2 12 (좋은)
PM2,5 54 (민감한 그룹에 대 한 건강에 해로운)
CO 1240 (좋은)
NO2 4 (좋은)
O3 2 (좋은)
최근 며칠 간의 대기 오염에 대한 데이터 Yamunanagar
| index | 2022-10-31 |
|---|---|
| pm10 | 110 Very Unhealthy |
| so2 | 39 Good |
| pm25 | 53 Unhealthy for Sensitive Groups |
| co | 980 Good |
| no2 | 3 Good |
| o3 | 2 Good |

| index | 2020-05 | 2020-04 | 2020-03 | 2020-02 | 2020-01 | 2019-12 | 2019-11 | 2019-10 | 2019-09 | 2019-08 | 2019-07 | 2019-06 | 2019-05 | 2019-04 | 2019-02 |
|---|---|---|---|---|---|---|---|---|---|---|---|---|---|---|---|
| pm25 | 44 (Unhealthy for Sensitive Groups) | 35 (Unhealthy for Sensitive Groups) | 48 (Unhealthy for Sensitive Groups) | 77 (Very Unhealthy) | 94 (Very Unhealthy) | 109 (Very Unhealthy) | 119 (Very bad Hazardous) | 120 (Very bad Hazardous) | 49 (Unhealthy for Sensitive Groups) | 44 (Unhealthy for Sensitive Groups) | 59 (Unhealthy) | 72 (Unhealthy) | 52 (Unhealthy for Sensitive Groups) | 80 (Very Unhealthy) | 125 (Very bad Hazardous) |
| pm10 | 100 (Unhealthy) | 80 (Unhealthy for Sensitive Groups) | 92 (Unhealthy) | 139 (Very Unhealthy) | 145 (Very Unhealthy) | 172 (Very bad Hazardous) | 198 (Very bad Hazardous) | 216 (Very bad Hazardous) | 98 (Unhealthy) | 87 (Unhealthy) | 107 (Unhealthy) | 159 (Very bad Hazardous) | 102 (Unhealthy) | 207 (Very bad Hazardous) | 244 (Very bad Hazardous) |
| no2 | 19 (Good) | 23 (Good) | 33 (Good) | 27 (Good) | 30 (Good) | 28 (Good) | 55 (Moderate) | 34 (Good) | 9.8 (Good) | 15 (Good) | 12 (Good) | 17 (Good) | 44 (Moderate) | 42 (Moderate) | 53 (Moderate) |
| so2 | 30 (Good) | 39 (Good) | 47 (Good) | 29 (Good) | 37 (Good) | 18 (Good) | 28 (Good) | 15 (Good) | 8.5 (Good) | 8.2 (Good) | 7.2 (Good) | 7.6 (Good) | 12 (Good) | 6.9 (Good) | 25 (Good) |
| co | 548 (Good) | 315 (Good) | 465 (Good) | 648 (Good) | 873 (Good) | 926 (Good) | 955 (Good) | 1 (Good) | 667 (Good) | 808 (Good) | 772 (Good) | 640 (Good) | 613 (Good) | 586 (Good) | 1 (Good) |
| o3 | 13 (Good) | 55 (Good) | 33 (Good) | 33 (Good) | 28 (Good) | 23 (Good) | 42 (Good) | 59 (Good) | 46 (Good) | 33 (Good) | 53 (Good) | 52 (Good) | 23 (Good) | 29 (Good) | 64 (Good) |
PM10 112 (매우 건강에 해로운)
미세먼지(PM10) 미세먼지SO2 12 (좋은)
이산화황 (SO2)PM2,5 54 (민감한 그룹에 대 한 건강에 해로운)
미세먼지(PM2.5) 먼지CO 1240 (좋은)
일산화탄소 (CO)NO2 3.5 (좋은)
이산화질소 (NO2)O3 1.7 (좋은)
오존 (O3)Gobind Pura, Yamuna Nagar - HSPCB
| index | 2022-10-31 |
|---|---|
| pm10 | 110 |
| so2 | 39 |
| pm25 | 53 |
| co | 980 |
| no2 | 3.3 |
| o3 | 1.7 |
Gobind Pura, Yamuna Nagar - HSPCB

| index | 2020-05 | 2020-04 | 2020-03 | 2020-02 | 2020-01 | 2019-12 | 2019-11 | 2019-10 | 2019-09 | 2019-08 | 2019-07 | 2019-06 | 2019-05 | 2019-04 | 2019-02 |
|---|---|---|---|---|---|---|---|---|---|---|---|---|---|---|---|
| pm25 | 44 | 35 | 48 | 77 | 94 | 109 | 119 | 120 | 49 | 44 | 59 | 72 | 52 | 80 | 125 |
| pm10 | 100 | 80 | 92 | 139 | 145 | 172 | 198 | 216 | 98 | 87 | 107 | 159 | 102 | 207 | 244 |
| no2 | 19 | 23 | 33 | 27 | 30 | 28 | 55 | 34 | 9.8 | 15 | 12 | 17 | 44 | 42 | 53 |
| so2 | 30 | 39 | 47 | 29 | 37 | 18 | 28 | 15 | 8.5 | 8.2 | 7.2 | 7.6 | 12 | 6.9 | 25 |
| co | 548 | 315 | 465 | 648 | 873 | 926 | 955 | 1 | 667 | 808 | 772 | 640 | 613 | 586 | 1 |
| o3 | 13 | 55 | 33 | 33 | 28 | 23 | 42 | 59 | 46 | 33 | 53 | 52 | 23 | 29 | 64 |