Kharkhari Raund 대기 오염: 실시간 대기 질 지수 및 스모그 경보.
Kharkhari Raund 대한 오염 및 대기 질 예측. 오늘은 2026년 5월 13일 수요일. 다음과 같은 대기 오염 값이 Kharkhari Raund 기록되었습니다.- 미세먼지(PM2.5) 먼지 - 204 (매우 나쁜 위험)
- 미세먼지(PM10) 미세먼지 - 282 (매우 나쁜 위험)
- 이산화질소 (NO2) - 24 (좋은)
- 이산화황 (SO2) - 1 (좋은)
- 일산화탄소 (CO) - 1400 (좋은)
- 오존 (O3) - 0 (좋은)

오늘날 Kharkhari Raund 공기 질은 무엇입니까? 공기는 Kharkhari Raund 오염되어 있습니까?. 스모그가 있습니까?
Kharkhari Raund PM2.5의 현재 수준은 무엇입니까? (미세먼지(PM2.5) 먼지)
오늘의 PM2.5 수준은 다음과 같은 것입니다.
204 (매우 나쁜 위험)
비교를 위해, 지난 7 일 Kharkhari Raund PM2.5의 가장 높은 수준은: 204 (2022년 10월 31일 월요일) 가장 낮은: 204 (2022년 10월 31일 월요일).
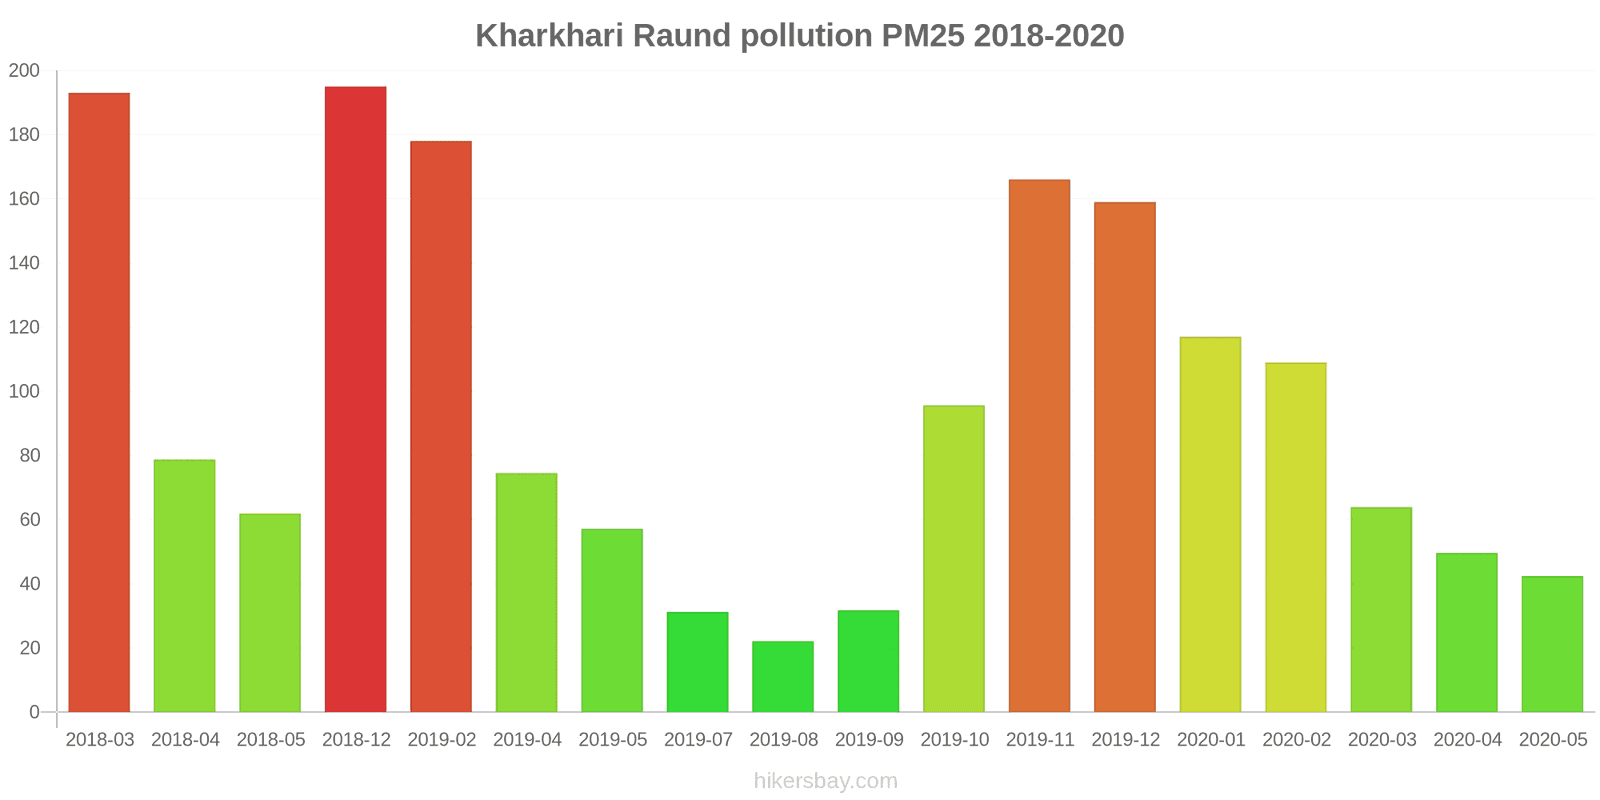
가장 높은 PM2.5 값이 기록되었습니다: 195 (2018년 12월).
미세먼지 의 최저 수준 PM2.5 오염은 월에서 발생합니다: 8월 (22).
Kharkhari Raund PM10의 수준은 무엇입니까? (미세먼지(PM10) 미세먼지)
Kharkhari Raund 의 현재 수준의 미립자 물질 PM10:
282 (매우 나쁜 위험)
가장 높은 PM10 값은 일반적으로 월에서 발생합니다: 260 (2019년 4월).
미립자 물질 PM10 오염의 가장 낮은 값 Kharkhari Raund 은 일반적으로 기록됩니다: 8월 (50).
NO2 수준은 얼마나 높습니까? (이산화질소 (NO2))
24 (좋은)
SO2 오염 수준은 어떻습니까? (이산화황 (SO2))
1 (좋은)
CO 수준은 얼마나 높습니까? (일산화탄소 (CO))
1400 (좋은)
오늘날 O3 수준은 Kharkhari Raund? (오존 (O3))
0 (좋은)
현재 데이터 2022년 10월 31일 월요일 오전 12:45
PM2,5 204 (매우 나쁜 위험)
PM10 282 (매우 나쁜 위험)
NO2 24 (좋은)
SO2 1 (좋은)
CO 1400 (좋은)
O3 0 (좋은)
최근 며칠 간의 대기 오염에 대한 데이터 Kharkhari Raund
index
2022-10-30
2022-10-31
o3
0
Good
-
Good
pm25
-
Good
204
Very bad Hazardous
pm10
-
Good
282
Very bad Hazardous
no2
-
Good
24
Good
so2
-
Good
1
Good
co
-
Good
1400
Good
data source »
Kharkhari Raund 에서 2018년 3월 2020년 5월
index
2020-05
2020-04
2020-03
2020-02
2020-01
2019-12
2019-11
2019-10
2019-09
2019-08
2019-07
2019-05
2019-04
2019-02
2018-12
2018-05
2018-04
2018-03
pm25
42 (Unhealthy for Sensitive Groups)
50 (Unhealthy for Sensitive Groups)
64 (Unhealthy)
109 (Very Unhealthy)
117 (Very bad Hazardous)
159 (Very bad Hazardous)
166 (Very bad Hazardous)
96 (Very Unhealthy)
32 (Moderate)
22 (Moderate)
31 (Moderate)
57 (Unhealthy)
75 (Unhealthy)
178 (Very bad Hazardous)
195 (Very bad Hazardous)
62 (Unhealthy)
79 (Very Unhealthy)
193 (Very bad Hazardous)
pm10
113 (Very Unhealthy)
142 (Very Unhealthy)
135 (Very Unhealthy)
171 (Very bad Hazardous)
157 (Very bad Hazardous)
222 (Very bad Hazardous)
235 (Very bad Hazardous)
176 (Very bad Hazardous)
70 (Unhealthy for Sensitive Groups)
50 (Moderate)
76 (Unhealthy for Sensitive Groups)
163 (Very bad Hazardous)
260 (Very bad Hazardous)
248 (Very bad Hazardous)
260 (Very bad Hazardous)
205 (Very bad Hazardous)
213 (Very bad Hazardous)
205 (Very bad Hazardous)
no2
10 (Good)
15 (Good)
23 (Good)
29 (Good)
29 (Good)
29 (Good)
14 (Good)
26 (Good)
25 (Good)
26 (Good)
26 (Good)
34 (Good)
43 (Moderate)
62 (Moderate)
54 (Moderate)
20 (Good)
27 (Good)
26 (Good)
so2
12 (Good)
13 (Good)
13 (Good)
11 (Good)
6.1 (Good)
6.8 (Good)
6.6 (Good)
9.1 (Good)
10 (Good)
9.5 (Good)
11 (Good)
20 (Good)
24 (Good)
13 (Good)
6.1 (Good)
4.2 (Good)
4.7 (Good)
9.9 (Good)
co
553 (Good)
495 (Good)
599 (Good)
804 (Good)
912 (Good)
996 (Good)
911 (Good)
1 (Good)
651 (Good)
1 (Good)
839 (Good)
367 (Good)
414 (Good)
801 (Good)
1 (Good)
1 (Good)
26 (Good)
29 (Good)
o3
26 (Good)
34 (Good)
46 (Good)
42 (Good)
21 (Good)
29 (Good)
12 (Good)
50 (Good)
33 (Good)
33 (Good)
41 (Good)
90 (Moderate)
66 (Good)
61 (Good)
32 (Good)
131 (Unhealthy for Sensitive Groups)
105 (Moderate)
55 (Good)
data source »
Najafgarh, Delhi - DPCC
2022년 10월 31일 월요일 오전 12:45
PM2,5 204 (매우 나쁜 위험)
미세먼지(PM2.5) 먼지
PM10 282 (매우 나쁜 위험)
미세먼지(PM10) 미세먼지
NO2 24 (좋은)
이산화질소 (NO2)
SO2 0.9 (좋은)
이산화황 (SO2)
CO 1400 (좋은)
일산화탄소 (CO)
O3 0.2 (좋은)
오존 (O3)
Najafgarh, Delhi - DPCC
index
2022-10-31
2022-10-30
o3
-
0.2
pm25
204
-
pm10
282
-
no2
24
-
so2
0.9
-
co
1400
-
Najafgarh, Delhi - DPCC
2018-03 2020-05

index
2020-05
2020-04
2020-03
2020-02
2020-01
2019-12
2019-11
2019-10
2019-09
2019-08
2019-07
2019-05
2019-04
2019-02
2018-12
2018-05
2018-04
2018-03
pm25
42
50
64
109
117
159
166
96
32
22
31
57
75
178
195
62
79
193
pm10
113
142
135
171
157
222
235
176
70
50
76
163
260
248
260
205
213
205
no2
10
15
23
29
29
29
14
26
25
26
26
34
43
62
54
20
27
26
so2
12
13
13
11
6.1
6.8
6.6
9.1
10
9.5
11
20
24
13
6.1
4.2
4.7
9.9
co
553
495
599
804
912
996
911
1
651
1
839
367
414
801
1
1
26
29
o3
26
34
46
42
21
29
12
50
33
33
41
90
66
61
32
131
105
55
* Pollution data source:
https://openaq.org
(caaqm)
The data is licensed under CC-By 4.0
PM2,5 204 (매우 나쁜 위험)
PM10 282 (매우 나쁜 위험)
NO2 24 (좋은)
SO2 1 (좋은)
CO 1400 (좋은)
O3 0 (좋은)
최근 며칠 간의 대기 오염에 대한 데이터 Kharkhari Raund
| index | 2022-10-30 | 2022-10-31 |
|---|---|---|
| o3 | 0 Good |
- Good |
| pm25 | - Good |
204 Very bad Hazardous |
| pm10 | - Good |
282 Very bad Hazardous |
| no2 | - Good |
24 Good |
| so2 | - Good |
1 Good |
| co | - Good |
1400 Good |

| index | 2020-05 | 2020-04 | 2020-03 | 2020-02 | 2020-01 | 2019-12 | 2019-11 | 2019-10 | 2019-09 | 2019-08 | 2019-07 | 2019-05 | 2019-04 | 2019-02 | 2018-12 | 2018-05 | 2018-04 | 2018-03 |
|---|---|---|---|---|---|---|---|---|---|---|---|---|---|---|---|---|---|---|
| pm25 | 42 (Unhealthy for Sensitive Groups) | 50 (Unhealthy for Sensitive Groups) | 64 (Unhealthy) | 109 (Very Unhealthy) | 117 (Very bad Hazardous) | 159 (Very bad Hazardous) | 166 (Very bad Hazardous) | 96 (Very Unhealthy) | 32 (Moderate) | 22 (Moderate) | 31 (Moderate) | 57 (Unhealthy) | 75 (Unhealthy) | 178 (Very bad Hazardous) | 195 (Very bad Hazardous) | 62 (Unhealthy) | 79 (Very Unhealthy) | 193 (Very bad Hazardous) |
| pm10 | 113 (Very Unhealthy) | 142 (Very Unhealthy) | 135 (Very Unhealthy) | 171 (Very bad Hazardous) | 157 (Very bad Hazardous) | 222 (Very bad Hazardous) | 235 (Very bad Hazardous) | 176 (Very bad Hazardous) | 70 (Unhealthy for Sensitive Groups) | 50 (Moderate) | 76 (Unhealthy for Sensitive Groups) | 163 (Very bad Hazardous) | 260 (Very bad Hazardous) | 248 (Very bad Hazardous) | 260 (Very bad Hazardous) | 205 (Very bad Hazardous) | 213 (Very bad Hazardous) | 205 (Very bad Hazardous) |
| no2 | 10 (Good) | 15 (Good) | 23 (Good) | 29 (Good) | 29 (Good) | 29 (Good) | 14 (Good) | 26 (Good) | 25 (Good) | 26 (Good) | 26 (Good) | 34 (Good) | 43 (Moderate) | 62 (Moderate) | 54 (Moderate) | 20 (Good) | 27 (Good) | 26 (Good) |
| so2 | 12 (Good) | 13 (Good) | 13 (Good) | 11 (Good) | 6.1 (Good) | 6.8 (Good) | 6.6 (Good) | 9.1 (Good) | 10 (Good) | 9.5 (Good) | 11 (Good) | 20 (Good) | 24 (Good) | 13 (Good) | 6.1 (Good) | 4.2 (Good) | 4.7 (Good) | 9.9 (Good) |
| co | 553 (Good) | 495 (Good) | 599 (Good) | 804 (Good) | 912 (Good) | 996 (Good) | 911 (Good) | 1 (Good) | 651 (Good) | 1 (Good) | 839 (Good) | 367 (Good) | 414 (Good) | 801 (Good) | 1 (Good) | 1 (Good) | 26 (Good) | 29 (Good) |
| o3 | 26 (Good) | 34 (Good) | 46 (Good) | 42 (Good) | 21 (Good) | 29 (Good) | 12 (Good) | 50 (Good) | 33 (Good) | 33 (Good) | 41 (Good) | 90 (Moderate) | 66 (Good) | 61 (Good) | 32 (Good) | 131 (Unhealthy for Sensitive Groups) | 105 (Moderate) | 55 (Good) |
PM2,5 204 (매우 나쁜 위험)
미세먼지(PM2.5) 먼지PM10 282 (매우 나쁜 위험)
미세먼지(PM10) 미세먼지NO2 24 (좋은)
이산화질소 (NO2)SO2 0.9 (좋은)
이산화황 (SO2)CO 1400 (좋은)
일산화탄소 (CO)O3 0.2 (좋은)
오존 (O3)Najafgarh, Delhi - DPCC
| index | 2022-10-31 | 2022-10-30 |
|---|---|---|
| o3 | - | 0.2 |
| pm25 | 204 | - |
| pm10 | 282 | - |
| no2 | 24 | - |
| so2 | 0.9 | - |
| co | 1400 | - |
Najafgarh, Delhi - DPCC

| index | 2020-05 | 2020-04 | 2020-03 | 2020-02 | 2020-01 | 2019-12 | 2019-11 | 2019-10 | 2019-09 | 2019-08 | 2019-07 | 2019-05 | 2019-04 | 2019-02 | 2018-12 | 2018-05 | 2018-04 | 2018-03 |
|---|---|---|---|---|---|---|---|---|---|---|---|---|---|---|---|---|---|---|
| pm25 | 42 | 50 | 64 | 109 | 117 | 159 | 166 | 96 | 32 | 22 | 31 | 57 | 75 | 178 | 195 | 62 | 79 | 193 |
| pm10 | 113 | 142 | 135 | 171 | 157 | 222 | 235 | 176 | 70 | 50 | 76 | 163 | 260 | 248 | 260 | 205 | 213 | 205 |
| no2 | 10 | 15 | 23 | 29 | 29 | 29 | 14 | 26 | 25 | 26 | 26 | 34 | 43 | 62 | 54 | 20 | 27 | 26 |
| so2 | 12 | 13 | 13 | 11 | 6.1 | 6.8 | 6.6 | 9.1 | 10 | 9.5 | 11 | 20 | 24 | 13 | 6.1 | 4.2 | 4.7 | 9.9 |
| co | 553 | 495 | 599 | 804 | 912 | 996 | 911 | 1 | 651 | 1 | 839 | 367 | 414 | 801 | 1 | 1 | 26 | 29 |
| o3 | 26 | 34 | 46 | 42 | 21 | 29 | 12 | 50 | 33 | 33 | 41 | 90 | 66 | 61 | 32 | 131 | 105 | 55 |