Dongjunshibu 대기 오염: 실시간 대기 질 지수 및 스모그 경보.
Dongjunshibu 대한 오염 및 대기 질 예측. 오늘은 2026년 6월 2일 화요일. 다음과 같은 대기 오염 값이 Dongjunshibu 기록되었습니다.- 미세먼지(PM10) 미세먼지 - 179 (매우 나쁜 위험)
- 미세먼지(PM2.5) 먼지 - 35 (민감한 그룹에 대 한 건강에 해로운)
- 오존 (O3) - 0 (좋은)
- 이산화질소 (NO2) - 0 (좋은)
- 이산화황 (SO2) - 0 (좋은)

오늘날 Dongjunshibu 공기 질은 무엇입니까? 공기는 Dongjunshibu 오염되어 있습니까?. 스모그가 있습니까?
Dongjunshibu PM10의 수준은 무엇입니까? (미세먼지(PM10) 미세먼지)
Dongjunshibu 의 현재 수준의 미립자 물질 PM10:
179 (매우 나쁜 위험)
가장 높은 PM10 값은 일반적으로 월에서 발생합니다: 239 (2019년 1월).
미립자 물질 PM10 오염의 가장 낮은 값 Dongjunshibu 은 일반적으로 기록됩니다: 8월 (70).
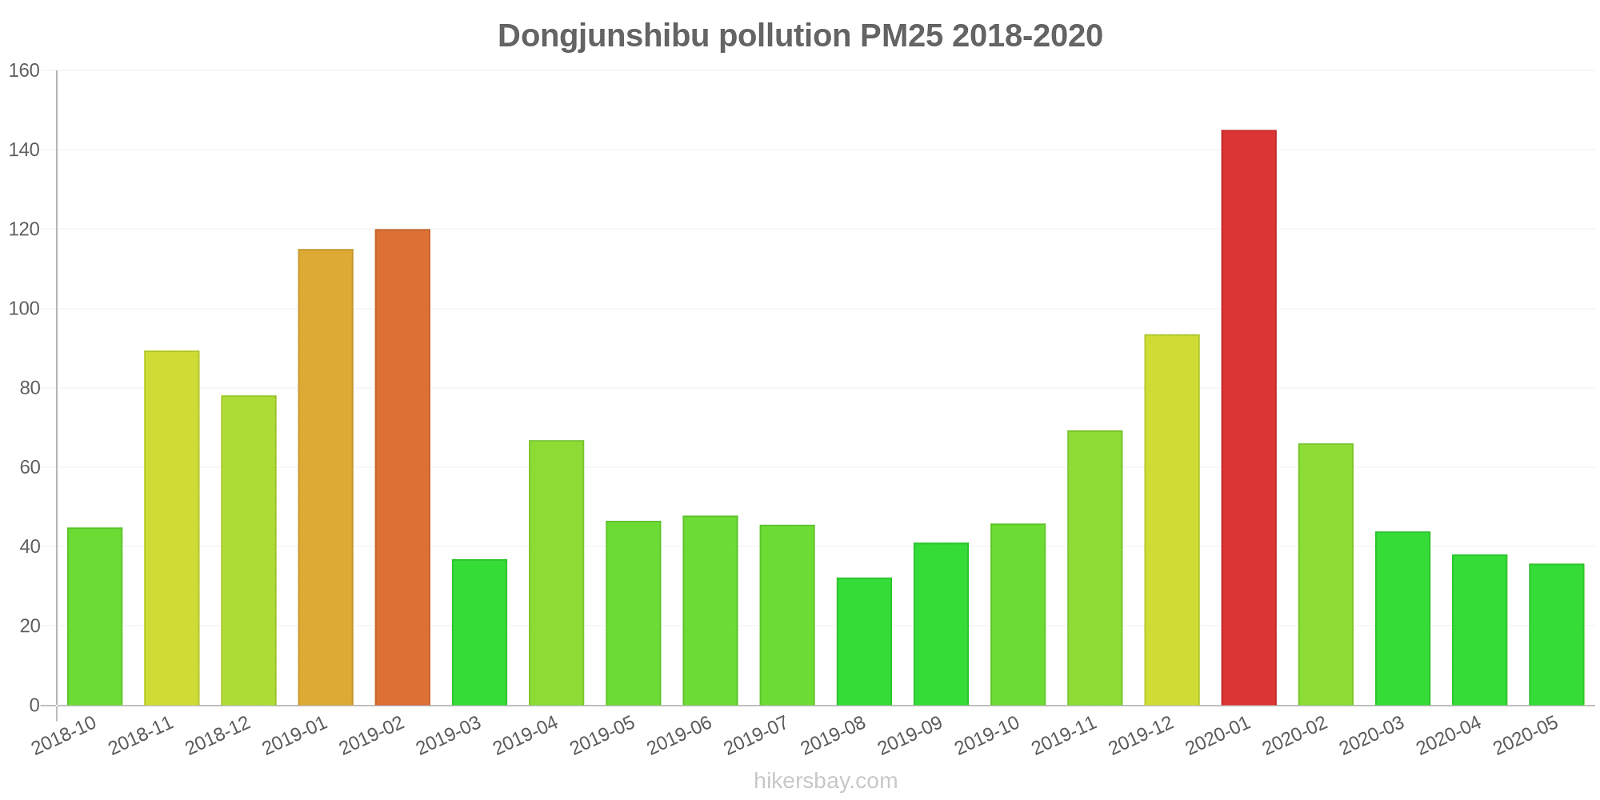
Dongjunshibu PM2.5의 현재 수준은 무엇입니까? (미세먼지(PM2.5) 먼지)
오늘의 PM2.5 수준은 다음과 같은 것입니다.
35 (민감한 그룹에 대 한 건강에 해로운)
비교를 위해, 지난 7 일 Dongjunshibu PM2.5의 가장 높은 수준은: 56 (2022년 5월 27일 금요일) 가장 낮은: 56 (2022년 5월 27일 금요일).
가장 높은 PM2.5 값이 기록되었습니다: 145 (2020년 1월).
미세먼지 의 최저 수준 PM2.5 오염은 월에서 발생합니다: 8월 (32).
오늘날 O3 수준은 Dongjunshibu? (오존 (O3))
0 (좋은)
NO2 수준은 얼마나 높습니까? (이산화질소 (NO2))
0 (좋은)
SO2 오염 수준은 어떻습니까? (이산화황 (SO2))
0 (좋은)
현재 데이터 2022년 5월 27일 금요일 오후 12:00
PM10 179 (매우 나쁜 위험)
PM2,5 35 (민감한 그룹에 대 한 건강에 해로운)
O3 0 (좋은)
NO2 0 (좋은)
SO2 0 (좋은)
최근 며칠 간의 대기 오염에 대한 데이터 Dongjunshibu
index
2022-05-27
pm10
56
Unhealthy for Sensitive Groups
pm25
56
Unhealthy
o3
0
Good
no2
0
Good
so2
0
Good
data source »
Dongjunshibu 에서 2018년 10월 2020년 5월
index
2020-05
2020-04
2020-03
2020-02
2020-01
2019-12
2019-11
2019-10
2019-09
2019-08
2019-07
2019-06
2019-05
2019-04
2019-03
2019-02
2019-01
2018-12
2018-11
2018-10
pm25
36 (Unhealthy for Sensitive Groups)
38 (Unhealthy for Sensitive Groups)
44 (Unhealthy for Sensitive Groups)
66 (Unhealthy)
145 (Very bad Hazardous)
94 (Very Unhealthy)
69 (Unhealthy)
46 (Unhealthy for Sensitive Groups)
41 (Unhealthy for Sensitive Groups)
32 (Moderate)
46 (Unhealthy for Sensitive Groups)
48 (Unhealthy for Sensitive Groups)
47 (Unhealthy for Sensitive Groups)
67 (Unhealthy)
37 (Unhealthy for Sensitive Groups)
120 (Very bad Hazardous)
115 (Very bad Hazardous)
78 (Very Unhealthy)
89 (Very Unhealthy)
45 (Unhealthy for Sensitive Groups)
co
734 (Good)
708 (Good)
687 (Good)
1 (Good)
1 (Good)
1 (Good)
1 (Good)
1 (Good)
1 (Good)
874 (Good)
732 (Good)
761 (Good)
629 (Good)
721 (Good)
845 (Good)
1 (Good)
2 (Good)
1 (Good)
1 (Good)
1 (Good)
no2
23 (Good)
37 (Good)
34 (Good)
24 (Good)
53 (Moderate)
55 (Moderate)
53 (Moderate)
41 (Moderate)
41 (Moderate)
29 (Good)
27 (Good)
28 (Good)
26 (Good)
32 (Good)
31 (Good)
39 (Good)
61 (Moderate)
59 (Moderate)
56 (Moderate)
63 (Moderate)
o3
150 (Unhealthy)
135 (Unhealthy for Sensitive Groups)
107 (Moderate)
84 (Moderate)
60 (Good)
39 (Good)
72 (Moderate)
107 (Moderate)
160 (Unhealthy)
145 (Unhealthy for Sensitive Groups)
204 (Very Unhealthy)
247 (Very bad Hazardous)
184 (Very Unhealthy)
143 (Unhealthy for Sensitive Groups)
124 (Unhealthy for Sensitive Groups)
85 (Moderate)
49 (Good)
42 (Good)
70 (Moderate)
92 (Moderate)
pm10
82 (Unhealthy)
92 (Unhealthy)
97 (Unhealthy)
95 (Unhealthy)
196 (Very bad Hazardous)
154 (Very bad Hazardous)
156 (Very bad Hazardous)
118 (Very Unhealthy)
91 (Unhealthy)
70 (Unhealthy for Sensitive Groups)
76 (Unhealthy for Sensitive Groups)
88 (Unhealthy)
102 (Unhealthy)
137 (Very Unhealthy)
126 (Very Unhealthy)
220 (Very bad Hazardous)
239 (Very bad Hazardous)
187 (Very bad Hazardous)
196 (Very bad Hazardous)
128 (Very Unhealthy)
so2
13 (Good)
16 (Good)
11 (Good)
7.4 (Good)
13 (Good)
10 (Good)
12 (Good)
10 (Good)
14 (Good)
9.6 (Good)
10 (Good)
12 (Good)
12 (Good)
12 (Good)
14 (Good)
25 (Good)
41 (Good)
34 (Good)
19 (Good)
21 (Good)
data source »
东污水处理厂
2022년 5월 27일 금요일 오후 12:00
PM10 179 (매우 나쁜 위험)
미세먼지(PM10) 미세먼지
PM2,5 35 (민감한 그룹에 대 한 건강에 해로운)
미세먼지(PM2.5) 먼지
O3 0.04 (좋은)
오존 (O3)
NO2 0 (좋은)
이산화질소 (NO2)
SO2 0 (좋은)
이산화황 (SO2)
东污水处理厂
index
2022-05-27
pm10
56
pm25
56
o3
0.03
no2
0
so2
0
东污水处理厂
2018-10 2020-05
index
2020-05
2020-04
2020-03
2020-02
2020-01
2019-12
2019-11
2019-10
2019-09
2019-08
2019-07
2019-06
2019-05
2019-04
2019-03
2019-02
2019-01
2018-12
2018-11
2018-10
pm25
36
38
44
66
145
94
69
46
41
32
46
48
47
67
37
120
115
78
89
45
co
734
708
687
1
1
1
1
1
1
874
732
761
629
721
845
1
2
1
1
1
no2
23
37
34
24
53
55
53
41
41
29
27
28
26
32
31
39
61
59
56
63
o3
150
135
107
84
60
39
72
107
160
145
204
247
184
143
124
85
49
42
70
92
pm10
82
92
97
95
196
154
156
118
91
70
76
88
102
137
126
220
239
187
196
128
so2
13
16
11
7.4
13
10
12
10
14
9.6
10
12
12
12
14
25
41
34
19
21
* Pollution data source:
https://openaq.org
(ChinaAQIData)
The data is licensed under CC-By 4.0
PM10 179 (매우 나쁜 위험)
PM2,5 35 (민감한 그룹에 대 한 건강에 해로운)
O3 0 (좋은)
NO2 0 (좋은)
SO2 0 (좋은)
최근 며칠 간의 대기 오염에 대한 데이터 Dongjunshibu
| index | 2022-05-27 |
|---|---|
| pm10 | 56 Unhealthy for Sensitive Groups |
| pm25 | 56 Unhealthy |
| o3 | 0 Good |
| no2 | 0 Good |
| so2 | 0 Good |

| index | 2020-05 | 2020-04 | 2020-03 | 2020-02 | 2020-01 | 2019-12 | 2019-11 | 2019-10 | 2019-09 | 2019-08 | 2019-07 | 2019-06 | 2019-05 | 2019-04 | 2019-03 | 2019-02 | 2019-01 | 2018-12 | 2018-11 | 2018-10 |
|---|---|---|---|---|---|---|---|---|---|---|---|---|---|---|---|---|---|---|---|---|
| pm25 | 36 (Unhealthy for Sensitive Groups) | 38 (Unhealthy for Sensitive Groups) | 44 (Unhealthy for Sensitive Groups) | 66 (Unhealthy) | 145 (Very bad Hazardous) | 94 (Very Unhealthy) | 69 (Unhealthy) | 46 (Unhealthy for Sensitive Groups) | 41 (Unhealthy for Sensitive Groups) | 32 (Moderate) | 46 (Unhealthy for Sensitive Groups) | 48 (Unhealthy for Sensitive Groups) | 47 (Unhealthy for Sensitive Groups) | 67 (Unhealthy) | 37 (Unhealthy for Sensitive Groups) | 120 (Very bad Hazardous) | 115 (Very bad Hazardous) | 78 (Very Unhealthy) | 89 (Very Unhealthy) | 45 (Unhealthy for Sensitive Groups) |
| co | 734 (Good) | 708 (Good) | 687 (Good) | 1 (Good) | 1 (Good) | 1 (Good) | 1 (Good) | 1 (Good) | 1 (Good) | 874 (Good) | 732 (Good) | 761 (Good) | 629 (Good) | 721 (Good) | 845 (Good) | 1 (Good) | 2 (Good) | 1 (Good) | 1 (Good) | 1 (Good) |
| no2 | 23 (Good) | 37 (Good) | 34 (Good) | 24 (Good) | 53 (Moderate) | 55 (Moderate) | 53 (Moderate) | 41 (Moderate) | 41 (Moderate) | 29 (Good) | 27 (Good) | 28 (Good) | 26 (Good) | 32 (Good) | 31 (Good) | 39 (Good) | 61 (Moderate) | 59 (Moderate) | 56 (Moderate) | 63 (Moderate) |
| o3 | 150 (Unhealthy) | 135 (Unhealthy for Sensitive Groups) | 107 (Moderate) | 84 (Moderate) | 60 (Good) | 39 (Good) | 72 (Moderate) | 107 (Moderate) | 160 (Unhealthy) | 145 (Unhealthy for Sensitive Groups) | 204 (Very Unhealthy) | 247 (Very bad Hazardous) | 184 (Very Unhealthy) | 143 (Unhealthy for Sensitive Groups) | 124 (Unhealthy for Sensitive Groups) | 85 (Moderate) | 49 (Good) | 42 (Good) | 70 (Moderate) | 92 (Moderate) |
| pm10 | 82 (Unhealthy) | 92 (Unhealthy) | 97 (Unhealthy) | 95 (Unhealthy) | 196 (Very bad Hazardous) | 154 (Very bad Hazardous) | 156 (Very bad Hazardous) | 118 (Very Unhealthy) | 91 (Unhealthy) | 70 (Unhealthy for Sensitive Groups) | 76 (Unhealthy for Sensitive Groups) | 88 (Unhealthy) | 102 (Unhealthy) | 137 (Very Unhealthy) | 126 (Very Unhealthy) | 220 (Very bad Hazardous) | 239 (Very bad Hazardous) | 187 (Very bad Hazardous) | 196 (Very bad Hazardous) | 128 (Very Unhealthy) |
| so2 | 13 (Good) | 16 (Good) | 11 (Good) | 7.4 (Good) | 13 (Good) | 10 (Good) | 12 (Good) | 10 (Good) | 14 (Good) | 9.6 (Good) | 10 (Good) | 12 (Good) | 12 (Good) | 12 (Good) | 14 (Good) | 25 (Good) | 41 (Good) | 34 (Good) | 19 (Good) | 21 (Good) |
PM10 179 (매우 나쁜 위험)
미세먼지(PM10) 미세먼지PM2,5 35 (민감한 그룹에 대 한 건강에 해로운)
미세먼지(PM2.5) 먼지O3 0.04 (좋은)
오존 (O3)NO2 0 (좋은)
이산화질소 (NO2)SO2 0 (좋은)
이산화황 (SO2)东污水处理厂
| index | 2022-05-27 |
|---|---|
| pm10 | 56 |
| pm25 | 56 |
| o3 | 0.03 |
| no2 | 0 |
| so2 | 0 |
东污水处理厂
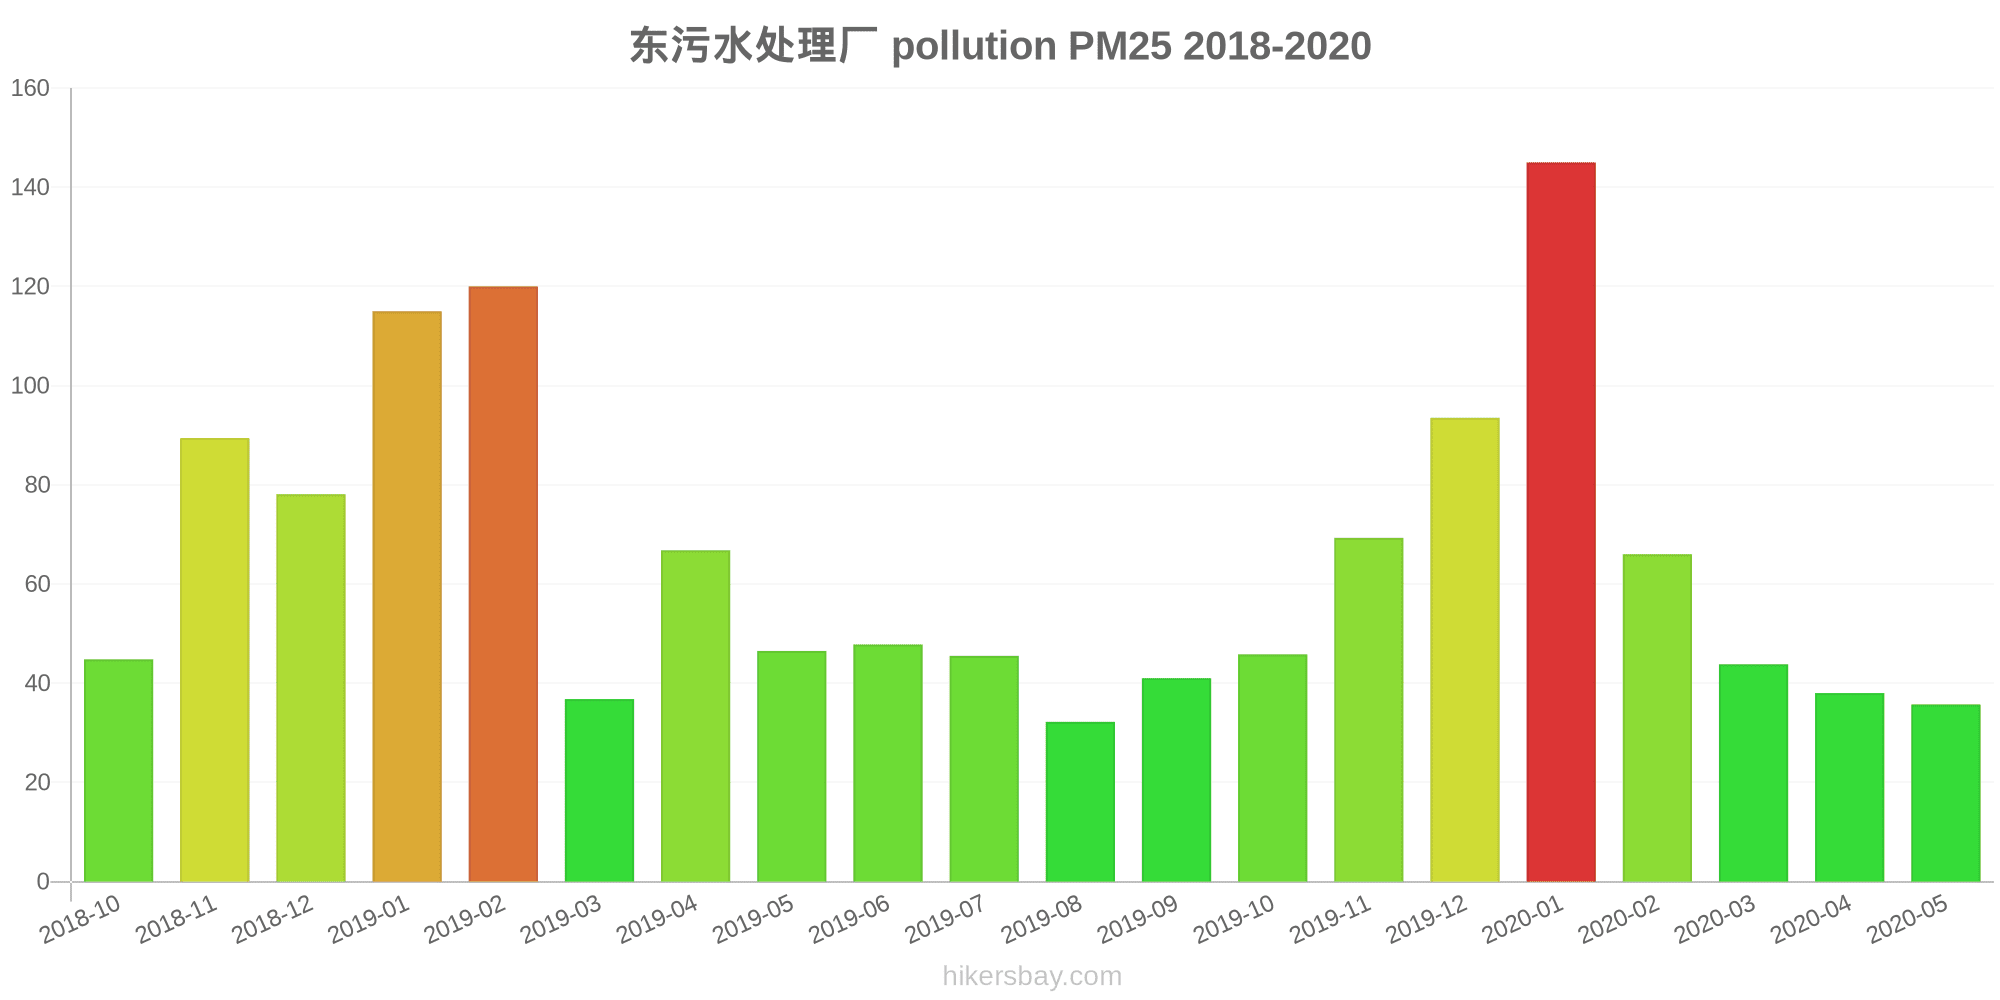
| index | 2020-05 | 2020-04 | 2020-03 | 2020-02 | 2020-01 | 2019-12 | 2019-11 | 2019-10 | 2019-09 | 2019-08 | 2019-07 | 2019-06 | 2019-05 | 2019-04 | 2019-03 | 2019-02 | 2019-01 | 2018-12 | 2018-11 | 2018-10 |
|---|---|---|---|---|---|---|---|---|---|---|---|---|---|---|---|---|---|---|---|---|
| pm25 | 36 | 38 | 44 | 66 | 145 | 94 | 69 | 46 | 41 | 32 | 46 | 48 | 47 | 67 | 37 | 120 | 115 | 78 | 89 | 45 |
| co | 734 | 708 | 687 | 1 | 1 | 1 | 1 | 1 | 1 | 874 | 732 | 761 | 629 | 721 | 845 | 1 | 2 | 1 | 1 | 1 |
| no2 | 23 | 37 | 34 | 24 | 53 | 55 | 53 | 41 | 41 | 29 | 27 | 28 | 26 | 32 | 31 | 39 | 61 | 59 | 56 | 63 |
| o3 | 150 | 135 | 107 | 84 | 60 | 39 | 72 | 107 | 160 | 145 | 204 | 247 | 184 | 143 | 124 | 85 | 49 | 42 | 70 | 92 |
| pm10 | 82 | 92 | 97 | 95 | 196 | 154 | 156 | 118 | 91 | 70 | 76 | 88 | 102 | 137 | 126 | 220 | 239 | 187 | 196 | 128 |
| so2 | 13 | 16 | 11 | 7.4 | 13 | 10 | 12 | 10 | 14 | 9.6 | 10 | 12 | 12 | 12 | 14 | 25 | 41 | 34 | 19 | 21 |