Tuanchengshan 대기 오염: 실시간 대기 질 지수 및 스모그 경보.
Tuanchengshan 대한 오염 및 대기 질 예측. 오늘은 2026년 6월 3일 수요일. 다음과 같은 대기 오염 값이 Tuanchengshan 기록되었습니다.- 미세먼지(PM10) 미세먼지 - 179 (매우 나쁜 위험)
- 미세먼지(PM2.5) 먼지 - 35 (민감한 그룹에 대 한 건강에 해로운)
- 오존 (O3) - 0 (좋은)
- 이산화질소 (NO2) - 0 (좋은)
- 이산화황 (SO2) - 0 (좋은)

오늘날 Tuanchengshan 공기 질은 무엇입니까? 공기는 Tuanchengshan 오염되어 있습니까?. 스모그가 있습니까?
Tuanchengshan PM10의 수준은 무엇입니까? (미세먼지(PM10) 미세먼지)
Tuanchengshan 의 현재 수준의 미립자 물질 PM10:
179 (매우 나쁜 위험)
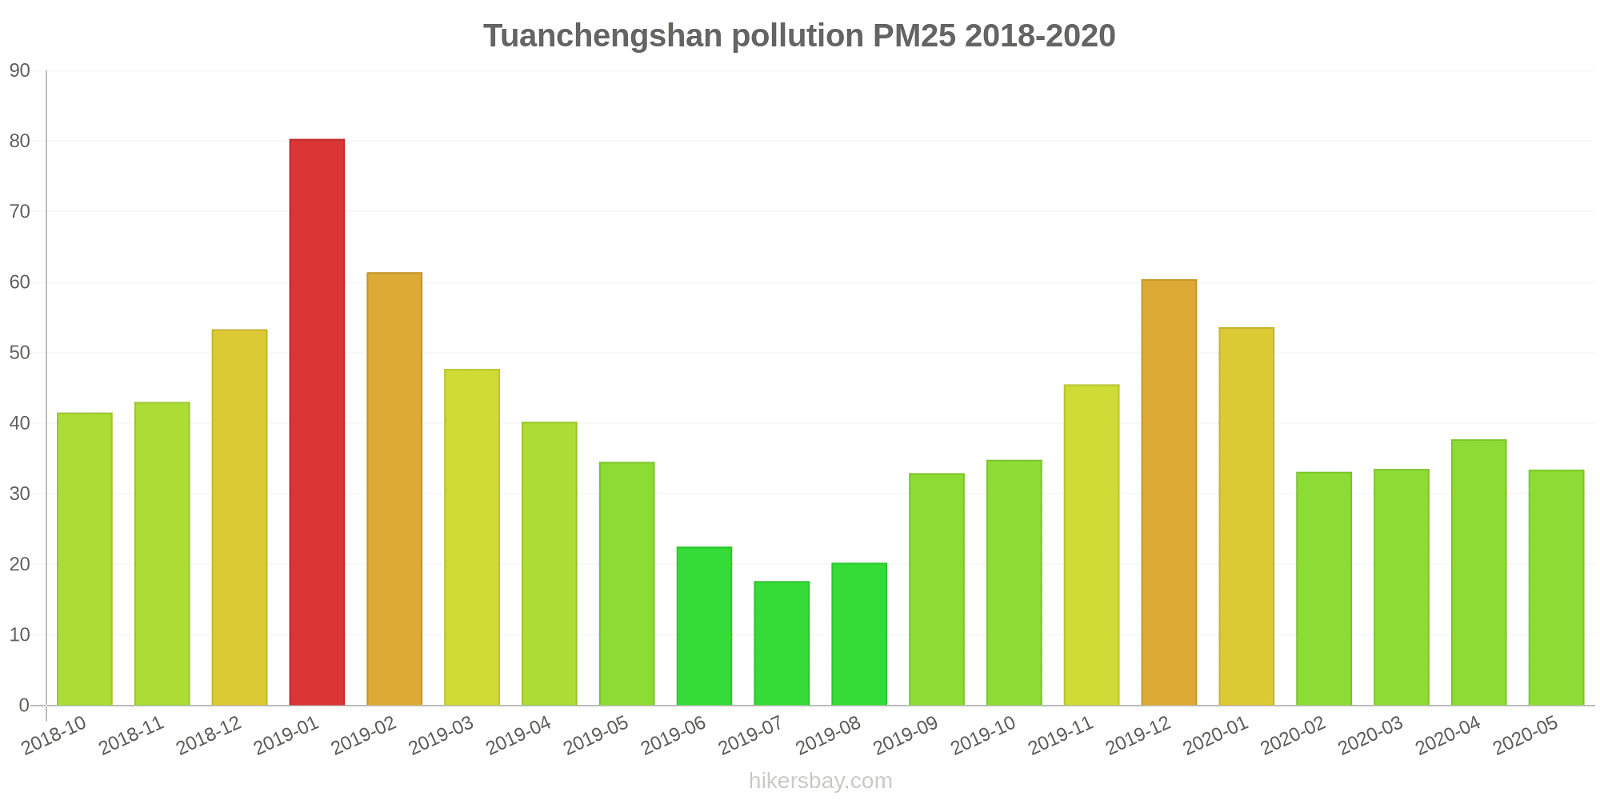
가장 높은 PM10 값은 일반적으로 월에서 발생합니다: 122 (2019년 1월).
미립자 물질 PM10 오염의 가장 낮은 값 Tuanchengshan 은 일반적으로 기록됩니다: 7월 (42).
Tuanchengshan PM2.5의 현재 수준은 무엇입니까? (미세먼지(PM2.5) 먼지)
오늘의 PM2.5 수준은 다음과 같은 것입니다.
35 (민감한 그룹에 대 한 건강에 해로운)
비교를 위해, 지난 7 일 Tuanchengshan PM2.5의 가장 높은 수준은: 56 (2022년 5월 27일 금요일) 가장 낮은: 56 (2022년 5월 27일 금요일).
가장 높은 PM2.5 값이 기록되었습니다: 80 (2019년 1월).
미세먼지 의 최저 수준 PM2.5 오염은 월에서 발생합니다: 7월 (18).
오늘날 O3 수준은 Tuanchengshan? (오존 (O3))
0 (좋은)
NO2 수준은 얼마나 높습니까? (이산화질소 (NO2))
0 (좋은)
SO2 오염 수준은 어떻습니까? (이산화황 (SO2))
0 (좋은)
현재 데이터 2022년 5월 27일 금요일 오후 12:00
PM10 179 (매우 나쁜 위험)
PM2,5 35 (민감한 그룹에 대 한 건강에 해로운)
O3 0 (좋은)
NO2 0 (좋은)
SO2 0 (좋은)
최근 며칠 간의 대기 오염에 대한 데이터 Tuanchengshan
index
2022-05-27
pm10
56
Unhealthy for Sensitive Groups
pm25
56
Unhealthy
o3
0
Good
no2
0
Good
so2
0
Good
data source »
Tuanchengshan 에서 2018년 10월 2020년 5월
index
2020-05
2020-04
2020-03
2020-02
2020-01
2019-12
2019-11
2019-10
2019-09
2019-08
2019-07
2019-06
2019-05
2019-04
2019-03
2019-02
2019-01
2018-12
2018-11
2018-10
pm25
33 (Moderate)
38 (Unhealthy for Sensitive Groups)
34 (Moderate)
33 (Moderate)
54 (Unhealthy for Sensitive Groups)
60 (Unhealthy)
46 (Unhealthy for Sensitive Groups)
35 (Moderate)
33 (Moderate)
20 (Moderate)
18 (Moderate)
23 (Moderate)
35 (Moderate)
40 (Unhealthy for Sensitive Groups)
48 (Unhealthy for Sensitive Groups)
61 (Unhealthy)
80 (Very Unhealthy)
53 (Unhealthy for Sensitive Groups)
43 (Unhealthy for Sensitive Groups)
42 (Unhealthy for Sensitive Groups)
co
1 (Good)
981 (Good)
1 (Good)
1 (Good)
1 (Good)
1 (Good)
1 (Good)
968 (Good)
929 (Good)
994 (Good)
1 (Good)
1 (Good)
1 (Good)
1 (Good)
1 (Good)
1 (Good)
1 (Good)
1 (Good)
979 (Good)
1 (Good)
no2
24 (Good)
33 (Good)
22 (Good)
19 (Good)
36 (Good)
51 (Moderate)
39 (Good)
33 (Good)
25 (Good)
20 (Good)
22 (Good)
26 (Good)
32 (Good)
33 (Good)
37 (Good)
27 (Good)
40 (Moderate)
39 (Good)
41 (Moderate)
47 (Moderate)
o3
143 (Unhealthy for Sensitive Groups)
137 (Unhealthy for Sensitive Groups)
101 (Moderate)
91 (Moderate)
51 (Good)
64 (Good)
96 (Moderate)
120 (Unhealthy for Sensitive Groups)
185 (Very Unhealthy)
178 (Unhealthy)
143 (Unhealthy for Sensitive Groups)
170 (Unhealthy)
151 (Unhealthy)
121 (Unhealthy for Sensitive Groups)
112 (Moderate)
56 (Good)
57 (Good)
44 (Good)
81 (Moderate)
112 (Moderate)
pm10
67 (Unhealthy for Sensitive Groups)
71 (Unhealthy for Sensitive Groups)
64 (Unhealthy for Sensitive Groups)
56 (Unhealthy for Sensitive Groups)
76 (Unhealthy for Sensitive Groups)
98 (Unhealthy)
97 (Unhealthy)
68 (Unhealthy for Sensitive Groups)
61 (Unhealthy for Sensitive Groups)
44 (Moderate)
42 (Moderate)
51 (Unhealthy for Sensitive Groups)
88 (Unhealthy)
71 (Unhealthy for Sensitive Groups)
77 (Unhealthy for Sensitive Groups)
81 (Unhealthy)
122 (Very Unhealthy)
78 (Unhealthy for Sensitive Groups)
67 (Unhealthy for Sensitive Groups)
72 (Unhealthy for Sensitive Groups)
so2
24 (Good)
22 (Good)
14 (Good)
18 (Good)
10 (Good)
19 (Good)
18 (Good)
14 (Good)
13 (Good)
13 (Good)
14 (Good)
12 (Good)
12 (Good)
16 (Good)
9.6 (Good)
7.5 (Good)
13 (Good)
10 (Good)
10 (Good)
15 (Good)
data source »
团城山
2022년 5월 27일 금요일 오후 12:00
PM10 179 (매우 나쁜 위험)
미세먼지(PM10) 미세먼지
PM2,5 35 (민감한 그룹에 대 한 건강에 해로운)
미세먼지(PM2.5) 먼지
O3 0.04 (좋은)
오존 (O3)
NO2 0 (좋은)
이산화질소 (NO2)
SO2 0 (좋은)
이산화황 (SO2)
团城山
index
2022-05-27
pm10
56
pm25
56
o3
0.03
no2
0
so2
0
团城山
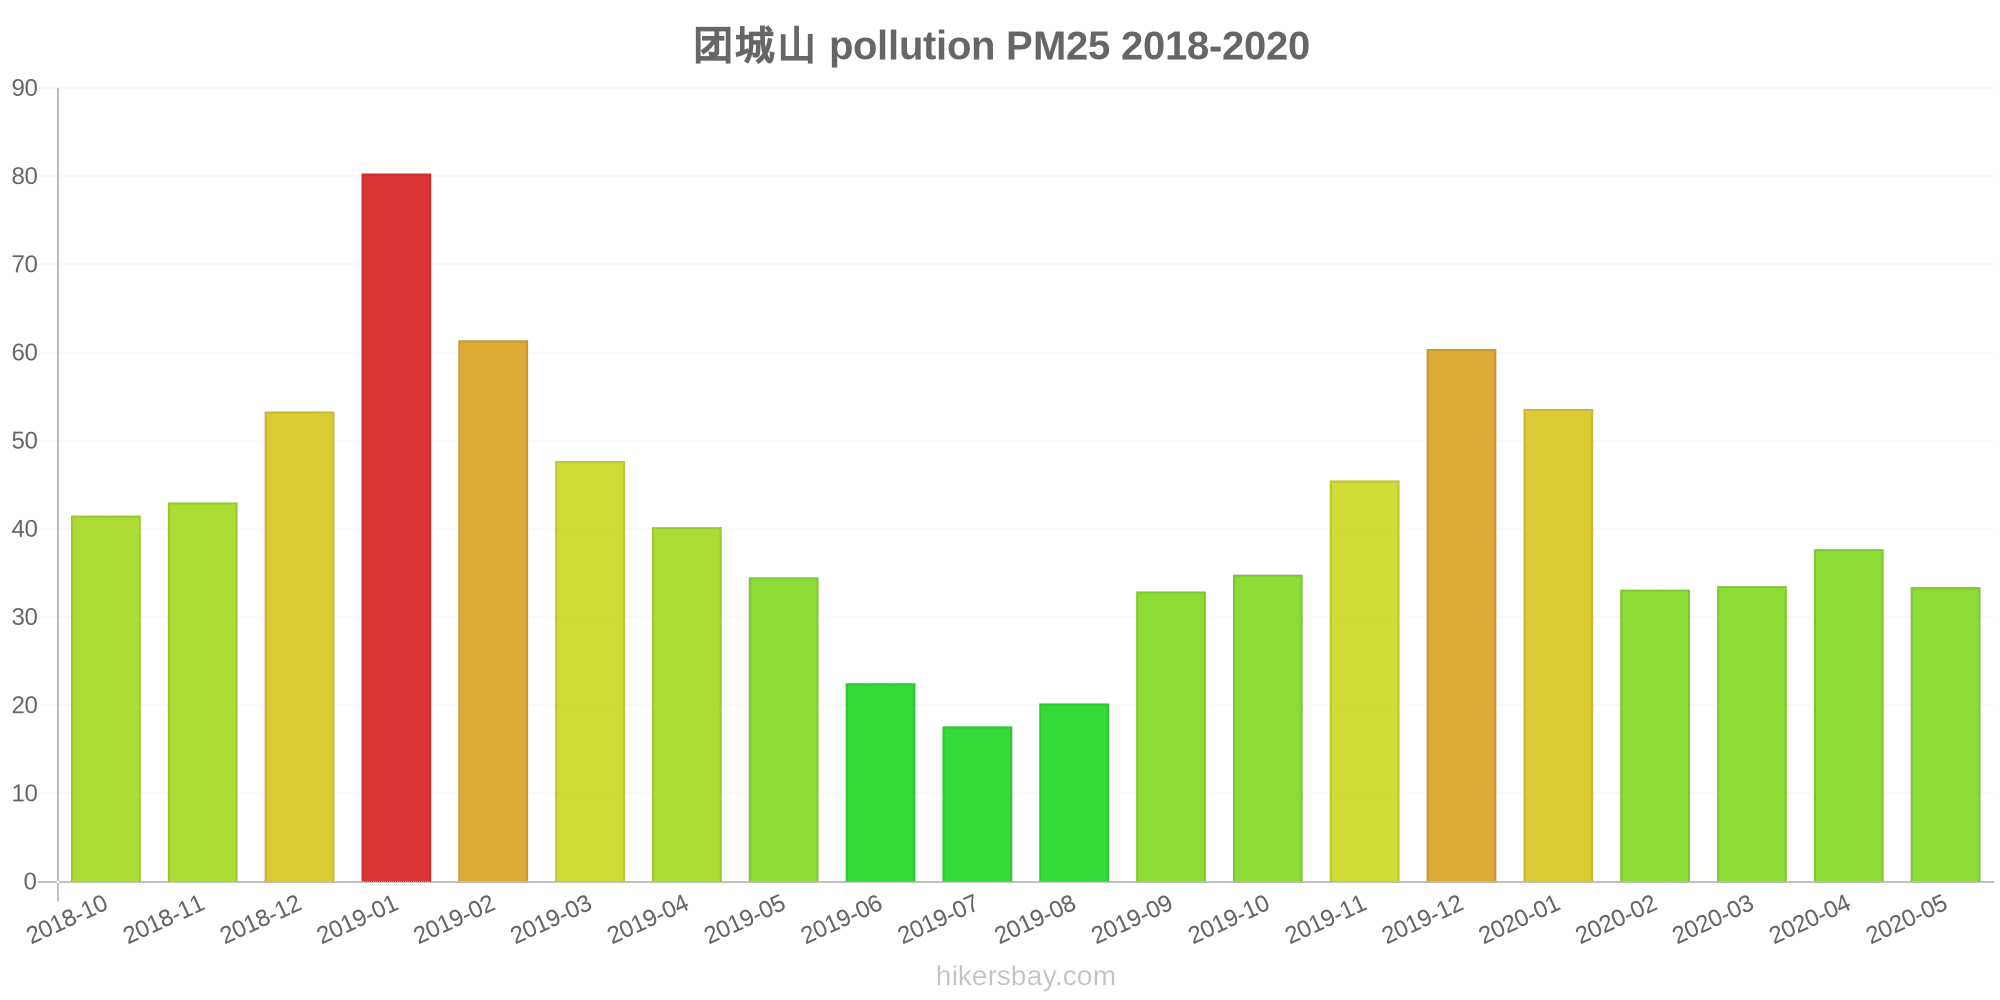
2018-10 2020-05

index
2020-05
2020-04
2020-03
2020-02
2020-01
2019-12
2019-11
2019-10
2019-09
2019-08
2019-07
2019-06
2019-05
2019-04
2019-03
2019-02
2019-01
2018-12
2018-11
2018-10
pm25
33
38
34
33
54
60
46
35
33
20
18
23
35
40
48
61
80
53
43
42
co
1
981
1
1
1
1
1
968
929
994
1
1
1
1
1
1
1
1
979
1
no2
24
33
22
19
36
51
39
33
25
20
22
26
32
33
37
27
40
39
41
47
o3
143
137
101
91
51
64
96
120
185
178
143
170
151
121
112
56
57
44
81
112
pm10
67
71
64
56
76
98
97
68
61
44
42
51
88
71
77
81
122
78
67
72
so2
24
22
14
18
10
19
18
14
13
13
14
12
12
16
9.6
7.5
13
10
10
15
* Pollution data source:
https://openaq.org
(ChinaAQIData)
The data is licensed under CC-By 4.0
PM10 179 (매우 나쁜 위험)
PM2,5 35 (민감한 그룹에 대 한 건강에 해로운)
O3 0 (좋은)
NO2 0 (좋은)
SO2 0 (좋은)
최근 며칠 간의 대기 오염에 대한 데이터 Tuanchengshan
| index | 2022-05-27 |
|---|---|
| pm10 | 56 Unhealthy for Sensitive Groups |
| pm25 | 56 Unhealthy |
| o3 | 0 Good |
| no2 | 0 Good |
| so2 | 0 Good |

| index | 2020-05 | 2020-04 | 2020-03 | 2020-02 | 2020-01 | 2019-12 | 2019-11 | 2019-10 | 2019-09 | 2019-08 | 2019-07 | 2019-06 | 2019-05 | 2019-04 | 2019-03 | 2019-02 | 2019-01 | 2018-12 | 2018-11 | 2018-10 |
|---|---|---|---|---|---|---|---|---|---|---|---|---|---|---|---|---|---|---|---|---|
| pm25 | 33 (Moderate) | 38 (Unhealthy for Sensitive Groups) | 34 (Moderate) | 33 (Moderate) | 54 (Unhealthy for Sensitive Groups) | 60 (Unhealthy) | 46 (Unhealthy for Sensitive Groups) | 35 (Moderate) | 33 (Moderate) | 20 (Moderate) | 18 (Moderate) | 23 (Moderate) | 35 (Moderate) | 40 (Unhealthy for Sensitive Groups) | 48 (Unhealthy for Sensitive Groups) | 61 (Unhealthy) | 80 (Very Unhealthy) | 53 (Unhealthy for Sensitive Groups) | 43 (Unhealthy for Sensitive Groups) | 42 (Unhealthy for Sensitive Groups) |
| co | 1 (Good) | 981 (Good) | 1 (Good) | 1 (Good) | 1 (Good) | 1 (Good) | 1 (Good) | 968 (Good) | 929 (Good) | 994 (Good) | 1 (Good) | 1 (Good) | 1 (Good) | 1 (Good) | 1 (Good) | 1 (Good) | 1 (Good) | 1 (Good) | 979 (Good) | 1 (Good) |
| no2 | 24 (Good) | 33 (Good) | 22 (Good) | 19 (Good) | 36 (Good) | 51 (Moderate) | 39 (Good) | 33 (Good) | 25 (Good) | 20 (Good) | 22 (Good) | 26 (Good) | 32 (Good) | 33 (Good) | 37 (Good) | 27 (Good) | 40 (Moderate) | 39 (Good) | 41 (Moderate) | 47 (Moderate) |
| o3 | 143 (Unhealthy for Sensitive Groups) | 137 (Unhealthy for Sensitive Groups) | 101 (Moderate) | 91 (Moderate) | 51 (Good) | 64 (Good) | 96 (Moderate) | 120 (Unhealthy for Sensitive Groups) | 185 (Very Unhealthy) | 178 (Unhealthy) | 143 (Unhealthy for Sensitive Groups) | 170 (Unhealthy) | 151 (Unhealthy) | 121 (Unhealthy for Sensitive Groups) | 112 (Moderate) | 56 (Good) | 57 (Good) | 44 (Good) | 81 (Moderate) | 112 (Moderate) |
| pm10 | 67 (Unhealthy for Sensitive Groups) | 71 (Unhealthy for Sensitive Groups) | 64 (Unhealthy for Sensitive Groups) | 56 (Unhealthy for Sensitive Groups) | 76 (Unhealthy for Sensitive Groups) | 98 (Unhealthy) | 97 (Unhealthy) | 68 (Unhealthy for Sensitive Groups) | 61 (Unhealthy for Sensitive Groups) | 44 (Moderate) | 42 (Moderate) | 51 (Unhealthy for Sensitive Groups) | 88 (Unhealthy) | 71 (Unhealthy for Sensitive Groups) | 77 (Unhealthy for Sensitive Groups) | 81 (Unhealthy) | 122 (Very Unhealthy) | 78 (Unhealthy for Sensitive Groups) | 67 (Unhealthy for Sensitive Groups) | 72 (Unhealthy for Sensitive Groups) |
| so2 | 24 (Good) | 22 (Good) | 14 (Good) | 18 (Good) | 10 (Good) | 19 (Good) | 18 (Good) | 14 (Good) | 13 (Good) | 13 (Good) | 14 (Good) | 12 (Good) | 12 (Good) | 16 (Good) | 9.6 (Good) | 7.5 (Good) | 13 (Good) | 10 (Good) | 10 (Good) | 15 (Good) |
PM10 179 (매우 나쁜 위험)
미세먼지(PM10) 미세먼지PM2,5 35 (민감한 그룹에 대 한 건강에 해로운)
미세먼지(PM2.5) 먼지O3 0.04 (좋은)
오존 (O3)NO2 0 (좋은)
이산화질소 (NO2)SO2 0 (좋은)
이산화황 (SO2)团城山
| index | 2022-05-27 |
|---|---|
| pm10 | 56 |
| pm25 | 56 |
| o3 | 0.03 |
| no2 | 0 |
| so2 | 0 |
团城山
| index | 2020-05 | 2020-04 | 2020-03 | 2020-02 | 2020-01 | 2019-12 | 2019-11 | 2019-10 | 2019-09 | 2019-08 | 2019-07 | 2019-06 | 2019-05 | 2019-04 | 2019-03 | 2019-02 | 2019-01 | 2018-12 | 2018-11 | 2018-10 |
|---|---|---|---|---|---|---|---|---|---|---|---|---|---|---|---|---|---|---|---|---|
| pm25 | 33 | 38 | 34 | 33 | 54 | 60 | 46 | 35 | 33 | 20 | 18 | 23 | 35 | 40 | 48 | 61 | 80 | 53 | 43 | 42 |
| co | 1 | 981 | 1 | 1 | 1 | 1 | 1 | 968 | 929 | 994 | 1 | 1 | 1 | 1 | 1 | 1 | 1 | 1 | 979 | 1 |
| no2 | 24 | 33 | 22 | 19 | 36 | 51 | 39 | 33 | 25 | 20 | 22 | 26 | 32 | 33 | 37 | 27 | 40 | 39 | 41 | 47 |
| o3 | 143 | 137 | 101 | 91 | 51 | 64 | 96 | 120 | 185 | 178 | 143 | 170 | 151 | 121 | 112 | 56 | 57 | 44 | 81 | 112 |
| pm10 | 67 | 71 | 64 | 56 | 76 | 98 | 97 | 68 | 61 | 44 | 42 | 51 | 88 | 71 | 77 | 81 | 122 | 78 | 67 | 72 |
| so2 | 24 | 22 | 14 | 18 | 10 | 19 | 18 | 14 | 13 | 13 | 14 | 12 | 12 | 16 | 9.6 | 7.5 | 13 | 10 | 10 | 15 |