Fulilu 대기 오염: 실시간 대기 질 지수 및 스모그 경보.
Fulilu 대한 오염 및 대기 질 예측. 오늘은 2026년 6월 3일 수요일. 다음과 같은 대기 오염 값이 Fulilu 기록되었습니다.- 미세먼지(PM10) 미세먼지 - 7 (좋은)
- 미세먼지(PM2.5) 먼지 - 2 (좋은)
- 일산화탄소 (CO) - 100 (좋은)
- 이산화질소 (NO2) - 8 (좋은)
- 오존 (O3) - 0 (좋은)
- 이산화황 (SO2) - 9 (좋은)

오늘날 Fulilu 공기 질은 무엇입니까? 공기는 Fulilu 오염되어 있습니까?. 스모그가 있습니까?
Fulilu PM10의 수준은 무엇입니까? (미세먼지(PM10) 미세먼지)
Fulilu 의 현재 수준의 미립자 물질 PM10:
7 (좋은)
가장 높은 PM10 값은 일반적으로 월에서 발생합니다: 187 (2018년 11월).
미립자 물질 PM10 오염의 가장 낮은 값 Fulilu 은 일반적으로 기록됩니다: 8월 (47).
Fulilu PM2.5의 현재 수준은 무엇입니까? (미세먼지(PM2.5) 먼지)
오늘의 PM2.5 수준은 다음과 같은 것입니다.
2 (좋은)
비교를 위해, 지난 7 일 Fulilu PM2.5의 가장 높은 수준은: 24 (2022년 5월 27일 금요일) 가장 낮은: 24 (2022년 5월 27일 금요일).
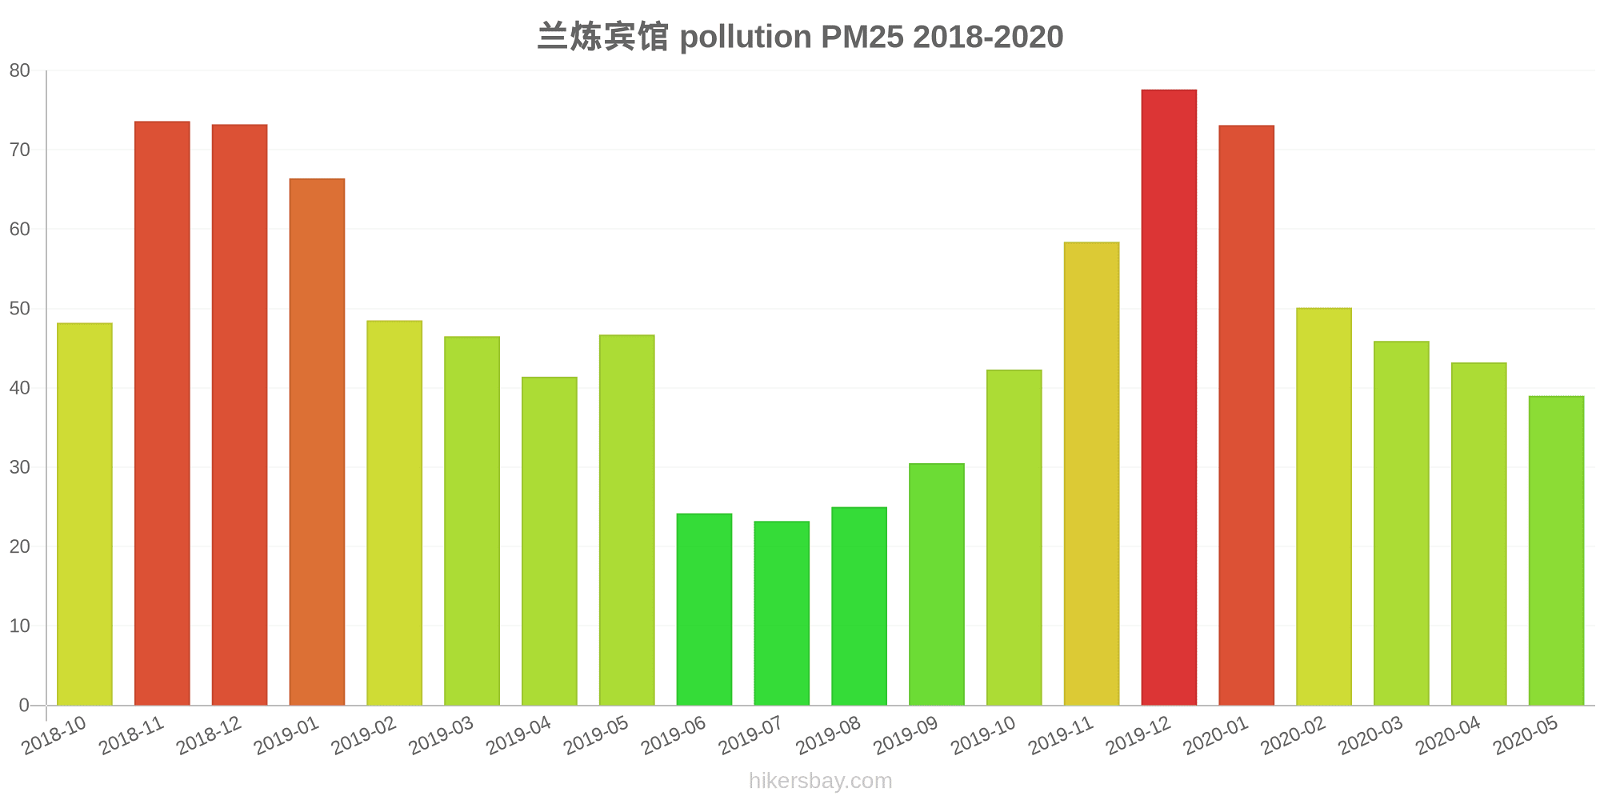
가장 높은 PM2.5 값이 기록되었습니다: 78 (2019년 12월).
미세먼지 의 최저 수준 PM2.5 오염은 월에서 발생합니다: 7월 (23).
CO 수준은 얼마나 높습니까? (일산화탄소 (CO))
100 (좋은)
NO2 수준은 얼마나 높습니까? (이산화질소 (NO2))
8 (좋은)
오늘날 O3 수준은 Fulilu? (오존 (O3))
0 (좋은)
SO2 오염 수준은 어떻습니까? (이산화황 (SO2))
9 (좋은)
현재 데이터 2022년 5월 27일 금요일 오후 12:00
PM10 7 (좋은)
PM2,5 2 (좋은)
CO 100 (좋은)
NO2 8 (좋은)
O3 0 (좋은)
SO2 9 (좋은)
최근 며칠 간의 대기 오염에 대한 데이터 Fulilu
index
2022-05-27
pm10
32
Moderate
pm25
24
Moderate
co
468
Good
no2
21
Good
o3
32
Good
so2
5
Good
data source »
Fulilu 에서 2018년 10월 2020년 5월

index
2020-05
2020-04
2020-03
2020-02
2020-01
2019-12
2019-11
2019-10
2019-09
2019-08
2019-07
2019-06
2019-05
2019-04
2019-03
2019-02
2019-01
2018-12
2018-11
2018-10
pm25
39 (Unhealthy for Sensitive Groups)
43 (Unhealthy for Sensitive Groups)
46 (Unhealthy for Sensitive Groups)
50 (Unhealthy for Sensitive Groups)
73 (Unhealthy)
78 (Very Unhealthy)
58 (Unhealthy)
42 (Unhealthy for Sensitive Groups)
31 (Moderate)
25 (Moderate)
23 (Moderate)
24 (Moderate)
47 (Unhealthy for Sensitive Groups)
41 (Unhealthy for Sensitive Groups)
47 (Unhealthy for Sensitive Groups)
49 (Unhealthy for Sensitive Groups)
66 (Unhealthy)
73 (Unhealthy)
74 (Unhealthy)
48 (Unhealthy for Sensitive Groups)
co
738 (Good)
704 (Good)
765 (Good)
967 (Good)
1 (Good)
1 (Good)
1 (Good)
835 (Good)
610 (Good)
519 (Good)
481 (Good)
487 (Good)
525 (Good)
604 (Good)
796 (Good)
946 (Good)
1 (Good)
1 (Good)
1 (Good)
976 (Good)
no2
43 (Moderate)
44 (Moderate)
45 (Moderate)
44 (Moderate)
62 (Moderate)
60 (Moderate)
56 (Moderate)
51 (Moderate)
45 (Moderate)
38 (Good)
37 (Good)
35 (Good)
36 (Good)
46 (Moderate)
52 (Moderate)
41 (Moderate)
67 (Moderate)
68 (Moderate)
73 (Moderate)
63 (Moderate)
o3
183 (Very Unhealthy)
166 (Unhealthy)
149 (Unhealthy for Sensitive Groups)
168 (Unhealthy)
109 (Moderate)
93 (Moderate)
90 (Moderate)
105 (Moderate)
158 (Unhealthy)
191 (Very Unhealthy)
203 (Very Unhealthy)
159 (Unhealthy)
139 (Unhealthy for Sensitive Groups)
212 (Very Unhealthy)
153 (Unhealthy)
114 (Moderate)
104 (Moderate)
77 (Moderate)
128 (Unhealthy for Sensitive Groups)
139 (Unhealthy for Sensitive Groups)
pm10
94 (Unhealthy)
100 (Unhealthy)
105 (Unhealthy)
97 (Unhealthy)
96 (Unhealthy)
120 (Very Unhealthy)
107 (Unhealthy)
80 (Unhealthy)
61 (Unhealthy for Sensitive Groups)
47 (Moderate)
52 (Unhealthy for Sensitive Groups)
49 (Moderate)
131 (Very Unhealthy)
102 (Unhealthy)
109 (Unhealthy)
99 (Unhealthy)
110 (Very Unhealthy)
150 (Very bad Hazardous)
187 (Very bad Hazardous)
105 (Unhealthy)
so2
16 (Good)
17 (Good)
16 (Good)
20 (Good)
24 (Good)
43 (Good)
24 (Good)
18 (Good)
14 (Good)
10 (Good)
9.6 (Good)
11 (Good)
9.2 (Good)
18 (Good)
21 (Good)
24 (Good)
31 (Good)
33 (Good)
25 (Good)
20 (Good)
data source »
兰炼宾馆
2022년 5월 27일 금요일 오후 12:00
PM10 6.7 (좋은)
미세먼지(PM10) 미세먼지
PM2,5 1.7 (좋은)
미세먼지(PM2.5) 먼지
CO 100 (좋은)
일산화탄소 (CO)
NO2 7.6 (좋은)
이산화질소 (NO2)
O3 0.02 (좋은)
오존 (O3)
SO2 8.6 (좋은)
이산화황 (SO2)
兰炼宾馆
index
2022-05-27
pm10
32
pm25
24
co
468
no2
21
o3
32
so2
4.6
兰炼宾馆
2018-10 2020-05
index
2020-05
2020-04
2020-03
2020-02
2020-01
2019-12
2019-11
2019-10
2019-09
2019-08
2019-07
2019-06
2019-05
2019-04
2019-03
2019-02
2019-01
2018-12
2018-11
2018-10
pm25
39
43
46
50
73
78
58
42
31
25
23
24
47
41
47
49
66
73
74
48
co
738
704
765
967
1
1
1
835
610
519
481
487
525
604
796
946
1
1
1
976
no2
43
44
45
44
62
60
56
51
45
38
37
35
36
46
52
41
67
68
73
63
o3
183
166
149
168
109
93
90
105
158
191
203
159
139
212
153
114
104
77
128
139
pm10
94
100
105
97
96
120
107
80
61
47
52
49
131
102
109
99
110
150
187
105
so2
16
17
16
20
24
43
24
18
14
10
9.6
11
9.2
18
21
24
31
33
25
20
* Pollution data source:
https://openaq.org
(ChinaAQIData)
The data is licensed under CC-By 4.0
PM10 7 (좋은)
PM2,5 2 (좋은)
CO 100 (좋은)
NO2 8 (좋은)
O3 0 (좋은)
SO2 9 (좋은)
최근 며칠 간의 대기 오염에 대한 데이터 Fulilu
| index | 2022-05-27 |
|---|---|
| pm10 | 32 Moderate |
| pm25 | 24 Moderate |
| co | 468 Good |
| no2 | 21 Good |
| o3 | 32 Good |
| so2 | 5 Good |

| index | 2020-05 | 2020-04 | 2020-03 | 2020-02 | 2020-01 | 2019-12 | 2019-11 | 2019-10 | 2019-09 | 2019-08 | 2019-07 | 2019-06 | 2019-05 | 2019-04 | 2019-03 | 2019-02 | 2019-01 | 2018-12 | 2018-11 | 2018-10 |
|---|---|---|---|---|---|---|---|---|---|---|---|---|---|---|---|---|---|---|---|---|
| pm25 | 39 (Unhealthy for Sensitive Groups) | 43 (Unhealthy for Sensitive Groups) | 46 (Unhealthy for Sensitive Groups) | 50 (Unhealthy for Sensitive Groups) | 73 (Unhealthy) | 78 (Very Unhealthy) | 58 (Unhealthy) | 42 (Unhealthy for Sensitive Groups) | 31 (Moderate) | 25 (Moderate) | 23 (Moderate) | 24 (Moderate) | 47 (Unhealthy for Sensitive Groups) | 41 (Unhealthy for Sensitive Groups) | 47 (Unhealthy for Sensitive Groups) | 49 (Unhealthy for Sensitive Groups) | 66 (Unhealthy) | 73 (Unhealthy) | 74 (Unhealthy) | 48 (Unhealthy for Sensitive Groups) |
| co | 738 (Good) | 704 (Good) | 765 (Good) | 967 (Good) | 1 (Good) | 1 (Good) | 1 (Good) | 835 (Good) | 610 (Good) | 519 (Good) | 481 (Good) | 487 (Good) | 525 (Good) | 604 (Good) | 796 (Good) | 946 (Good) | 1 (Good) | 1 (Good) | 1 (Good) | 976 (Good) |
| no2 | 43 (Moderate) | 44 (Moderate) | 45 (Moderate) | 44 (Moderate) | 62 (Moderate) | 60 (Moderate) | 56 (Moderate) | 51 (Moderate) | 45 (Moderate) | 38 (Good) | 37 (Good) | 35 (Good) | 36 (Good) | 46 (Moderate) | 52 (Moderate) | 41 (Moderate) | 67 (Moderate) | 68 (Moderate) | 73 (Moderate) | 63 (Moderate) |
| o3 | 183 (Very Unhealthy) | 166 (Unhealthy) | 149 (Unhealthy for Sensitive Groups) | 168 (Unhealthy) | 109 (Moderate) | 93 (Moderate) | 90 (Moderate) | 105 (Moderate) | 158 (Unhealthy) | 191 (Very Unhealthy) | 203 (Very Unhealthy) | 159 (Unhealthy) | 139 (Unhealthy for Sensitive Groups) | 212 (Very Unhealthy) | 153 (Unhealthy) | 114 (Moderate) | 104 (Moderate) | 77 (Moderate) | 128 (Unhealthy for Sensitive Groups) | 139 (Unhealthy for Sensitive Groups) |
| pm10 | 94 (Unhealthy) | 100 (Unhealthy) | 105 (Unhealthy) | 97 (Unhealthy) | 96 (Unhealthy) | 120 (Very Unhealthy) | 107 (Unhealthy) | 80 (Unhealthy) | 61 (Unhealthy for Sensitive Groups) | 47 (Moderate) | 52 (Unhealthy for Sensitive Groups) | 49 (Moderate) | 131 (Very Unhealthy) | 102 (Unhealthy) | 109 (Unhealthy) | 99 (Unhealthy) | 110 (Very Unhealthy) | 150 (Very bad Hazardous) | 187 (Very bad Hazardous) | 105 (Unhealthy) |
| so2 | 16 (Good) | 17 (Good) | 16 (Good) | 20 (Good) | 24 (Good) | 43 (Good) | 24 (Good) | 18 (Good) | 14 (Good) | 10 (Good) | 9.6 (Good) | 11 (Good) | 9.2 (Good) | 18 (Good) | 21 (Good) | 24 (Good) | 31 (Good) | 33 (Good) | 25 (Good) | 20 (Good) |
PM10 6.7 (좋은)
미세먼지(PM10) 미세먼지PM2,5 1.7 (좋은)
미세먼지(PM2.5) 먼지CO 100 (좋은)
일산화탄소 (CO)NO2 7.6 (좋은)
이산화질소 (NO2)O3 0.02 (좋은)
오존 (O3)SO2 8.6 (좋은)
이산화황 (SO2)兰炼宾馆
| index | 2022-05-27 |
|---|---|
| pm10 | 32 |
| pm25 | 24 |
| co | 468 |
| no2 | 21 |
| o3 | 32 |
| so2 | 4.6 |
兰炼宾馆

| index | 2020-05 | 2020-04 | 2020-03 | 2020-02 | 2020-01 | 2019-12 | 2019-11 | 2019-10 | 2019-09 | 2019-08 | 2019-07 | 2019-06 | 2019-05 | 2019-04 | 2019-03 | 2019-02 | 2019-01 | 2018-12 | 2018-11 | 2018-10 |
|---|---|---|---|---|---|---|---|---|---|---|---|---|---|---|---|---|---|---|---|---|
| pm25 | 39 | 43 | 46 | 50 | 73 | 78 | 58 | 42 | 31 | 25 | 23 | 24 | 47 | 41 | 47 | 49 | 66 | 73 | 74 | 48 |
| co | 738 | 704 | 765 | 967 | 1 | 1 | 1 | 835 | 610 | 519 | 481 | 487 | 525 | 604 | 796 | 946 | 1 | 1 | 1 | 976 |
| no2 | 43 | 44 | 45 | 44 | 62 | 60 | 56 | 51 | 45 | 38 | 37 | 35 | 36 | 46 | 52 | 41 | 67 | 68 | 73 | 63 |
| o3 | 183 | 166 | 149 | 168 | 109 | 93 | 90 | 105 | 158 | 191 | 203 | 159 | 139 | 212 | 153 | 114 | 104 | 77 | 128 | 139 |
| pm10 | 94 | 100 | 105 | 97 | 96 | 120 | 107 | 80 | 61 | 47 | 52 | 49 | 131 | 102 | 109 | 99 | 110 | 150 | 187 | 105 |
| so2 | 16 | 17 | 16 | 20 | 24 | 43 | 24 | 18 | 14 | 10 | 9.6 | 11 | 9.2 | 18 | 21 | 24 | 31 | 33 | 25 | 20 |