Pingxiang Shi 대기 오염: 실시간 대기 질 지수 및 스모그 경보.
Pingxiang Shi 대한 오염 및 대기 질 예측. 오늘은 2026년 6월 2일 화요일. 다음과 같은 대기 오염 값이 Pingxiang Shi 기록되었습니다.- 미세먼지(PM10) 미세먼지 - 179 (매우 나쁜 위험)
- 미세먼지(PM2.5) 먼지 - 35 (민감한 그룹에 대 한 건강에 해로운)
- 오존 (O3) - 0 (좋은)
- 이산화질소 (NO2) - 0 (좋은)
- 이산화황 (SO2) - 0 (좋은)

오늘날 Pingxiang Shi 공기 질은 무엇입니까? 공기는 Pingxiang Shi 오염되어 있습니까?. 스모그가 있습니까?
Pingxiang Shi PM10의 수준은 무엇입니까? (미세먼지(PM10) 미세먼지)
Pingxiang Shi 의 현재 수준의 미립자 물질 PM10:
179 (매우 나쁜 위험)
가장 높은 PM10 값은 일반적으로 월에서 발생합니다: 98 (2019년 12월).
미립자 물질 PM10 오염의 가장 낮은 값 Pingxiang Shi 은 일반적으로 기록됩니다: 7월 (32).
Pingxiang Shi PM2.5의 현재 수준은 무엇입니까? (미세먼지(PM2.5) 먼지)
오늘의 PM2.5 수준은 다음과 같은 것입니다.
35 (민감한 그룹에 대 한 건강에 해로운)
비교를 위해, 지난 7 일 Pingxiang Shi PM2.5의 가장 높은 수준은: 56 (2022년 5월 27일 금요일) 가장 낮은: 56 (2022년 5월 27일 금요일).
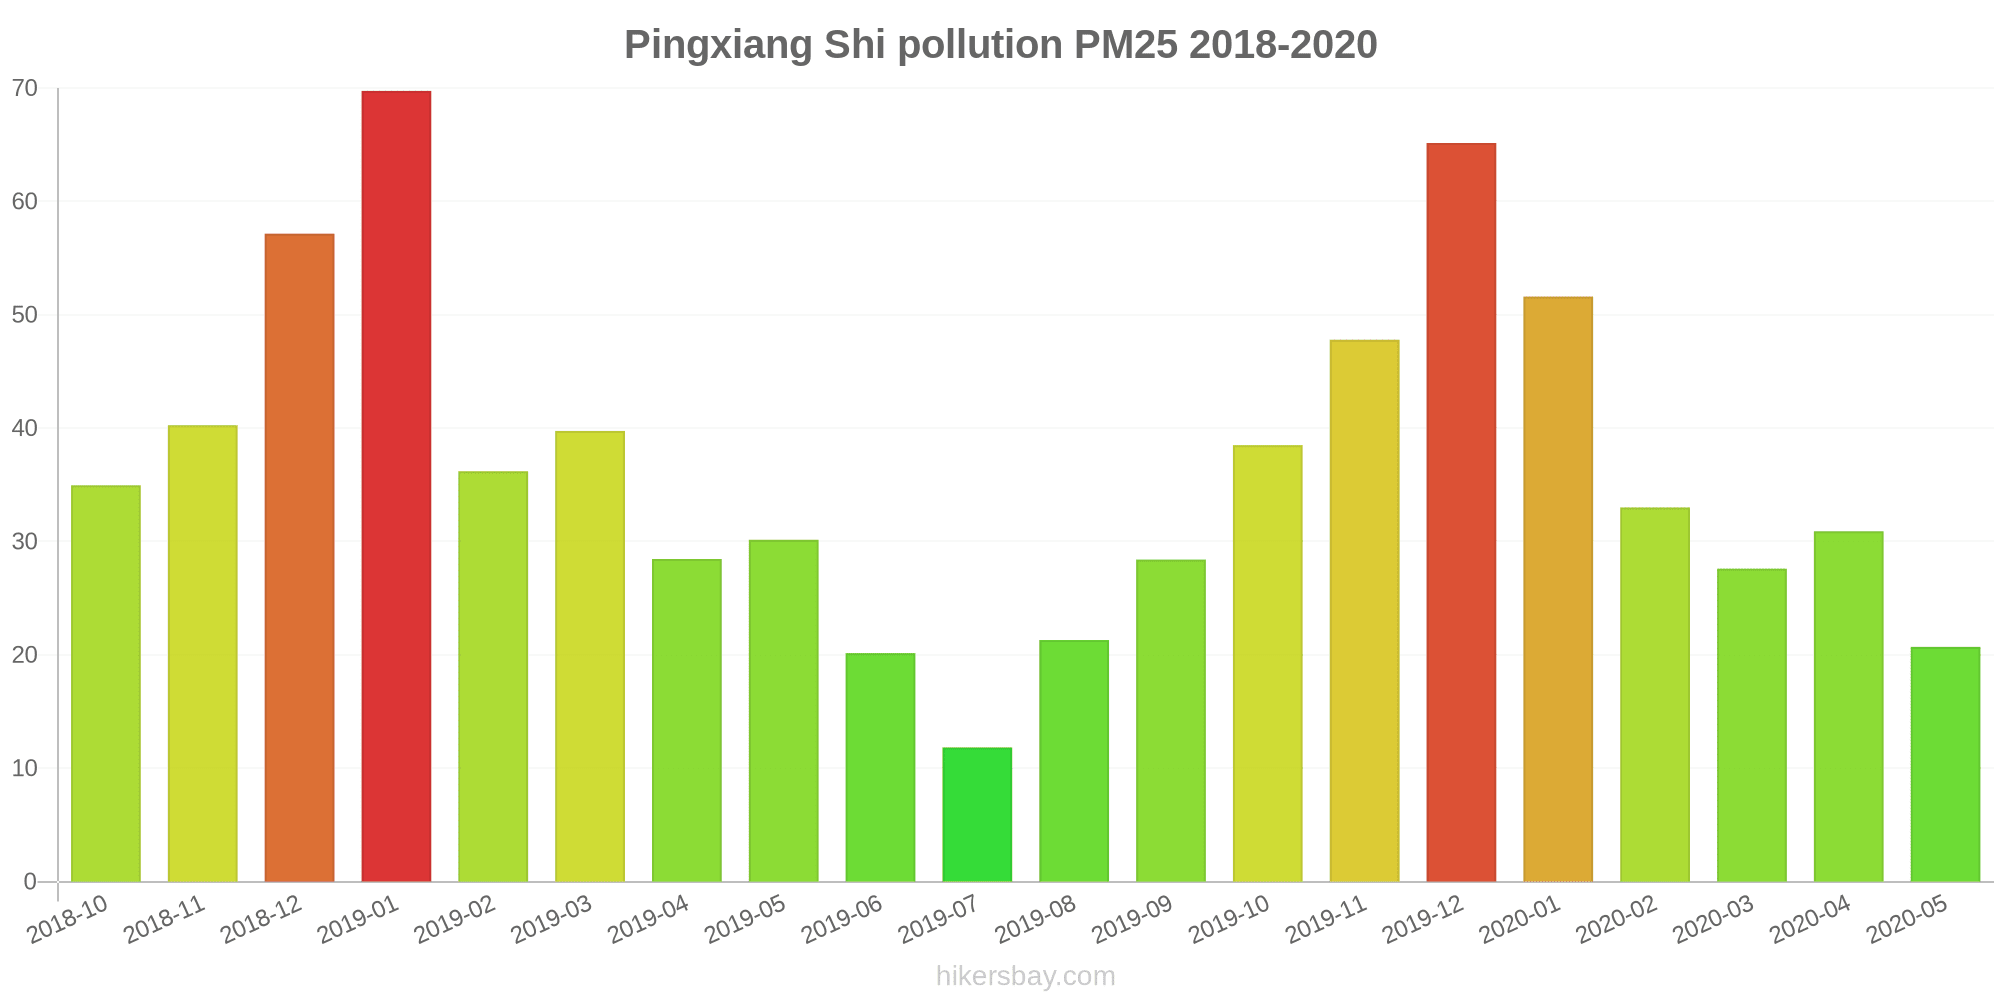
가장 높은 PM2.5 값이 기록되었습니다: 70 (2019년 1월).
미세먼지 의 최저 수준 PM2.5 오염은 월에서 발생합니다: 7월 (12).
오늘날 O3 수준은 Pingxiang Shi? (오존 (O3))
0 (좋은)
NO2 수준은 얼마나 높습니까? (이산화질소 (NO2))
0 (좋은)
SO2 오염 수준은 어떻습니까? (이산화황 (SO2))
0 (좋은)
현재 데이터 2022년 5월 27일 금요일 오후 12:00
PM10 179 (매우 나쁜 위험)
PM2,5 35 (민감한 그룹에 대 한 건강에 해로운)
O3 0 (좋은)
NO2 0 (좋은)
SO2 0 (좋은)
최근 며칠 간의 대기 오염에 대한 데이터 Pingxiang Shi
index
2022-05-27
pm10
56
Unhealthy for Sensitive Groups
pm25
56
Unhealthy
o3
0
Good
no2
0
Good
so2
0
Good
data source »
Pingxiang Shi 에서 2018년 10월 2020년 5월

index
2020-05
2020-04
2020-03
2020-02
2020-01
2019-12
2019-11
2019-10
2019-09
2019-08
2019-07
2019-06
2019-05
2019-04
2019-03
2019-02
2019-01
2018-12
2018-11
2018-10
pm25
21 (Moderate)
31 (Moderate)
28 (Moderate)
33 (Moderate)
52 (Unhealthy for Sensitive Groups)
65 (Unhealthy)
48 (Unhealthy for Sensitive Groups)
39 (Unhealthy for Sensitive Groups)
28 (Moderate)
21 (Moderate)
12 (Good)
20 (Moderate)
30 (Moderate)
28 (Moderate)
40 (Unhealthy for Sensitive Groups)
36 (Unhealthy for Sensitive Groups)
70 (Unhealthy)
57 (Unhealthy)
40 (Unhealthy for Sensitive Groups)
35 (Moderate)
co
1 (Good)
1 (Good)
1 (Good)
1 (Good)
1 (Good)
1.5 (Good)
1 (Good)
1 (Good)
1 (Good)
1 (Good)
1 (Good)
1 (Good)
1 (Good)
1 (Good)
1 (Good)
1 (Good)
1 (Good)
1 (Good)
1 (Good)
1 (Good)
no2
20 (Good)
29 (Good)
24 (Good)
19 (Good)
29 (Good)
42 (Moderate)
37 (Good)
32 (Good)
29 (Good)
26 (Good)
18 (Good)
18 (Good)
22 (Good)
23 (Good)
28 (Good)
18 (Good)
30 (Good)
31 (Good)
32 (Good)
30 (Good)
o3
112 (Moderate)
120 (Unhealthy for Sensitive Groups)
69 (Good)
67 (Good)
49 (Good)
65 (Good)
110 (Moderate)
129 (Unhealthy for Sensitive Groups)
180 (Very Unhealthy)
153 (Unhealthy)
109 (Moderate)
110 (Moderate)
113 (Moderate)
85 (Moderate)
78 (Moderate)
40 (Good)
41 (Good)
34 (Good)
72 (Moderate)
102 (Moderate)
pm10
48 (Moderate)
62 (Unhealthy for Sensitive Groups)
46 (Moderate)
47 (Moderate)
69 (Unhealthy for Sensitive Groups)
98 (Unhealthy)
94 (Unhealthy)
76 (Unhealthy for Sensitive Groups)
68 (Unhealthy for Sensitive Groups)
54 (Unhealthy for Sensitive Groups)
32 (Moderate)
41 (Moderate)
60 (Unhealthy for Sensitive Groups)
48 (Moderate)
67 (Unhealthy for Sensitive Groups)
53 (Unhealthy for Sensitive Groups)
94 (Unhealthy)
79 (Unhealthy for Sensitive Groups)
67 (Unhealthy for Sensitive Groups)
66 (Unhealthy for Sensitive Groups)
so2
16 (Good)
19 (Good)
16 (Good)
11 (Good)
18 (Good)
24 (Good)
27 (Good)
21 (Good)
21 (Good)
25 (Good)
14 (Good)
14 (Good)
18 (Good)
15 (Good)
15 (Good)
7.6 (Good)
14 (Good)
17 (Good)
20 (Good)
18 (Good)
data source »
安源区政府
2022년 5월 27일 금요일 오후 12:00
PM10 179 (매우 나쁜 위험)
미세먼지(PM10) 미세먼지
PM2,5 35 (민감한 그룹에 대 한 건강에 해로운)
미세먼지(PM2.5) 먼지
O3 0.04 (좋은)
오존 (O3)
NO2 0 (좋은)
이산화질소 (NO2)
SO2 0 (좋은)
이산화황 (SO2)
市政府车库
2022년 5월 27일 금요일 오후 12:00
PM10 179 (매우 나쁜 위험)
미세먼지(PM10) 미세먼지
PM2,5 35 (민감한 그룹에 대 한 건강에 해로운)
미세먼지(PM2.5) 먼지
O3 0.04 (좋은)
오존 (O3)
NO2 0 (좋은)
이산화질소 (NO2)
SO2 0 (좋은)
이산화황 (SO2)
安源区政府
index
2022-05-27
pm10
56
pm25
56
o3
0.03
no2
0
so2
0
市政府车库
index
2022-05-27
pm10
56
pm25
56
o3
0.03
no2
0
so2
0
安源区政府
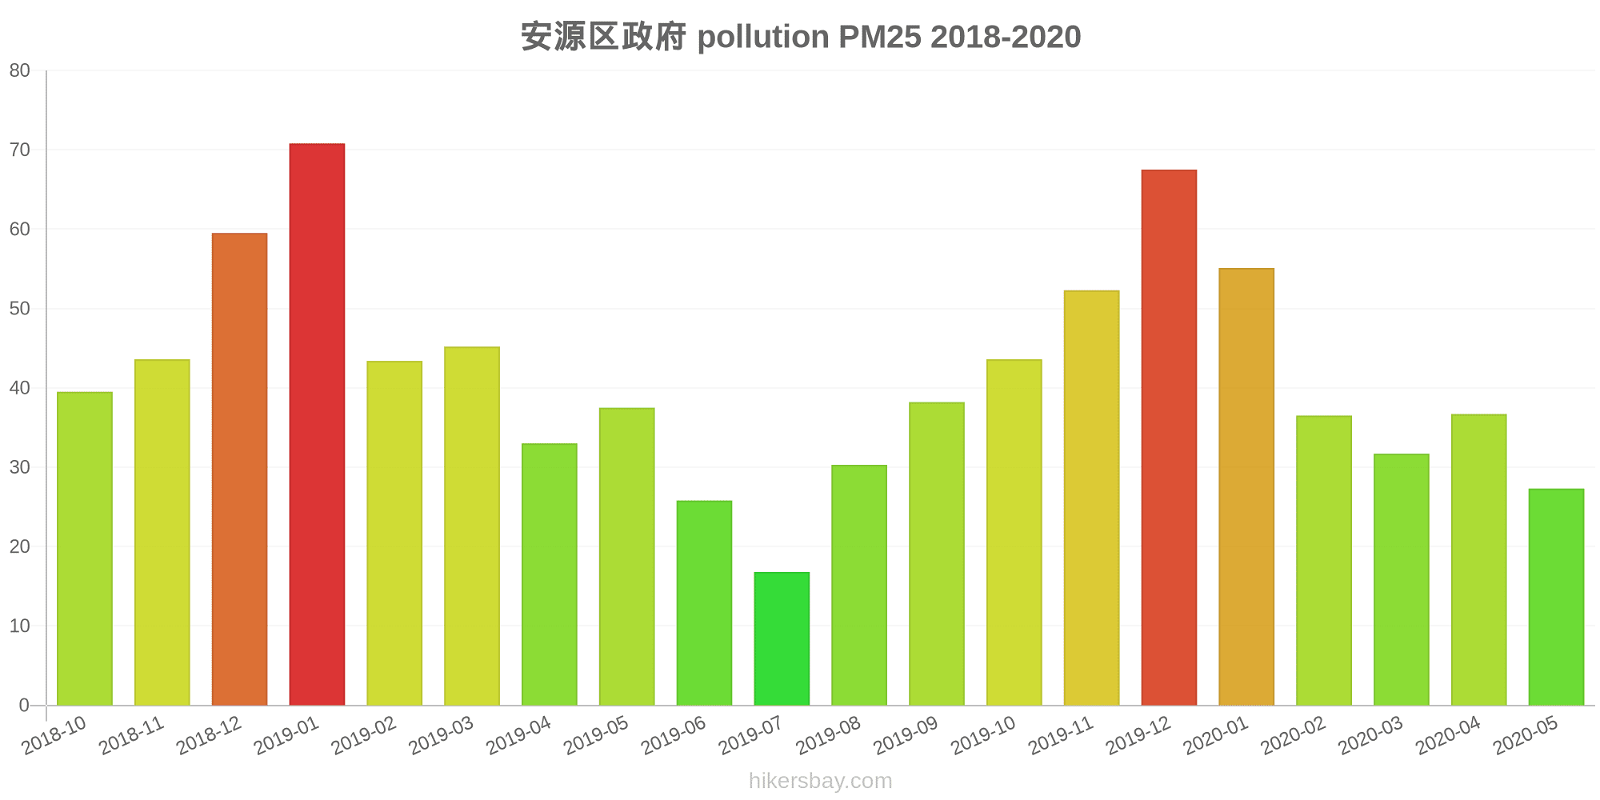
2018-10 2020-05
index
2020-05
2020-04
2020-03
2020-02
2020-01
2019-12
2019-11
2019-10
2019-09
2019-08
2019-07
2019-06
2019-05
2019-04
2019-03
2019-02
2019-01
2018-12
2018-11
2018-10
pm25
27
37
32
37
55
68
52
44
38
30
17
26
38
33
45
43
71
60
44
40
co
1
1
1
1
1
1
1
1
1
1
1
1
1
1
1
1
1
1
1
1
no2
18
27
22
16
28
41
36
35
29
27
19
19
23
24
29
16
26
27
29
29
o3
104
110
65
66
49
61
109
123
169
156
115
107
110
86
78
37
40
32
64
88
pm10
56
67
53
51
74
98
101
91
80
64
43
54
69
54
75
61
96
83
71
74
so2
15
20
18
12
21
21
23
18
18
26
14
14
19
15
14
8.2
15
17
20
19
市政府车库
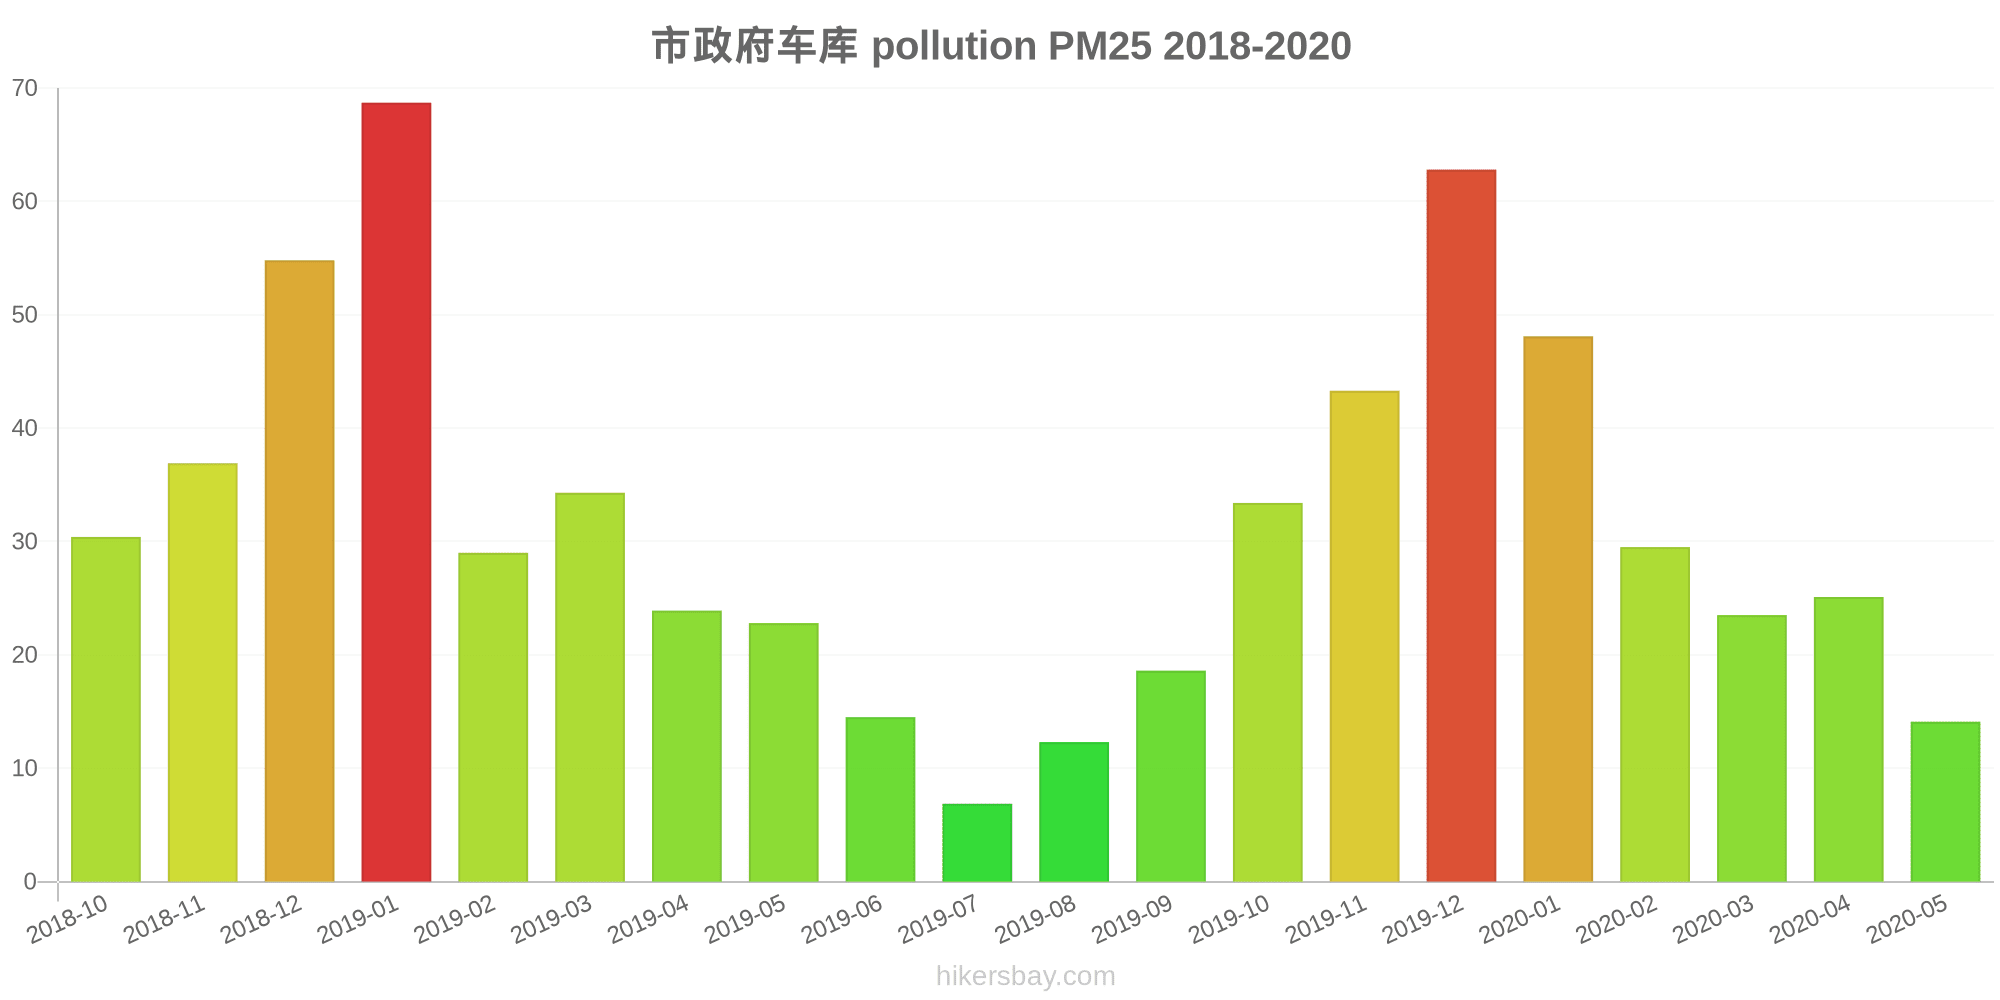
2018-10 2020-05

index
2020-05
2020-04
2020-03
2020-02
2020-01
2019-12
2019-11
2019-10
2019-09
2019-08
2019-07
2019-06
2019-05
2019-04
2019-03
2019-02
2019-01
2018-12
2018-11
2018-10
pm25
14
25
24
30
48
63
43
33
19
12
6.9
15
23
24
34
29
69
55
37
30
co
1
1
1
1
1
2
1
1
1
1
1
1
1
1
1
1
1
1
1
1
no2
23
32
25
21
30
43
37
30
29
25
18
17
20
21
27
20
35
34
36
31
o3
119
130
74
68
49
68
111
134
191
150
103
112
115
85
78
42
43
36
80
115
pm10
40
58
39
42
64
99
87
60
56
44
20
28
51
42
60
45
92
75
62
59
so2
16
18
14
11
16
27
31
25
24
23
14
13
18
16
16
7
14
18
19
17
* Pollution data source:
https://openaq.org
(ChinaAQIData)
The data is licensed under CC-By 4.0
PM10 179 (매우 나쁜 위험)
PM2,5 35 (민감한 그룹에 대 한 건강에 해로운)
O3 0 (좋은)
NO2 0 (좋은)
SO2 0 (좋은)
최근 며칠 간의 대기 오염에 대한 데이터 Pingxiang Shi
| index | 2022-05-27 |
|---|---|
| pm10 | 56 Unhealthy for Sensitive Groups |
| pm25 | 56 Unhealthy |
| o3 | 0 Good |
| no2 | 0 Good |
| so2 | 0 Good |
| index | 2020-05 | 2020-04 | 2020-03 | 2020-02 | 2020-01 | 2019-12 | 2019-11 | 2019-10 | 2019-09 | 2019-08 | 2019-07 | 2019-06 | 2019-05 | 2019-04 | 2019-03 | 2019-02 | 2019-01 | 2018-12 | 2018-11 | 2018-10 |
|---|---|---|---|---|---|---|---|---|---|---|---|---|---|---|---|---|---|---|---|---|
| pm25 | 21 (Moderate) | 31 (Moderate) | 28 (Moderate) | 33 (Moderate) | 52 (Unhealthy for Sensitive Groups) | 65 (Unhealthy) | 48 (Unhealthy for Sensitive Groups) | 39 (Unhealthy for Sensitive Groups) | 28 (Moderate) | 21 (Moderate) | 12 (Good) | 20 (Moderate) | 30 (Moderate) | 28 (Moderate) | 40 (Unhealthy for Sensitive Groups) | 36 (Unhealthy for Sensitive Groups) | 70 (Unhealthy) | 57 (Unhealthy) | 40 (Unhealthy for Sensitive Groups) | 35 (Moderate) |
| co | 1 (Good) | 1 (Good) | 1 (Good) | 1 (Good) | 1 (Good) | 1.5 (Good) | 1 (Good) | 1 (Good) | 1 (Good) | 1 (Good) | 1 (Good) | 1 (Good) | 1 (Good) | 1 (Good) | 1 (Good) | 1 (Good) | 1 (Good) | 1 (Good) | 1 (Good) | 1 (Good) |
| no2 | 20 (Good) | 29 (Good) | 24 (Good) | 19 (Good) | 29 (Good) | 42 (Moderate) | 37 (Good) | 32 (Good) | 29 (Good) | 26 (Good) | 18 (Good) | 18 (Good) | 22 (Good) | 23 (Good) | 28 (Good) | 18 (Good) | 30 (Good) | 31 (Good) | 32 (Good) | 30 (Good) |
| o3 | 112 (Moderate) | 120 (Unhealthy for Sensitive Groups) | 69 (Good) | 67 (Good) | 49 (Good) | 65 (Good) | 110 (Moderate) | 129 (Unhealthy for Sensitive Groups) | 180 (Very Unhealthy) | 153 (Unhealthy) | 109 (Moderate) | 110 (Moderate) | 113 (Moderate) | 85 (Moderate) | 78 (Moderate) | 40 (Good) | 41 (Good) | 34 (Good) | 72 (Moderate) | 102 (Moderate) |
| pm10 | 48 (Moderate) | 62 (Unhealthy for Sensitive Groups) | 46 (Moderate) | 47 (Moderate) | 69 (Unhealthy for Sensitive Groups) | 98 (Unhealthy) | 94 (Unhealthy) | 76 (Unhealthy for Sensitive Groups) | 68 (Unhealthy for Sensitive Groups) | 54 (Unhealthy for Sensitive Groups) | 32 (Moderate) | 41 (Moderate) | 60 (Unhealthy for Sensitive Groups) | 48 (Moderate) | 67 (Unhealthy for Sensitive Groups) | 53 (Unhealthy for Sensitive Groups) | 94 (Unhealthy) | 79 (Unhealthy for Sensitive Groups) | 67 (Unhealthy for Sensitive Groups) | 66 (Unhealthy for Sensitive Groups) |
| so2 | 16 (Good) | 19 (Good) | 16 (Good) | 11 (Good) | 18 (Good) | 24 (Good) | 27 (Good) | 21 (Good) | 21 (Good) | 25 (Good) | 14 (Good) | 14 (Good) | 18 (Good) | 15 (Good) | 15 (Good) | 7.6 (Good) | 14 (Good) | 17 (Good) | 20 (Good) | 18 (Good) |
PM10 179 (매우 나쁜 위험)
미세먼지(PM10) 미세먼지PM2,5 35 (민감한 그룹에 대 한 건강에 해로운)
미세먼지(PM2.5) 먼지O3 0.04 (좋은)
오존 (O3)NO2 0 (좋은)
이산화질소 (NO2)SO2 0 (좋은)
이산화황 (SO2)PM10 179 (매우 나쁜 위험)
미세먼지(PM10) 미세먼지PM2,5 35 (민감한 그룹에 대 한 건강에 해로운)
미세먼지(PM2.5) 먼지O3 0.04 (좋은)
오존 (O3)NO2 0 (좋은)
이산화질소 (NO2)SO2 0 (좋은)
이산화황 (SO2)安源区政府
| index | 2022-05-27 |
|---|---|
| pm10 | 56 |
| pm25 | 56 |
| o3 | 0.03 |
| no2 | 0 |
| so2 | 0 |
市政府车库
| index | 2022-05-27 |
|---|---|
| pm10 | 56 |
| pm25 | 56 |
| o3 | 0.03 |
| no2 | 0 |
| so2 | 0 |
安源区政府

| index | 2020-05 | 2020-04 | 2020-03 | 2020-02 | 2020-01 | 2019-12 | 2019-11 | 2019-10 | 2019-09 | 2019-08 | 2019-07 | 2019-06 | 2019-05 | 2019-04 | 2019-03 | 2019-02 | 2019-01 | 2018-12 | 2018-11 | 2018-10 |
|---|---|---|---|---|---|---|---|---|---|---|---|---|---|---|---|---|---|---|---|---|
| pm25 | 27 | 37 | 32 | 37 | 55 | 68 | 52 | 44 | 38 | 30 | 17 | 26 | 38 | 33 | 45 | 43 | 71 | 60 | 44 | 40 |
| co | 1 | 1 | 1 | 1 | 1 | 1 | 1 | 1 | 1 | 1 | 1 | 1 | 1 | 1 | 1 | 1 | 1 | 1 | 1 | 1 |
| no2 | 18 | 27 | 22 | 16 | 28 | 41 | 36 | 35 | 29 | 27 | 19 | 19 | 23 | 24 | 29 | 16 | 26 | 27 | 29 | 29 |
| o3 | 104 | 110 | 65 | 66 | 49 | 61 | 109 | 123 | 169 | 156 | 115 | 107 | 110 | 86 | 78 | 37 | 40 | 32 | 64 | 88 |
| pm10 | 56 | 67 | 53 | 51 | 74 | 98 | 101 | 91 | 80 | 64 | 43 | 54 | 69 | 54 | 75 | 61 | 96 | 83 | 71 | 74 |
| so2 | 15 | 20 | 18 | 12 | 21 | 21 | 23 | 18 | 18 | 26 | 14 | 14 | 19 | 15 | 14 | 8.2 | 15 | 17 | 20 | 19 |
市政府车库
| index | 2020-05 | 2020-04 | 2020-03 | 2020-02 | 2020-01 | 2019-12 | 2019-11 | 2019-10 | 2019-09 | 2019-08 | 2019-07 | 2019-06 | 2019-05 | 2019-04 | 2019-03 | 2019-02 | 2019-01 | 2018-12 | 2018-11 | 2018-10 |
|---|---|---|---|---|---|---|---|---|---|---|---|---|---|---|---|---|---|---|---|---|
| pm25 | 14 | 25 | 24 | 30 | 48 | 63 | 43 | 33 | 19 | 12 | 6.9 | 15 | 23 | 24 | 34 | 29 | 69 | 55 | 37 | 30 |
| co | 1 | 1 | 1 | 1 | 1 | 2 | 1 | 1 | 1 | 1 | 1 | 1 | 1 | 1 | 1 | 1 | 1 | 1 | 1 | 1 |
| no2 | 23 | 32 | 25 | 21 | 30 | 43 | 37 | 30 | 29 | 25 | 18 | 17 | 20 | 21 | 27 | 20 | 35 | 34 | 36 | 31 |
| o3 | 119 | 130 | 74 | 68 | 49 | 68 | 111 | 134 | 191 | 150 | 103 | 112 | 115 | 85 | 78 | 42 | 43 | 36 | 80 | 115 |
| pm10 | 40 | 58 | 39 | 42 | 64 | 99 | 87 | 60 | 56 | 44 | 20 | 28 | 51 | 42 | 60 | 45 | 92 | 75 | 62 | 59 |
| so2 | 16 | 18 | 14 | 11 | 16 | 27 | 31 | 25 | 24 | 23 | 14 | 13 | 18 | 16 | 16 | 7 | 14 | 18 | 19 | 17 |