Thompson-Nicola Regional District 대기 오염: 실시간 대기 질 지수 및 스모그 경보.
Thompson-Nicola Regional District 대한 오염 및 대기 질 예측. 오늘은 2026년 6월 18일 목요일. 다음과 같은 대기 오염 값이 Thompson-Nicola Regional District 기록되었습니다.- 이산화황 (SO2) - 0 (좋은)
- 미세먼지(PM2.5) 먼지 - 1 (좋은)
- 오존 (O3) - 0 (좋은)
- 이산화질소 (NO2) - 0 (좋은)

오늘날 Thompson-Nicola Regional District 공기 질은 무엇입니까? 공기는 Thompson-Nicola Regional District 오염되어 있습니까?. 스모그가 있습니까?
SO2 오염 수준은 어떻습니까? (이산화황 (SO2))
0 (좋은)
Thompson-Nicola Regional District PM2.5의 현재 수준은 무엇입니까? (미세먼지(PM2.5) 먼지)
오늘의 PM2.5 수준은 다음과 같은 것입니다.
1 (좋은)
비교를 위해, 지난 7 일 Thompson-Nicola Regional District PM2.5의 가장 높은 수준은: 7 (2024년 4월 14일 일요일) 가장 낮은: 3 (2024년 4월 9일 화요일).
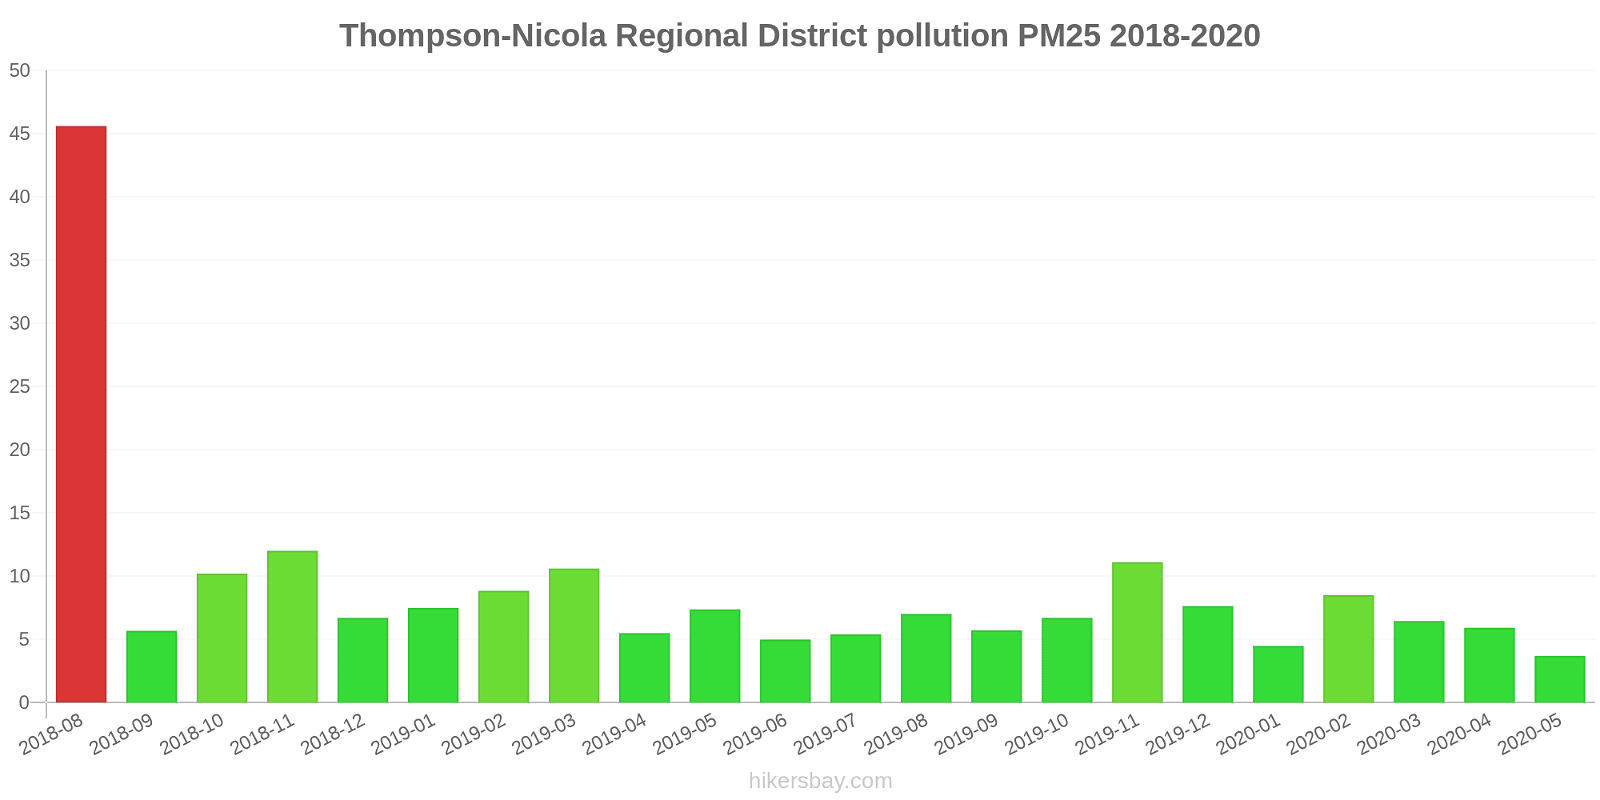
가장 높은 PM2.5 값이 기록되었습니다: 46 (2018년 8월).
미세먼지 의 최저 수준 PM2.5 오염은 월에서 발생합니다: 5월 (3.7).
오늘날 O3 수준은 Thompson-Nicola Regional District? (오존 (O3))
0 (좋은)
NO2 수준은 얼마나 높습니까? (이산화질소 (NO2))
0 (좋은)
현재 데이터 2024년 4월 16일 화요일 오전 10:00
SO2 0 (좋은)
PM2,5 1 (좋은)
O3 0 (좋은)
0 (좋은)
NO2 0 (좋은)
최근 며칠 간의 대기 오염에 대한 데이터 Thompson-Nicola Regional District
index
2024-04-09
2024-04-10
2024-04-11
2024-04-12
2024-04-13
2024-04-14
2024-04-15
2024-04-16
no2
0
Good
0
Good
0
Good
0
Good
0
Good
0
Good
0
Good
0
Good
o3
0
Good
0
Good
0
Good
0
Good
0
Good
0
Good
0
Good
0
Good
pm25
3
Good
4
Good
4
Good
5
Good
4
Good
7
Good
6
Good
3
Good
no
0
Good
0
Good
0
Good
0
Good
0
Good
0
Good
0
Good
0
Good
so2
0
Good
0
Good
0
Good
0
Good
0
Good
0
Good
0
Good
0
Good
data source »
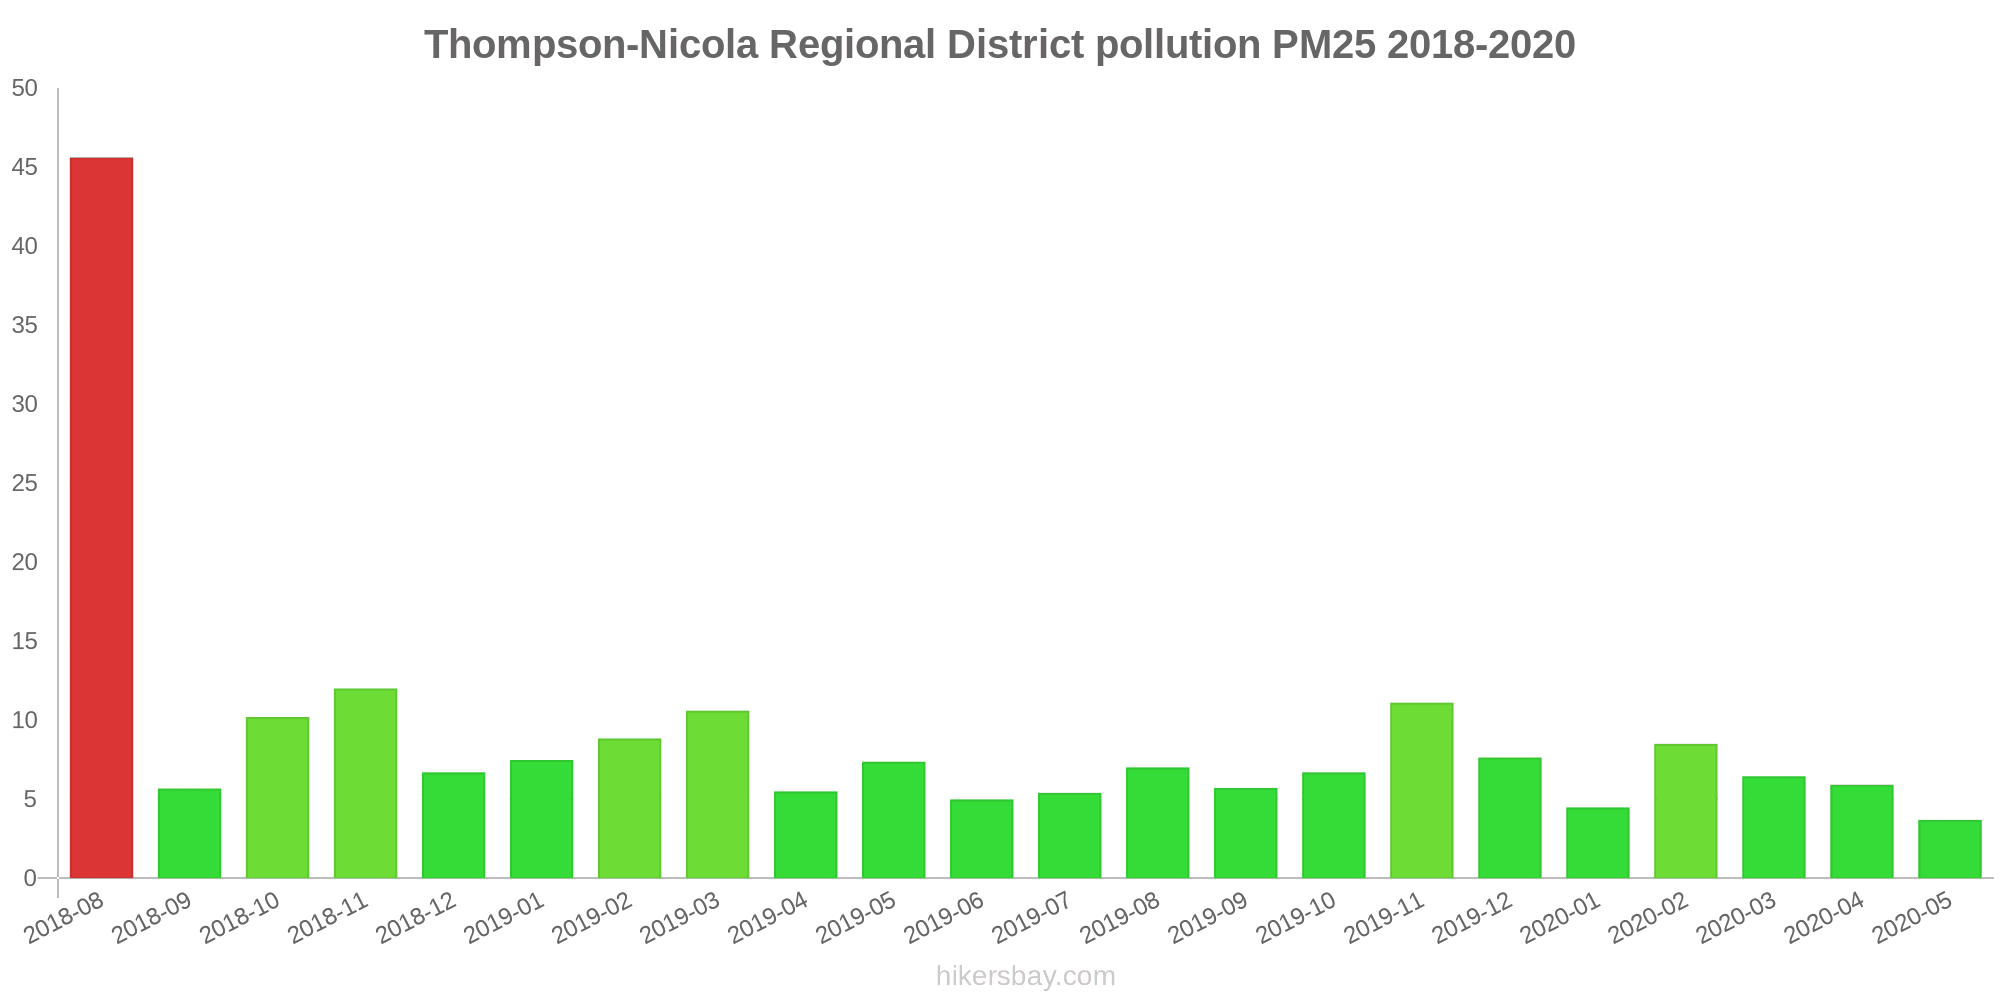
Thompson-Nicola Regional District 에서 2018년 8월 2020년 5월
index
2020-05
2020-04
2020-03
2020-02
2020-01
2019-12
2019-11
2019-10
2019-09
2019-08
2019-07
2019-06
2019-05
2019-04
2019-03
2019-02
2019-01
2018-12
2018-11
2018-10
2018-09
2018-08
pm25
3.7 (Good)
5.9 (Good)
6.5 (Good)
8.5 (Good)
4.5 (Good)
7.6 (Good)
11 (Good)
6.7 (Good)
5.7 (Good)
7 (Good)
5.4 (Good)
5 (Good)
7.4 (Good)
5.5 (Good)
11 (Good)
8.8 (Good)
7.5 (Good)
6.7 (Good)
12 (Good)
10 (Good)
5.7 (Good)
46 (Unhealthy for Sensitive Groups)
data source »
삶의 질 Thompson-Nicola Regional District
도시의 녹색 과 공원
Thompson-Nicola Regional District
75%
미국: 70%
베네수엘라: 41%
아이슬란드: 72%
미립자 물질 PM2.5
Thompson-Nicola Regional District
8 (Good)
도시에서 시간을 보내는 즐거움
Thompson-Nicola Regional District
75%
미국: 75%
바하마: 53%
베네수엘라: 41%
아이슬란드: 89%
미립자 물질 PM10
Thompson-Nicola Regional District
15 (Good)
대기 오염
Thompson-Nicola Regional District
32%
미국: 29%
바하마: 52%
베네수엘라: 59%
아이슬란드: 13%
쓰레기 처리
Thompson-Nicola Regional District
75%
미국: 71%
바하마: 29%
베네수엘라: 18%
아이슬란드: 79%
식수의 가용성 및 품질
Thompson-Nicola Regional District
80%
미국: 71%
바하마: 55%
베네수엘라: 28%
아이슬란드: 96%
청결과 단정함
Thompson-Nicola Regional District
68%
미국: 60%
바하마: 35%
베네수엘라: 22%
아이슬란드: 75%
소음 및 빛 공해
Thompson-Nicola Regional District
32%
미국: 47%
바하마: 39%
베네수엘라: 47%
아이슬란드: 23%
수질 오염
Thompson-Nicola Regional District
25%
미국: 44%
바하마: 58%
베네수엘라: 76%
아이슬란드: 8.4%
Source: Numbeo
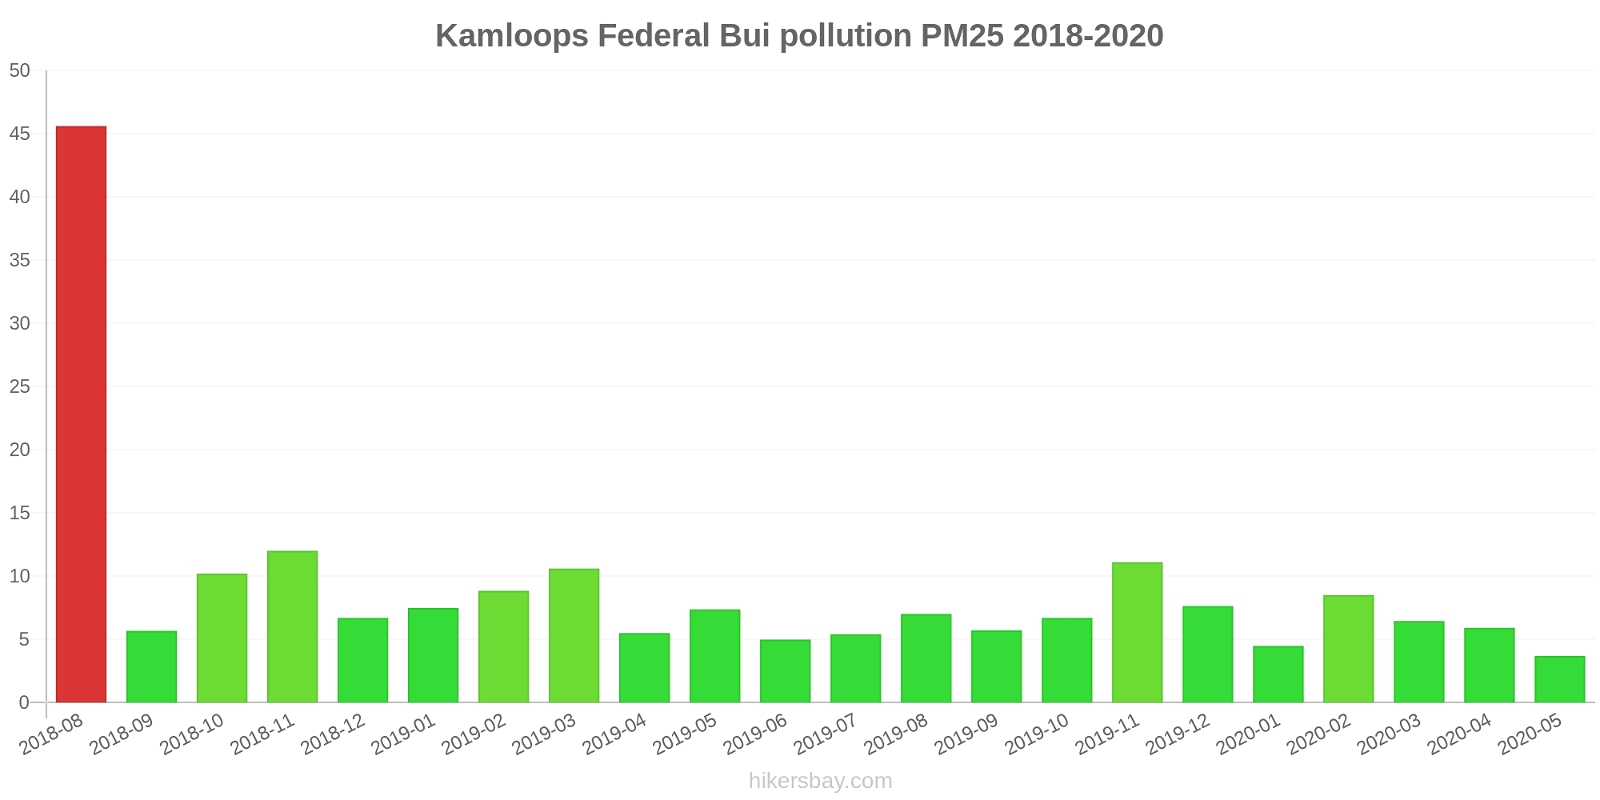
Kamloops Federal Bui
2024년 4월 16일 화요일 오전 10:00
SO2 0 (좋은)
이산화황 (SO2)
PM2,5 0.9 (좋은)
미세먼지(PM2.5) 먼지
O3 0.03 (좋은)
오존 (O3)
0 (좋은)
index_name_no
NO2 0.01 (좋은)
이산화질소 (NO2)
Kamloops Federal Bui
index
2024-04-16
2024-04-15
2024-04-14
2024-04-13
2024-04-12
2024-04-11
2024-04-10
2024-04-09
no2
0
0.01
0.01
0.01
0.01
0.01
0.01
0.01
o3
0.04
0.04
0.03
0.03
0.03
0.03
0.02
0.03
pm25
2.6
6.1
6.6
4.1
5.3
4.4
4
3.2
no
0
0
0.01
0
0
0
0.01
0
so2
0
0
0
0
0
0
0
0
Kamloops Federal Bui
2018-08 2020-05
index
2020-05
2020-04
2020-03
2020-02
2020-01
2019-12
2019-11
2019-10
2019-09
2019-08
2019-07
2019-06
2019-05
2019-04
2019-03
2019-02
2019-01
2018-12
2018-11
2018-10
2018-09
2018-08
pm25
3.7
5.9
6.5
8.5
4.5
7.6
11
6.7
5.7
7
5.4
5
7.4
5.5
11
8.8
7.5
6.7
12
10
5.7
46
* Pollution data source:
https://openaq.org
(AirNow)
The data is licensed under CC-By 4.0
SO2 0 (좋은)
PM2,5 1 (좋은)
O3 0 (좋은)
0 (좋은)
NO2 0 (좋은)
최근 며칠 간의 대기 오염에 대한 데이터 Thompson-Nicola Regional District
| index | 2024-04-09 | 2024-04-10 | 2024-04-11 | 2024-04-12 | 2024-04-13 | 2024-04-14 | 2024-04-15 | 2024-04-16 |
|---|---|---|---|---|---|---|---|---|
| no2 | 0 Good |
0 Good |
0 Good |
0 Good |
0 Good |
0 Good |
0 Good |
0 Good |
| o3 | 0 Good |
0 Good |
0 Good |
0 Good |
0 Good |
0 Good |
0 Good |
0 Good |
| pm25 | 3 Good |
4 Good |
4 Good |
5 Good |
4 Good |
7 Good |
6 Good |
3 Good |
| no | 0 Good |
0 Good |
0 Good |
0 Good |
0 Good |
0 Good |
0 Good |
0 Good |
| so2 | 0 Good |
0 Good |
0 Good |
0 Good |
0 Good |
0 Good |
0 Good |
0 Good |
| index | 2020-05 | 2020-04 | 2020-03 | 2020-02 | 2020-01 | 2019-12 | 2019-11 | 2019-10 | 2019-09 | 2019-08 | 2019-07 | 2019-06 | 2019-05 | 2019-04 | 2019-03 | 2019-02 | 2019-01 | 2018-12 | 2018-11 | 2018-10 | 2018-09 | 2018-08 |
|---|---|---|---|---|---|---|---|---|---|---|---|---|---|---|---|---|---|---|---|---|---|---|
| pm25 | 3.7 (Good) | 5.9 (Good) | 6.5 (Good) | 8.5 (Good) | 4.5 (Good) | 7.6 (Good) | 11 (Good) | 6.7 (Good) | 5.7 (Good) | 7 (Good) | 5.4 (Good) | 5 (Good) | 7.4 (Good) | 5.5 (Good) | 11 (Good) | 8.8 (Good) | 7.5 (Good) | 6.7 (Good) | 12 (Good) | 10 (Good) | 5.7 (Good) | 46 (Unhealthy for Sensitive Groups) |
도시의 녹색 과 공원
Thompson-Nicola Regional District 75%
미국: 70% 베네수엘라: 41% 아이슬란드: 72%미립자 물질 PM2.5
Thompson-Nicola Regional District 8 (Good)
도시에서 시간을 보내는 즐거움
Thompson-Nicola Regional District 75%
미국: 75% 바하마: 53% 베네수엘라: 41% 아이슬란드: 89%미립자 물질 PM10
Thompson-Nicola Regional District 15 (Good)
대기 오염
Thompson-Nicola Regional District 32%
미국: 29% 바하마: 52% 베네수엘라: 59% 아이슬란드: 13%쓰레기 처리
Thompson-Nicola Regional District 75%
미국: 71% 바하마: 29% 베네수엘라: 18% 아이슬란드: 79%식수의 가용성 및 품질
Thompson-Nicola Regional District 80%
미국: 71% 바하마: 55% 베네수엘라: 28% 아이슬란드: 96%청결과 단정함
Thompson-Nicola Regional District 68%
미국: 60% 바하마: 35% 베네수엘라: 22% 아이슬란드: 75%소음 및 빛 공해
Thompson-Nicola Regional District 32%
미국: 47% 바하마: 39% 베네수엘라: 47% 아이슬란드: 23%수질 오염
Thompson-Nicola Regional District 25%
미국: 44% 바하마: 58% 베네수엘라: 76% 아이슬란드: 8.4%SO2 0 (좋은)
이산화황 (SO2)PM2,5 0.9 (좋은)
미세먼지(PM2.5) 먼지O3 0.03 (좋은)
오존 (O3)0 (좋은)
index_name_noNO2 0.01 (좋은)
이산화질소 (NO2)Kamloops Federal Bui
| index | 2024-04-16 | 2024-04-15 | 2024-04-14 | 2024-04-13 | 2024-04-12 | 2024-04-11 | 2024-04-10 | 2024-04-09 |
|---|---|---|---|---|---|---|---|---|
| no2 | 0 | 0.01 | 0.01 | 0.01 | 0.01 | 0.01 | 0.01 | 0.01 |
| o3 | 0.04 | 0.04 | 0.03 | 0.03 | 0.03 | 0.03 | 0.02 | 0.03 |
| pm25 | 2.6 | 6.1 | 6.6 | 4.1 | 5.3 | 4.4 | 4 | 3.2 |
| no | 0 | 0 | 0.01 | 0 | 0 | 0 | 0.01 | 0 |
| so2 | 0 | 0 | 0 | 0 | 0 | 0 | 0 | 0 |
Kamloops Federal Bui

| index | 2020-05 | 2020-04 | 2020-03 | 2020-02 | 2020-01 | 2019-12 | 2019-11 | 2019-10 | 2019-09 | 2019-08 | 2019-07 | 2019-06 | 2019-05 | 2019-04 | 2019-03 | 2019-02 | 2019-01 | 2018-12 | 2018-11 | 2018-10 | 2018-09 | 2018-08 |
|---|---|---|---|---|---|---|---|---|---|---|---|---|---|---|---|---|---|---|---|---|---|---|
| pm25 | 3.7 | 5.9 | 6.5 | 8.5 | 4.5 | 7.6 | 11 | 6.7 | 5.7 | 7 | 5.4 | 5 | 7.4 | 5.5 | 11 | 8.8 | 7.5 | 6.7 | 12 | 10 | 5.7 | 46 |