Regional District of Central Kootenay 대기 오염: 실시간 대기 질 지수 및 스모그 경보.
Regional District of Central Kootenay 대한 오염 및 대기 질 예측. 오늘은 2026년 6월 18일 목요일. 다음과 같은 대기 오염 값이 Regional District of Central Kootenay 기록되었습니다.- 미세먼지(PM2.5) 먼지 - 2 (좋은)
- 이산화질소 (NO2) - 0 (좋은)
- 이산화황 (SO2) - 0 (좋은)
- 미세먼지(PM10) 미세먼지 - 7 (좋은)
- 오존 (O3) - 0 (좋은)

오늘날 Regional District of Central Kootenay 공기 질은 무엇입니까? 공기는 Regional District of Central Kootenay 오염되어 있습니까?. 스모그가 있습니까?
Regional District of Central Kootenay PM2.5의 현재 수준은 무엇입니까? (미세먼지(PM2.5) 먼지)
오늘의 PM2.5 수준은 다음과 같은 것입니다.
2 (좋은)
비교를 위해, 지난 7 일 Regional District of Central Kootenay PM2.5의 가장 높은 수준은: 9 (2024년 4월 13일 토요일) 가장 낮은: 3 (2024년 4월 9일 화요일).
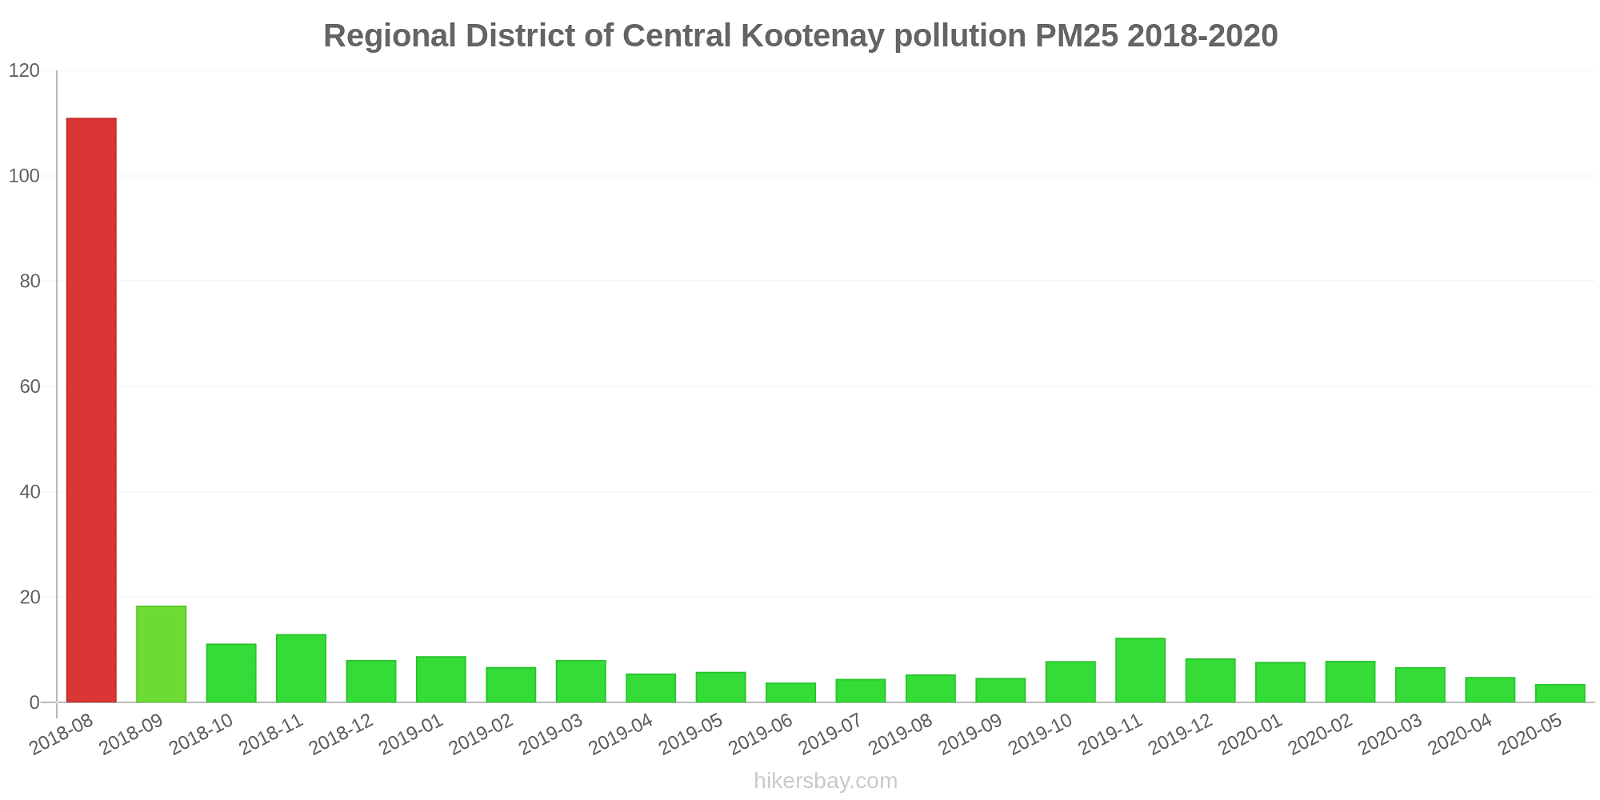
가장 높은 PM2.5 값이 기록되었습니다: 111 (2018년 8월).
미세먼지 의 최저 수준 PM2.5 오염은 월에서 발생합니다: 5월 (3.5).
NO2 수준은 얼마나 높습니까? (이산화질소 (NO2))
0 (좋은)
SO2 오염 수준은 어떻습니까? (이산화황 (SO2))
0 (좋은)
Regional District of Central Kootenay PM10의 수준은 무엇입니까? (미세먼지(PM10) 미세먼지)
Regional District of Central Kootenay 의 현재 수준의 미립자 물질 PM10:
7 (좋은)
오늘날 O3 수준은 Regional District of Central Kootenay? (오존 (O3))
0 (좋은)
현재 데이터 2024년 4월 16일 화요일 오전 10:00
PM2,5 2 (좋은)
NO2 0 (좋은)
SO2 0 (좋은)
PM10 7 (좋은)
0 (좋은)
O3 0 (좋은)
최근 며칠 간의 대기 오염에 대한 데이터 Regional District of Central Kootenay
index
2024-04-09
2024-04-10
2024-04-11
2024-04-12
2024-04-13
2024-04-14
2024-04-15
2024-04-16
no2
0
Good
0
Good
0
Good
0
Good
0
Good
0
Good
0
Good
0
Good
pm10
5
Good
14
Good
11
Good
9
Good
16
Good
18
Good
20
Moderate
9
Good
no
0
Good
0
Good
0
Good
0
Good
0
Good
0
Good
0
Good
0
Good
so2
0
Good
0
Good
0
Good
0
Good
0
Good
0
Good
0
Good
0
Good
pm25
3
Good
6
Good
4
Good
5
Good
9
Good
8
Good
8
Good
3
Good
o3
0
Good
0
Good
0
Good
0
Good
0
Good
0
Good
0
Good
0
Good
data source »
Regional District of Central Kootenay 에서 2018년 8월 2020년 5월
index
2020-05
2020-04
2020-03
2020-02
2020-01
2019-12
2019-11
2019-10
2019-09
2019-08
2019-07
2019-06
2019-05
2019-04
2019-03
2019-02
2019-01
2018-12
2018-11
2018-10
2018-09
2018-08
pm25
3.5 (Good)
4.8 (Good)
6.7 (Good)
7.9 (Good)
7.7 (Good)
8.4 (Good)
12 (Good)
7.9 (Good)
4.7 (Good)
5.3 (Good)
4.5 (Good)
3.8 (Good)
5.8 (Good)
5.5 (Good)
8.1 (Good)
6.8 (Good)
8.8 (Good)
8.1 (Good)
13 (Moderate)
11 (Good)
18 (Moderate)
111 (Very bad Hazardous)
data source »
삶의 질 Regional District of Central Kootenay
도시의 녹색 과 공원
Regional District of Central Kootenay
96%
미국: 70%
베네수엘라: 41%
아이슬란드: 72%
미립자 물질 PM2.5
Regional District of Central Kootenay
7 (Good)
도시에서 시간을 보내는 즐거움
Regional District of Central Kootenay
95%
미국: 75%
바하마: 53%
베네수엘라: 41%
아이슬란드: 89%
미립자 물질 PM10
Regional District of Central Kootenay
13 (Good)
대기 오염
Regional District of Central Kootenay
11%
미국: 29%
바하마: 52%
베네수엘라: 59%
아이슬란드: 13%
쓰레기 처리
Regional District of Central Kootenay
71%
미국: 71%
바하마: 29%
베네수엘라: 18%
아이슬란드: 79%
식수의 가용성 및 품질
Regional District of Central Kootenay
88%
미국: 71%
바하마: 55%
베네수엘라: 28%
아이슬란드: 96%
청결과 단정함
Regional District of Central Kootenay
79%
미국: 60%
바하마: 35%
베네수엘라: 22%
아이슬란드: 75%
소음 및 빛 공해
Regional District of Central Kootenay
29%
미국: 47%
바하마: 39%
베네수엘라: 47%
아이슬란드: 23%
수질 오염
Regional District of Central Kootenay
8.3%
미국: 44%
바하마: 58%
베네수엘라: 76%
아이슬란드: 8.4%
Source: Numbeo
Castlegar Zinio Park
2024년 4월 16일 화요일 오전 10:00
PM2,5 1.6 (좋은)
미세먼지(PM2.5) 먼지
NO2 0 (좋은)
이산화질소 (NO2)
SO2 0 (좋은)
이산화황 (SO2)
PM10 7 (좋은)
미세먼지(PM10) 미세먼지
0 (좋은)
index_name_no
O3 0.04 (좋은)
오존 (O3)
Castlegar Zinio Park
index
2024-04-16
2024-04-15
2024-04-14
2024-04-13
2024-04-12
2024-04-11
2024-04-10
2024-04-09
no2
0
0.01
0.01
0.01
0.01
0
0.01
0
pm10
8.5
20
18
16
9
11
14
5.1
no
0
0
0
0
0
0
0
0
so2
0
0
0
0
0
0
0
0
pm25
2.5
8.2
8
9.1
5.2
4.3
5.5
3
o3
0.05
0.02
0.02
0.01
0.03
0.03
0.03
0.03
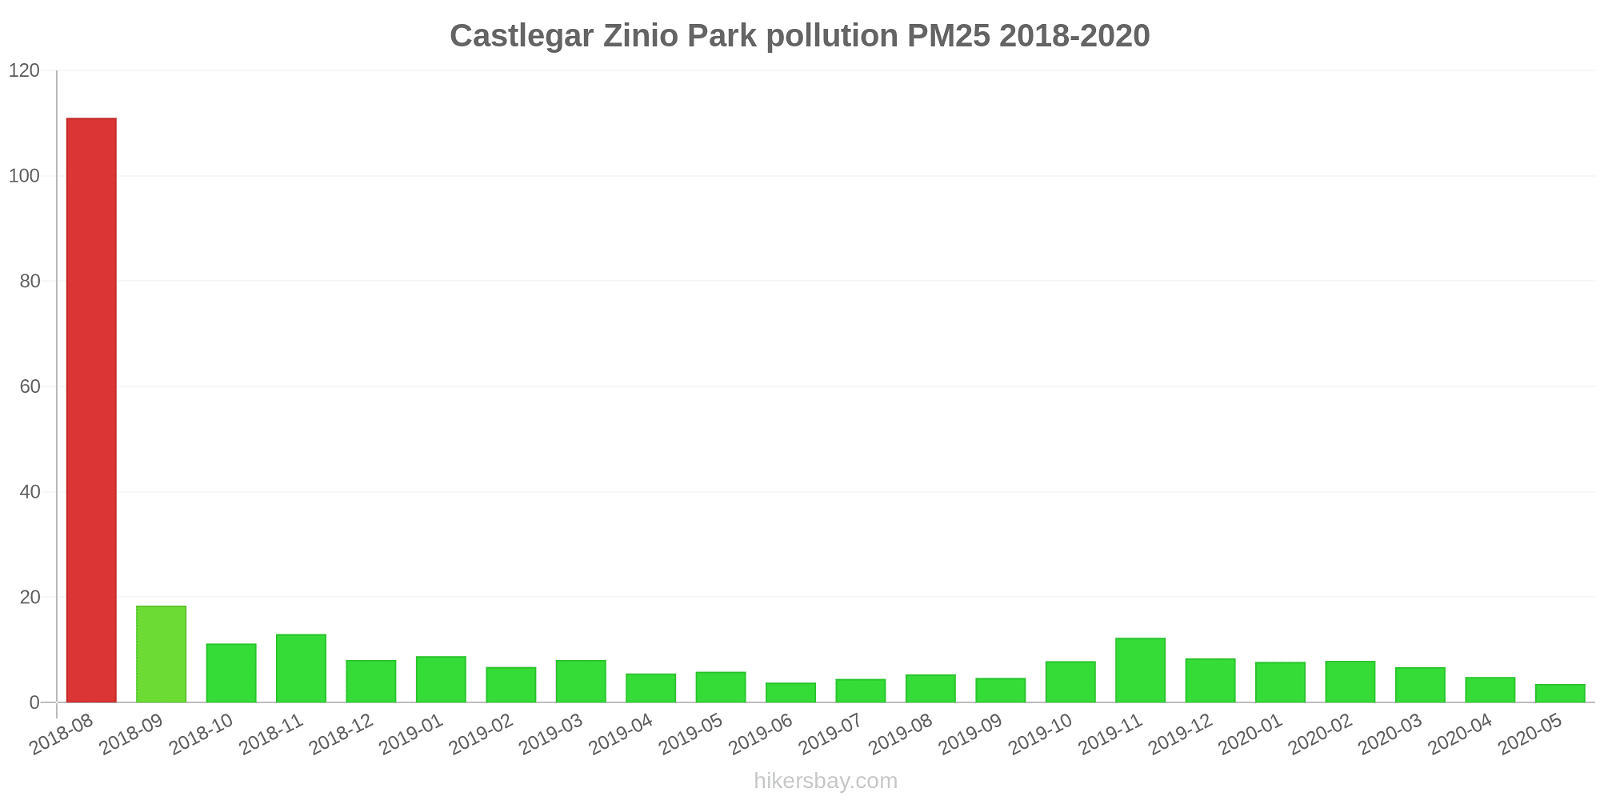
Castlegar Zinio Park
2018-08 2020-05
index
2020-05
2020-04
2020-03
2020-02
2020-01
2019-12
2019-11
2019-10
2019-09
2019-08
2019-07
2019-06
2019-05
2019-04
2019-03
2019-02
2019-01
2018-12
2018-11
2018-10
2018-09
2018-08
pm25
3.5
4.8
6.7
7.9
7.7
8.4
12
7.9
4.7
5.3
4.5
3.8
5.8
5.5
8.1
6.8
8.8
8.1
13
11
18
111
* Pollution data source:
https://openaq.org
(AirNow)
The data is licensed under CC-By 4.0
PM2,5 2 (좋은)
NO2 0 (좋은)
SO2 0 (좋은)
PM10 7 (좋은)
0 (좋은)
O3 0 (좋은)
최근 며칠 간의 대기 오염에 대한 데이터 Regional District of Central Kootenay
| index | 2024-04-09 | 2024-04-10 | 2024-04-11 | 2024-04-12 | 2024-04-13 | 2024-04-14 | 2024-04-15 | 2024-04-16 |
|---|---|---|---|---|---|---|---|---|
| no2 | 0 Good |
0 Good |
0 Good |
0 Good |
0 Good |
0 Good |
0 Good |
0 Good |
| pm10 | 5 Good |
14 Good |
11 Good |
9 Good |
16 Good |
18 Good |
20 Moderate |
9 Good |
| no | 0 Good |
0 Good |
0 Good |
0 Good |
0 Good |
0 Good |
0 Good |
0 Good |
| so2 | 0 Good |
0 Good |
0 Good |
0 Good |
0 Good |
0 Good |
0 Good |
0 Good |
| pm25 | 3 Good |
6 Good |
4 Good |
5 Good |
9 Good |
8 Good |
8 Good |
3 Good |
| o3 | 0 Good |
0 Good |
0 Good |
0 Good |
0 Good |
0 Good |
0 Good |
0 Good |

| index | 2020-05 | 2020-04 | 2020-03 | 2020-02 | 2020-01 | 2019-12 | 2019-11 | 2019-10 | 2019-09 | 2019-08 | 2019-07 | 2019-06 | 2019-05 | 2019-04 | 2019-03 | 2019-02 | 2019-01 | 2018-12 | 2018-11 | 2018-10 | 2018-09 | 2018-08 |
|---|---|---|---|---|---|---|---|---|---|---|---|---|---|---|---|---|---|---|---|---|---|---|
| pm25 | 3.5 (Good) | 4.8 (Good) | 6.7 (Good) | 7.9 (Good) | 7.7 (Good) | 8.4 (Good) | 12 (Good) | 7.9 (Good) | 4.7 (Good) | 5.3 (Good) | 4.5 (Good) | 3.8 (Good) | 5.8 (Good) | 5.5 (Good) | 8.1 (Good) | 6.8 (Good) | 8.8 (Good) | 8.1 (Good) | 13 (Moderate) | 11 (Good) | 18 (Moderate) | 111 (Very bad Hazardous) |
도시의 녹색 과 공원
Regional District of Central Kootenay 96%
미국: 70% 베네수엘라: 41% 아이슬란드: 72%미립자 물질 PM2.5
Regional District of Central Kootenay 7 (Good)
도시에서 시간을 보내는 즐거움
Regional District of Central Kootenay 95%
미국: 75% 바하마: 53% 베네수엘라: 41% 아이슬란드: 89%미립자 물질 PM10
Regional District of Central Kootenay 13 (Good)
대기 오염
Regional District of Central Kootenay 11%
미국: 29% 바하마: 52% 베네수엘라: 59% 아이슬란드: 13%쓰레기 처리
Regional District of Central Kootenay 71%
미국: 71% 바하마: 29% 베네수엘라: 18% 아이슬란드: 79%식수의 가용성 및 품질
Regional District of Central Kootenay 88%
미국: 71% 바하마: 55% 베네수엘라: 28% 아이슬란드: 96%청결과 단정함
Regional District of Central Kootenay 79%
미국: 60% 바하마: 35% 베네수엘라: 22% 아이슬란드: 75%소음 및 빛 공해
Regional District of Central Kootenay 29%
미국: 47% 바하마: 39% 베네수엘라: 47% 아이슬란드: 23%수질 오염
Regional District of Central Kootenay 8.3%
미국: 44% 바하마: 58% 베네수엘라: 76% 아이슬란드: 8.4%PM2,5 1.6 (좋은)
미세먼지(PM2.5) 먼지NO2 0 (좋은)
이산화질소 (NO2)SO2 0 (좋은)
이산화황 (SO2)PM10 7 (좋은)
미세먼지(PM10) 미세먼지0 (좋은)
index_name_noO3 0.04 (좋은)
오존 (O3)Castlegar Zinio Park
| index | 2024-04-16 | 2024-04-15 | 2024-04-14 | 2024-04-13 | 2024-04-12 | 2024-04-11 | 2024-04-10 | 2024-04-09 |
|---|---|---|---|---|---|---|---|---|
| no2 | 0 | 0.01 | 0.01 | 0.01 | 0.01 | 0 | 0.01 | 0 |
| pm10 | 8.5 | 20 | 18 | 16 | 9 | 11 | 14 | 5.1 |
| no | 0 | 0 | 0 | 0 | 0 | 0 | 0 | 0 |
| so2 | 0 | 0 | 0 | 0 | 0 | 0 | 0 | 0 |
| pm25 | 2.5 | 8.2 | 8 | 9.1 | 5.2 | 4.3 | 5.5 | 3 |
| o3 | 0.05 | 0.02 | 0.02 | 0.01 | 0.03 | 0.03 | 0.03 | 0.03 |
Castlegar Zinio Park
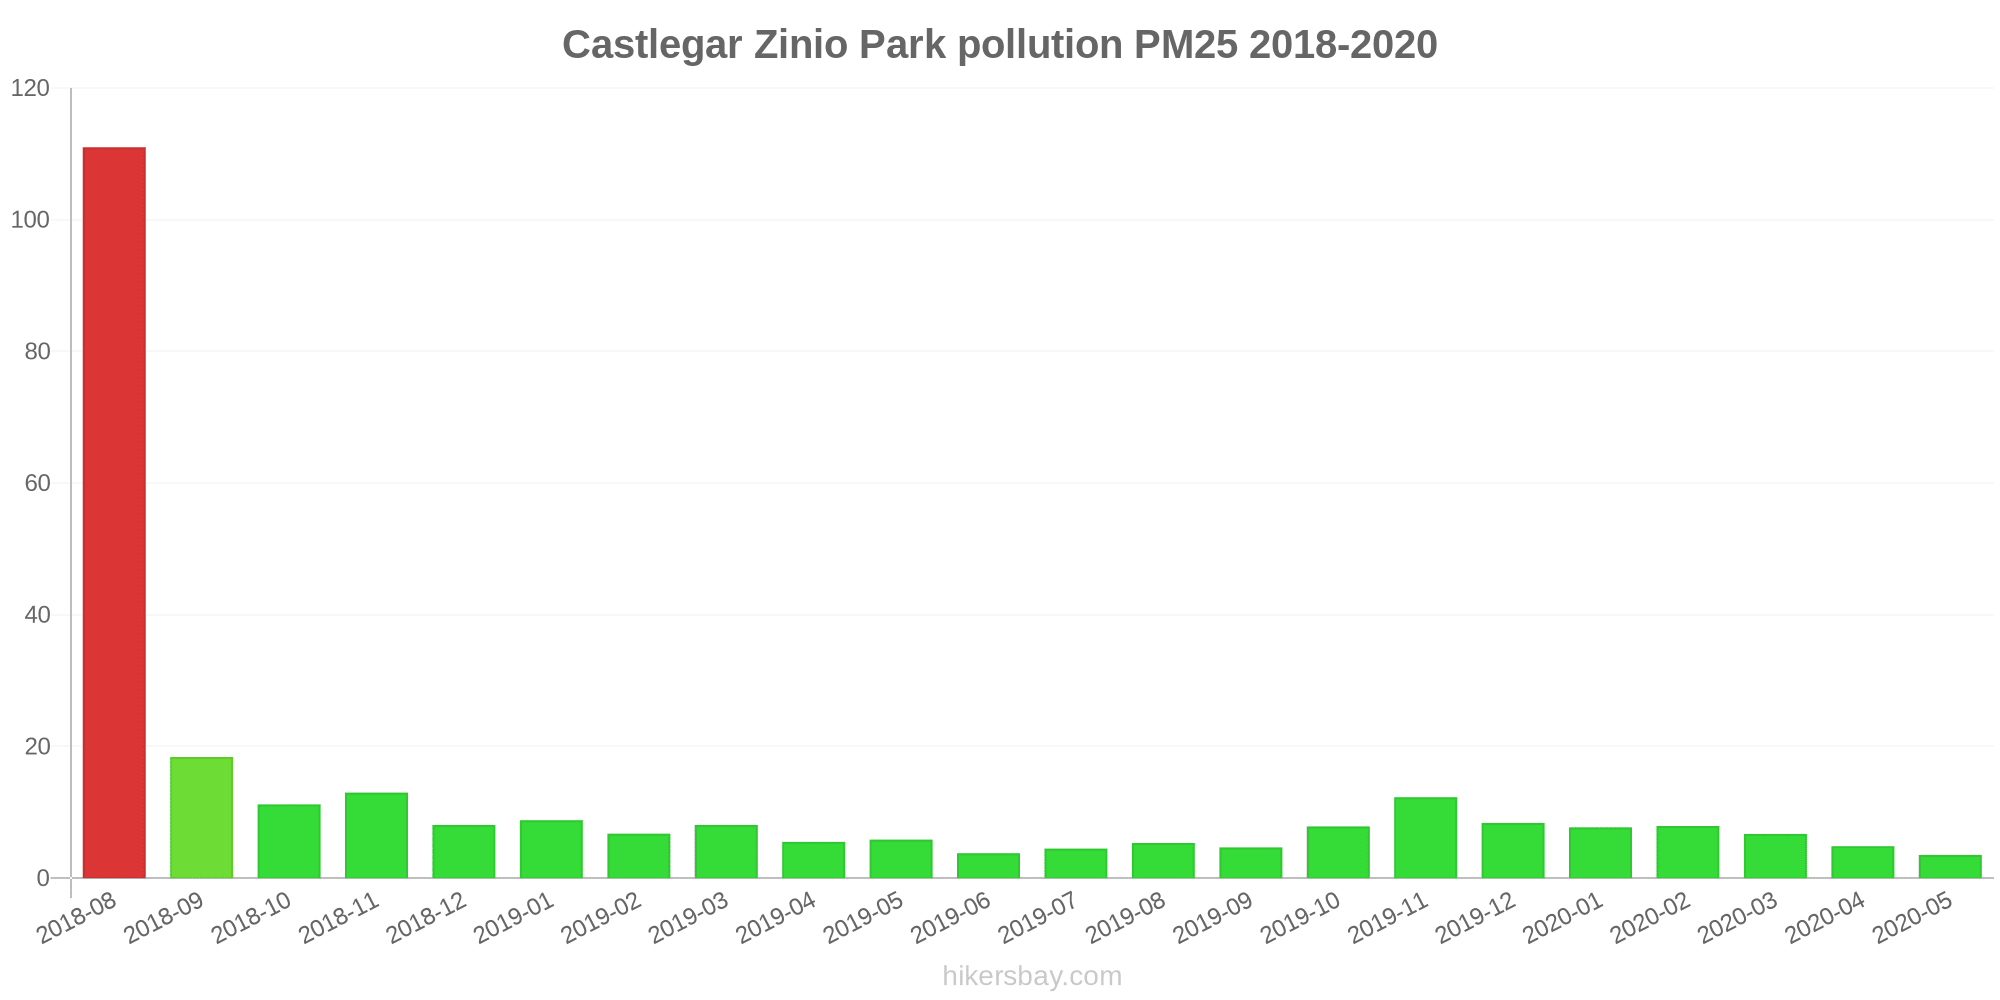
| index | 2020-05 | 2020-04 | 2020-03 | 2020-02 | 2020-01 | 2019-12 | 2019-11 | 2019-10 | 2019-09 | 2019-08 | 2019-07 | 2019-06 | 2019-05 | 2019-04 | 2019-03 | 2019-02 | 2019-01 | 2018-12 | 2018-11 | 2018-10 | 2018-09 | 2018-08 |
|---|---|---|---|---|---|---|---|---|---|---|---|---|---|---|---|---|---|---|---|---|---|---|
| pm25 | 3.5 | 4.8 | 6.7 | 7.9 | 7.7 | 8.4 | 12 | 7.9 | 4.7 | 5.3 | 4.5 | 3.8 | 5.8 | 5.5 | 8.1 | 6.8 | 8.8 | 8.1 | 13 | 11 | 18 | 111 |