Donggang District の大気汚染:リアルタイムの大気質指数とスモッグ警報。
Donggang District の汚染と大気質予測。 今日は 2026年6月16日火曜日 です。 Donggang District では、次の大気汚染値が記録されています。- 粒子状物質(PM10)浮遊粉塵 - 179 (非常に悪い危険)
- 粒子状物質(PM2.5)粉塵 - 35 (デリケートなグループの異常)
- オゾン(O3) - 0 (よし)
- 二酸化窒素 (NO2) - 0 (よし)
- 二酸化硫黄 (SO2) - 0 (よし)

今日の Donggang District の空気の質は何ですか? Donggang District で大気汚染が起きているのか?スモッグはありますか?
Donggang District の今日のPM10のレベルは何ですか? (粒子状物質(PM10)浮遊粉塵)
Donggang District の粒子状物質PM10の現在のレベルは次のとおりです。
179 (非常に悪い危険)
PM10 の最大値は、通常、月: 139 (2019年1月) に発生します。
Donggang District 中の粒子状物質PM10汚染の最低値は、通常、 8月 (44) に記録される。
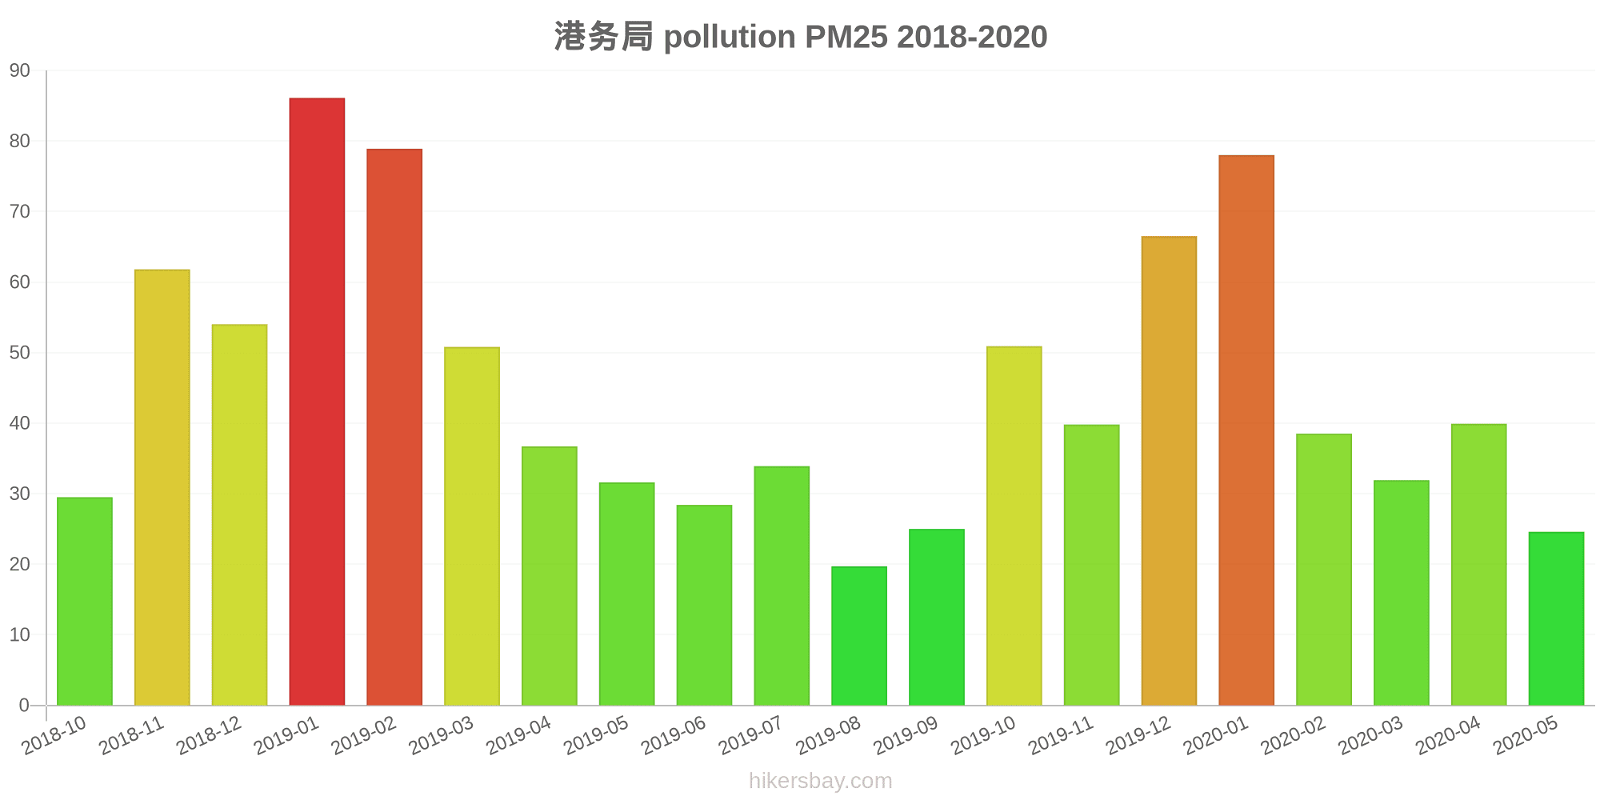
Donggang District のPM2.5の現在のレベルは何ですか? (粒子状物質(PM2.5)粉塵)
今日のPM2.5レベルは次のとおりです。
35 (デリケートなグループの異常)
比較のために、 Donggang District 過去7日間のPM2.5の最高レベルは、 56 (2022年5月27日金曜日) と最低: 56 (2022年5月27日金曜日) でした。
最高のPM2.5値が記録されました: 86 (2019年1月) 。
粒子状物質PM2.5汚染の最も低いレベルは月に起こる: 8月 (20) 。
今日のO3レベルは Donggang District でどうですか? (オゾン(O3))
0 (よし)
NO2のレベルはどのくらい高いですか? (二酸化窒素 (NO2))
0 (よし)
SO2汚染のレベルは? (二酸化硫黄 (SO2))
0 (よし)
現在のデータ 2022年5月27日金曜日 12:00
PM10 179 (非常に悪い危険)
PM2,5 35 (デリケートなグループの異常)
O3 0 (よし)
NO2 0 (よし)
SO2 0 (よし)
最近の大気汚染に関するデータ Donggang District
index
2022-05-27
pm10
56
Unhealthy for Sensitive Groups
pm25
56
Unhealthy
o3
0
Good
no2
0
Good
so2
0
Good
data source »
Donggang District 2018年10月 から 2020年5月 までの大気汚染

index
2020-05
2020-04
2020-03
2020-02
2020-01
2019-12
2019-11
2019-10
2019-09
2019-08
2019-07
2019-06
2019-05
2019-04
2019-03
2019-02
2019-01
2018-12
2018-11
2018-10
pm25
25 (Moderate)
40 (Unhealthy for Sensitive Groups)
32 (Moderate)
39 (Unhealthy for Sensitive Groups)
78 (Very Unhealthy)
67 (Unhealthy)
40 (Unhealthy for Sensitive Groups)
51 (Unhealthy for Sensitive Groups)
25 (Moderate)
20 (Moderate)
34 (Moderate)
28 (Moderate)
32 (Moderate)
37 (Unhealthy for Sensitive Groups)
51 (Unhealthy for Sensitive Groups)
79 (Very Unhealthy)
86 (Very Unhealthy)
54 (Unhealthy for Sensitive Groups)
62 (Unhealthy)
30 (Moderate)
co
435 (Good)
585 (Good)
584 (Good)
621 (Good)
880 (Good)
802 (Good)
437 (Good)
593 (Good)
458 (Good)
418 (Good)
481 (Good)
359 (Good)
437 (Good)
443 (Good)
512 (Good)
913 (Good)
1 (Good)
752 (Good)
648 (Good)
497 (Good)
no2
21 (Good)
39 (Good)
33 (Good)
23 (Good)
33 (Good)
42 (Moderate)
35 (Good)
41 (Moderate)
24 (Good)
21 (Good)
25 (Good)
20 (Good)
29 (Good)
29 (Good)
47 (Moderate)
45 (Moderate)
55 (Moderate)
37 (Good)
45 (Moderate)
39 (Good)
o3
125 (Unhealthy for Sensitive Groups)
137 (Unhealthy for Sensitive Groups)
114 (Moderate)
94 (Moderate)
87 (Moderate)
70 (Good)
93 (Moderate)
127 (Unhealthy for Sensitive Groups)
170 (Unhealthy)
138 (Unhealthy for Sensitive Groups)
157 (Unhealthy)
158 (Unhealthy)
160 (Unhealthy)
121 (Unhealthy for Sensitive Groups)
108 (Moderate)
96 (Moderate)
71 (Moderate)
67 (Good)
100 (Moderate)
107 (Moderate)
pm10
53 (Unhealthy for Sensitive Groups)
89 (Unhealthy)
86 (Unhealthy)
62 (Unhealthy for Sensitive Groups)
106 (Unhealthy)
103 (Unhealthy)
96 (Unhealthy)
111 (Very Unhealthy)
55 (Unhealthy for Sensitive Groups)
44 (Moderate)
71 (Unhealthy for Sensitive Groups)
60 (Unhealthy for Sensitive Groups)
87 (Unhealthy)
84 (Unhealthy)
107 (Unhealthy)
120 (Very Unhealthy)
139 (Very Unhealthy)
101 (Unhealthy)
120 (Very Unhealthy)
76 (Unhealthy for Sensitive Groups)
so2
6.4 (Good)
6.8 (Good)
6.8 (Good)
6.2 (Good)
11 (Good)
8 (Good)
6.9 (Good)
8 (Good)
4.5 (Good)
4.5 (Good)
5.2 (Good)
5.8 (Good)
8 (Good)
6 (Good)
9.9 (Good)
10 (Good)
14 (Good)
8.6 (Good)
7.1 (Good)
8.4 (Good)
data source »
港务局
2022年5月27日金曜日 12:00
PM10 179 (非常に悪い危険)
粒子状物質(PM10)浮遊粉塵
PM2,5 35 (デリケートなグループの異常)
粒子状物質(PM2.5)粉塵
O3 0.04 (よし)
オゾン(O3)
NO2 0 (よし)
二酸化窒素 (NO2)
SO2 0 (よし)
二酸化硫黄 (SO2)
港务局
index
2022-05-27
pm10
56
pm25
56
o3
0.03
no2
0
so2
0
港务局
2018-10 2020-05
index
2020-05
2020-04
2020-03
2020-02
2020-01
2019-12
2019-11
2019-10
2019-09
2019-08
2019-07
2019-06
2019-05
2019-04
2019-03
2019-02
2019-01
2018-12
2018-11
2018-10
pm25
25
40
32
39
78
67
40
51
25
20
34
28
32
37
51
79
86
54
62
30
co
435
585
584
621
880
802
437
593
458
418
481
359
437
443
512
913
1
752
648
497
no2
21
39
33
23
33
42
35
41
24
21
25
20
29
29
47
45
55
37
45
39
o3
125
137
114
94
87
70
93
127
170
138
157
158
160
121
108
96
71
67
100
107
pm10
53
89
86
62
106
103
96
111
55
44
71
60
87
84
107
120
139
101
120
76
so2
6.4
6.8
6.8
6.2
11
8
6.9
8
4.5
4.5
5.2
5.8
8
6
9.9
10
14
8.6
7.1
8.4
* Pollution data source:
https://openaq.org
(ChinaAQIData)
The data is licensed under CC-By 4.0
PM10 179 (非常に悪い危険)
PM2,5 35 (デリケートなグループの異常)
O3 0 (よし)
NO2 0 (よし)
SO2 0 (よし)
最近の大気汚染に関するデータ Donggang District
| index | 2022-05-27 |
|---|---|
| pm10 | 56 Unhealthy for Sensitive Groups |
| pm25 | 56 Unhealthy |
| o3 | 0 Good |
| no2 | 0 Good |
| so2 | 0 Good |

| index | 2020-05 | 2020-04 | 2020-03 | 2020-02 | 2020-01 | 2019-12 | 2019-11 | 2019-10 | 2019-09 | 2019-08 | 2019-07 | 2019-06 | 2019-05 | 2019-04 | 2019-03 | 2019-02 | 2019-01 | 2018-12 | 2018-11 | 2018-10 |
|---|---|---|---|---|---|---|---|---|---|---|---|---|---|---|---|---|---|---|---|---|
| pm25 | 25 (Moderate) | 40 (Unhealthy for Sensitive Groups) | 32 (Moderate) | 39 (Unhealthy for Sensitive Groups) | 78 (Very Unhealthy) | 67 (Unhealthy) | 40 (Unhealthy for Sensitive Groups) | 51 (Unhealthy for Sensitive Groups) | 25 (Moderate) | 20 (Moderate) | 34 (Moderate) | 28 (Moderate) | 32 (Moderate) | 37 (Unhealthy for Sensitive Groups) | 51 (Unhealthy for Sensitive Groups) | 79 (Very Unhealthy) | 86 (Very Unhealthy) | 54 (Unhealthy for Sensitive Groups) | 62 (Unhealthy) | 30 (Moderate) |
| co | 435 (Good) | 585 (Good) | 584 (Good) | 621 (Good) | 880 (Good) | 802 (Good) | 437 (Good) | 593 (Good) | 458 (Good) | 418 (Good) | 481 (Good) | 359 (Good) | 437 (Good) | 443 (Good) | 512 (Good) | 913 (Good) | 1 (Good) | 752 (Good) | 648 (Good) | 497 (Good) |
| no2 | 21 (Good) | 39 (Good) | 33 (Good) | 23 (Good) | 33 (Good) | 42 (Moderate) | 35 (Good) | 41 (Moderate) | 24 (Good) | 21 (Good) | 25 (Good) | 20 (Good) | 29 (Good) | 29 (Good) | 47 (Moderate) | 45 (Moderate) | 55 (Moderate) | 37 (Good) | 45 (Moderate) | 39 (Good) |
| o3 | 125 (Unhealthy for Sensitive Groups) | 137 (Unhealthy for Sensitive Groups) | 114 (Moderate) | 94 (Moderate) | 87 (Moderate) | 70 (Good) | 93 (Moderate) | 127 (Unhealthy for Sensitive Groups) | 170 (Unhealthy) | 138 (Unhealthy for Sensitive Groups) | 157 (Unhealthy) | 158 (Unhealthy) | 160 (Unhealthy) | 121 (Unhealthy for Sensitive Groups) | 108 (Moderate) | 96 (Moderate) | 71 (Moderate) | 67 (Good) | 100 (Moderate) | 107 (Moderate) |
| pm10 | 53 (Unhealthy for Sensitive Groups) | 89 (Unhealthy) | 86 (Unhealthy) | 62 (Unhealthy for Sensitive Groups) | 106 (Unhealthy) | 103 (Unhealthy) | 96 (Unhealthy) | 111 (Very Unhealthy) | 55 (Unhealthy for Sensitive Groups) | 44 (Moderate) | 71 (Unhealthy for Sensitive Groups) | 60 (Unhealthy for Sensitive Groups) | 87 (Unhealthy) | 84 (Unhealthy) | 107 (Unhealthy) | 120 (Very Unhealthy) | 139 (Very Unhealthy) | 101 (Unhealthy) | 120 (Very Unhealthy) | 76 (Unhealthy for Sensitive Groups) |
| so2 | 6.4 (Good) | 6.8 (Good) | 6.8 (Good) | 6.2 (Good) | 11 (Good) | 8 (Good) | 6.9 (Good) | 8 (Good) | 4.5 (Good) | 4.5 (Good) | 5.2 (Good) | 5.8 (Good) | 8 (Good) | 6 (Good) | 9.9 (Good) | 10 (Good) | 14 (Good) | 8.6 (Good) | 7.1 (Good) | 8.4 (Good) |
PM10 179 (非常に悪い危険)
粒子状物質(PM10)浮遊粉塵PM2,5 35 (デリケートなグループの異常)
粒子状物質(PM2.5)粉塵O3 0.04 (よし)
オゾン(O3)NO2 0 (よし)
二酸化窒素 (NO2)SO2 0 (よし)
二酸化硫黄 (SO2)港务局
| index | 2022-05-27 |
|---|---|
| pm10 | 56 |
| pm25 | 56 |
| o3 | 0.03 |
| no2 | 0 |
| so2 | 0 |
港务局

| index | 2020-05 | 2020-04 | 2020-03 | 2020-02 | 2020-01 | 2019-12 | 2019-11 | 2019-10 | 2019-09 | 2019-08 | 2019-07 | 2019-06 | 2019-05 | 2019-04 | 2019-03 | 2019-02 | 2019-01 | 2018-12 | 2018-11 | 2018-10 |
|---|---|---|---|---|---|---|---|---|---|---|---|---|---|---|---|---|---|---|---|---|
| pm25 | 25 | 40 | 32 | 39 | 78 | 67 | 40 | 51 | 25 | 20 | 34 | 28 | 32 | 37 | 51 | 79 | 86 | 54 | 62 | 30 |
| co | 435 | 585 | 584 | 621 | 880 | 802 | 437 | 593 | 458 | 418 | 481 | 359 | 437 | 443 | 512 | 913 | 1 | 752 | 648 | 497 |
| no2 | 21 | 39 | 33 | 23 | 33 | 42 | 35 | 41 | 24 | 21 | 25 | 20 | 29 | 29 | 47 | 45 | 55 | 37 | 45 | 39 |
| o3 | 125 | 137 | 114 | 94 | 87 | 70 | 93 | 127 | 170 | 138 | 157 | 158 | 160 | 121 | 108 | 96 | 71 | 67 | 100 | 107 |
| pm10 | 53 | 89 | 86 | 62 | 106 | 103 | 96 | 111 | 55 | 44 | 71 | 60 | 87 | 84 | 107 | 120 | 139 | 101 | 120 | 76 |
| so2 | 6.4 | 6.8 | 6.8 | 6.2 | 11 | 8 | 6.9 | 8 | 4.5 | 4.5 | 5.2 | 5.8 | 8 | 6 | 9.9 | 10 | 14 | 8.6 | 7.1 | 8.4 |