Inquinamento atmosferico in Premnagar: indice di qualità dell'aria in tempo reale e allarme smog.
Previsioni di inquinamento e qualità dell'aria per Premnagar. Oggi è mercoledì 13 maggio 2026. Per Premnagar sono stati registrati i seguenti valori di inquinamento atmosferico:- monossido di carbonio (CO) - 1390 (Buono)
- ozono (O3) - 0 (Buono)
- polvere di particolato (PM2.5) - 148 (Molto male Pericoloso)
- polveri sospese di particolato (PM10) - 235 (Molto male Pericoloso)
- biossido di azoto (NO2) - 24 (Buono)

Qual è la qualità dell'aria Premnagar oggi? L'aria è inquinata Premnagar? C'è smog?
Quanto è alto il livello di CO? (monossido di carbonio (CO))
1390 (Buono)
Come è il livello O3 oggi in Premnagar? (ozono (O3))
0 (Buono)
Qual è il livello attuale di PM2.5 in Premnagar? (polvere di particolato (PM2.5))
Il livello PM2.5 di oggi è:
148 (Molto male Pericoloso)
Per fare un confronto, il livello più alto di PM2,5 in Premnagar negli ultimi 7 giorni è stato: 161 (lunedì 31 ottobre 2022) e il più basso: 161 (lunedì 31 ottobre 2022).
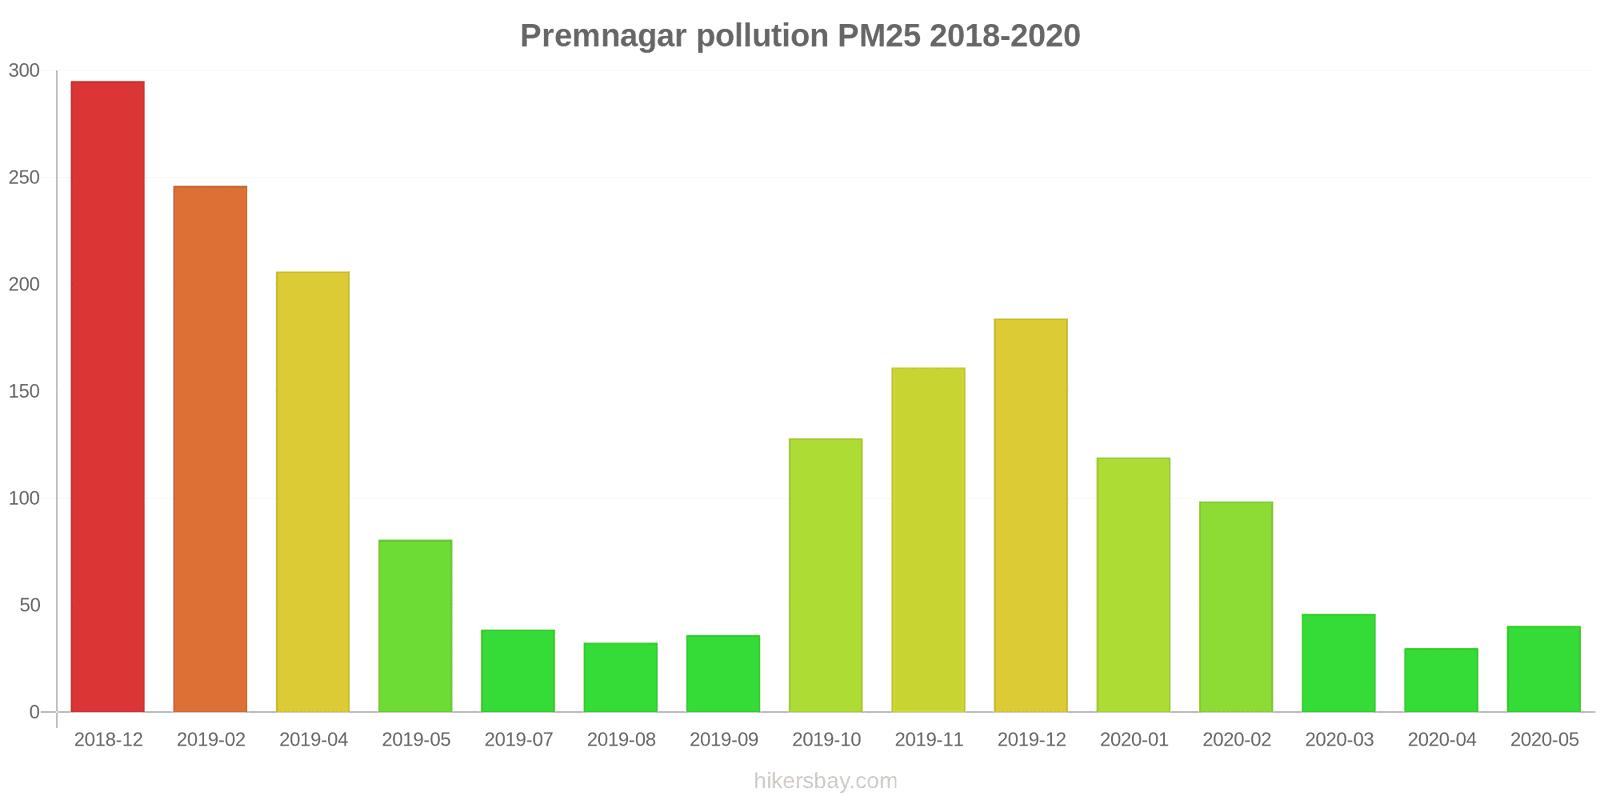
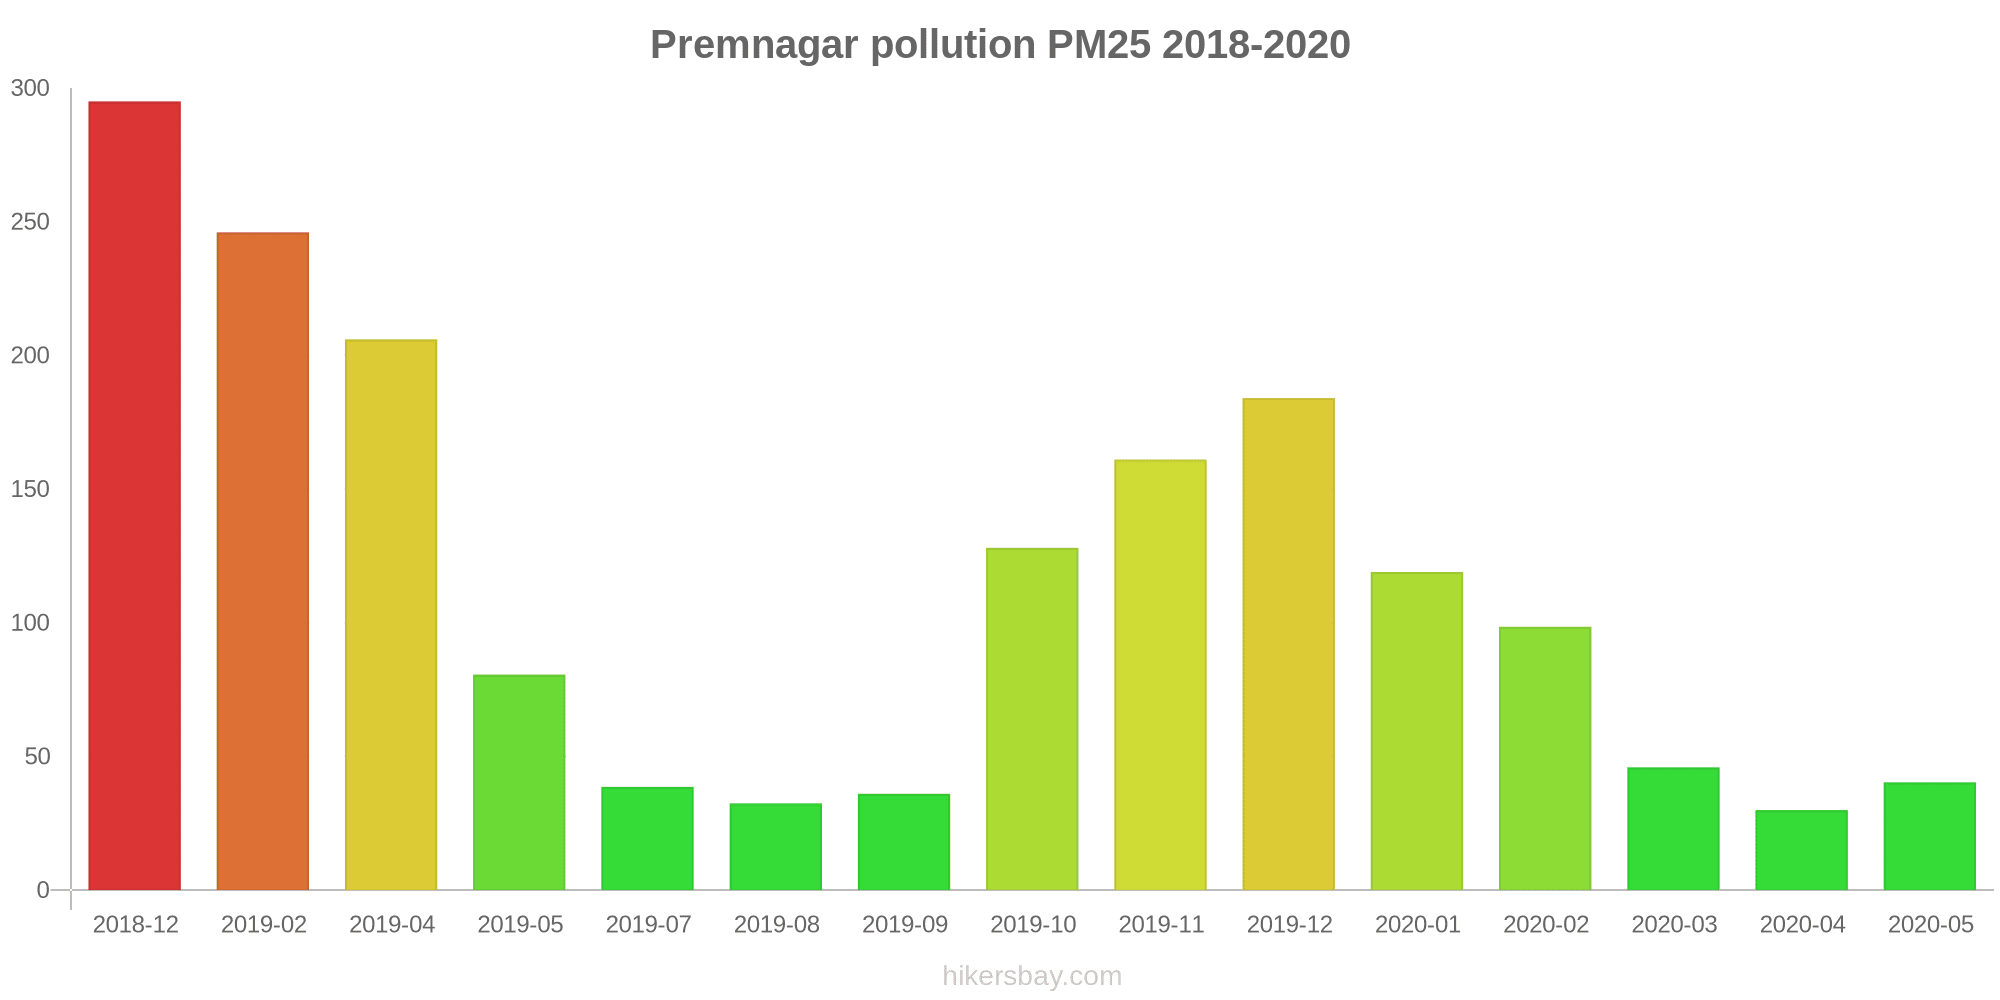
Sono stati registrati i valori PM2,5 più alti: 295 (dicembre 2018).
Il più basso livello di inquinamento da particolato PM2.5 si verifica nel mese: aprile (30).
Qual è il livello di PM10 oggi in Premnagar? (polveri sospese di particolato (PM10))
L'attuale livello di particolato PM10 in Premnagar è:
235 (Molto male Pericoloso)
I valori PM10 più alti si verificano in genere nel mese: 655 (dicembre 2018).
Il valore più basso dell'inquinamento da particolato PM10 in Premnagar è di solito registrato in: agosto (73).
Quanto è alto il livello di NO2? (biossido di azoto (NO2))
24 (Buono)
Dati correnti lunedì 31 ottobre 2022, 02:00
CO 1390 (Buono)
O3 0 (Buono)
PM2,5 148 (Molto male Pericoloso)
PM10 235 (Molto male Pericoloso)
NO2 24 (Buono)
Dati sull'inquinamento atmosferico degli ultimi giorni Premnagar
index
2022-10-31
co
1615
Good
o3
0
Good
pm25
161
Very bad Hazardous
pm10
253
Very bad Hazardous
no2
23
Good
data source »
Inquinamento atmosferico in Premnagar da dicembre 2018 a maggio 2020
index
2020-05
2020-04
2020-03
2020-02
2020-01
2019-12
2019-11
2019-10
2019-09
2019-08
2019-07
2019-05
2019-04
2019-02
2018-12
pm25
40 (Unhealthy for Sensitive Groups)
30 (Moderate)
46 (Unhealthy for Sensitive Groups)
99 (Very Unhealthy)
119 (Very bad Hazardous)
184 (Very bad Hazardous)
161 (Very bad Hazardous)
128 (Very bad Hazardous)
36 (Unhealthy for Sensitive Groups)
32 (Moderate)
39 (Unhealthy for Sensitive Groups)
81 (Very Unhealthy)
206 (Very bad Hazardous)
246 (Very bad Hazardous)
295 (Very bad Hazardous)
pm10
100 (Unhealthy)
91 (Unhealthy)
102 (Unhealthy)
195 (Very bad Hazardous)
203 (Very bad Hazardous)
297 (Very bad Hazardous)
250 (Very bad Hazardous)
225 (Very bad Hazardous)
88 (Unhealthy)
73 (Unhealthy for Sensitive Groups)
124 (Very Unhealthy)
280 (Very bad Hazardous)
383 (Very bad Hazardous)
401 (Very bad Hazardous)
655 (Very bad Hazardous)
no2
16 (Good)
16 (Good)
25 (Good)
84 (Moderate)
28 (Good)
28 (Good)
29 (Good)
26 (Good)
11 (Good)
8.4 (Good)
8.4 (Good)
28 (Good)
31 (Good)
19 (Good)
59 (Moderate)
co
1 (Good)
1 (Good)
1 (Good)
2 (Good)
1 (Good)
3 (Good)
2 (Good)
1 (Good)
1 (Good)
1 (Good)
863 (Good)
4 (Good)
3 (Good)
3 (Good)
2 (Good)
o3
22 (Good)
7.5 (Good)
13 (Good)
29 (Good)
116 (Moderate)
12 (Good)
20 (Good)
21 (Good)
34 (Good)
37 (Good)
51 (Good)
34 (Good)
50 (Good)
43 (Good)
35 (Good)
data source »
North Campus, DU, New Delhi - IMD
lunedì 31 ottobre 2022, 02:00
CO 1390 (Buono)
monossido di carbonio (CO)
O3 0.01 (Buono)
ozono (O3)
PM2,5 148 (Molto male Pericoloso)
polvere di particolato (PM2.5)
PM10 235 (Molto male Pericoloso)
polveri sospese di particolato (PM10)
NO2 24 (Buono)
biossido di azoto (NO2)
North Campus, DU, New Delhi - IMD
index
2022-10-31
co
1615
o3
0.01
pm25
161
pm10
253
no2
23
North Campus, DU, Delhi - IMD
2018-12 2020-05

index
2020-05
2020-04
2020-03
2020-02
2020-01
2019-12
2019-11
2019-10
2019-09
2019-08
2019-07
2019-05
2019-04
2019-02
2018-12
pm25
40
30
46
99
119
184
161
128
36
32
39
81
206
246
295
pm10
100
91
102
195
203
297
250
225
88
73
124
280
383
401
655
no2
16
16
25
84
28
28
29
26
11
8.4
8.4
28
31
19
59
co
1
1
1
2
1
3
2
1
1
1
863
4
3
3
2
o3
22
7.5
13
29
116
12
20
21
34
37
51
34
50
43
35
* Pollution data source:
https://openaq.org
(caaqm)
The data is licensed under CC-By 4.0
CO 1390 (Buono)
O3 0 (Buono)
PM2,5 148 (Molto male Pericoloso)
PM10 235 (Molto male Pericoloso)
NO2 24 (Buono)
Dati sull'inquinamento atmosferico degli ultimi giorni Premnagar
| index | 2022-10-31 |
|---|---|
| co | 1615 Good |
| o3 | 0 Good |
| pm25 | 161 Very bad Hazardous |
| pm10 | 253 Very bad Hazardous |
| no2 | 23 Good |
| index | 2020-05 | 2020-04 | 2020-03 | 2020-02 | 2020-01 | 2019-12 | 2019-11 | 2019-10 | 2019-09 | 2019-08 | 2019-07 | 2019-05 | 2019-04 | 2019-02 | 2018-12 |
|---|---|---|---|---|---|---|---|---|---|---|---|---|---|---|---|
| pm25 | 40 (Unhealthy for Sensitive Groups) | 30 (Moderate) | 46 (Unhealthy for Sensitive Groups) | 99 (Very Unhealthy) | 119 (Very bad Hazardous) | 184 (Very bad Hazardous) | 161 (Very bad Hazardous) | 128 (Very bad Hazardous) | 36 (Unhealthy for Sensitive Groups) | 32 (Moderate) | 39 (Unhealthy for Sensitive Groups) | 81 (Very Unhealthy) | 206 (Very bad Hazardous) | 246 (Very bad Hazardous) | 295 (Very bad Hazardous) |
| pm10 | 100 (Unhealthy) | 91 (Unhealthy) | 102 (Unhealthy) | 195 (Very bad Hazardous) | 203 (Very bad Hazardous) | 297 (Very bad Hazardous) | 250 (Very bad Hazardous) | 225 (Very bad Hazardous) | 88 (Unhealthy) | 73 (Unhealthy for Sensitive Groups) | 124 (Very Unhealthy) | 280 (Very bad Hazardous) | 383 (Very bad Hazardous) | 401 (Very bad Hazardous) | 655 (Very bad Hazardous) |
| no2 | 16 (Good) | 16 (Good) | 25 (Good) | 84 (Moderate) | 28 (Good) | 28 (Good) | 29 (Good) | 26 (Good) | 11 (Good) | 8.4 (Good) | 8.4 (Good) | 28 (Good) | 31 (Good) | 19 (Good) | 59 (Moderate) |
| co | 1 (Good) | 1 (Good) | 1 (Good) | 2 (Good) | 1 (Good) | 3 (Good) | 2 (Good) | 1 (Good) | 1 (Good) | 1 (Good) | 863 (Good) | 4 (Good) | 3 (Good) | 3 (Good) | 2 (Good) |
| o3 | 22 (Good) | 7.5 (Good) | 13 (Good) | 29 (Good) | 116 (Moderate) | 12 (Good) | 20 (Good) | 21 (Good) | 34 (Good) | 37 (Good) | 51 (Good) | 34 (Good) | 50 (Good) | 43 (Good) | 35 (Good) |
CO 1390 (Buono)
monossido di carbonio (CO)O3 0.01 (Buono)
ozono (O3)PM2,5 148 (Molto male Pericoloso)
polvere di particolato (PM2.5)PM10 235 (Molto male Pericoloso)
polveri sospese di particolato (PM10)NO2 24 (Buono)
biossido di azoto (NO2)North Campus, DU, New Delhi - IMD
| index | 2022-10-31 |
|---|---|
| co | 1615 |
| o3 | 0.01 |
| pm25 | 161 |
| pm10 | 253 |
| no2 | 23 |
North Campus, DU, Delhi - IMD
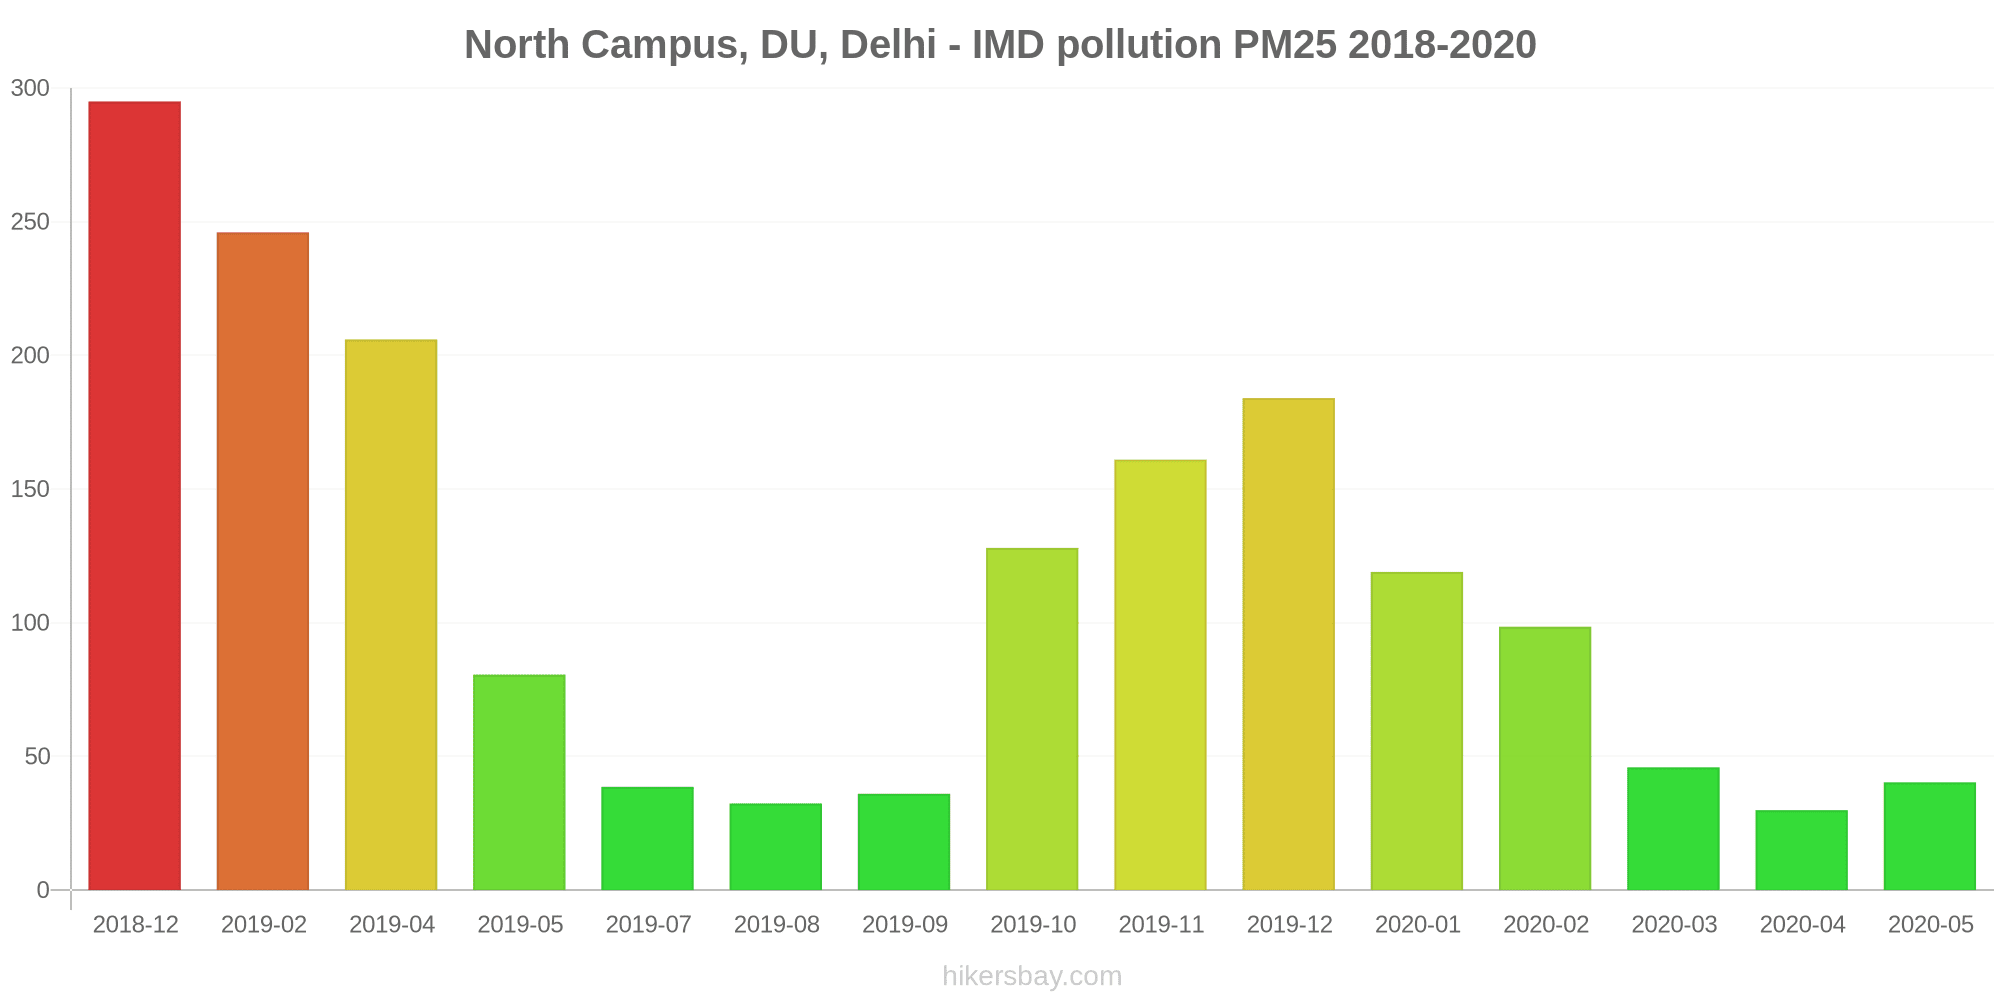
| index | 2020-05 | 2020-04 | 2020-03 | 2020-02 | 2020-01 | 2019-12 | 2019-11 | 2019-10 | 2019-09 | 2019-08 | 2019-07 | 2019-05 | 2019-04 | 2019-02 | 2018-12 |
|---|---|---|---|---|---|---|---|---|---|---|---|---|---|---|---|
| pm25 | 40 | 30 | 46 | 99 | 119 | 184 | 161 | 128 | 36 | 32 | 39 | 81 | 206 | 246 | 295 |
| pm10 | 100 | 91 | 102 | 195 | 203 | 297 | 250 | 225 | 88 | 73 | 124 | 280 | 383 | 401 | 655 |
| no2 | 16 | 16 | 25 | 84 | 28 | 28 | 29 | 26 | 11 | 8.4 | 8.4 | 28 | 31 | 19 | 59 |
| co | 1 | 1 | 1 | 2 | 1 | 3 | 2 | 1 | 1 | 1 | 863 | 4 | 3 | 3 | 2 |
| o3 | 22 | 7.5 | 13 | 29 | 116 | 12 | 20 | 21 | 34 | 37 | 51 | 34 | 50 | 43 | 35 |