Inquinamento atmosferico in Kreisfreie Stadt Lübeck: indice di qualità dell'aria in tempo reale e allarme smog.
Previsioni di inquinamento e qualità dell'aria per Kreisfreie Stadt Lübeck. Oggi è domenica 21 giugno 2026. Per Kreisfreie Stadt Lübeck sono stati registrati i seguenti valori di inquinamento atmosferico:- biossido di azoto (NO2) - 18 (Buono)
- polvere di particolato (PM2.5) - 8 (Buono)
- ozono (O3) - 54 (Buono)
- polveri sospese di particolato (PM10) - 12 (Buono)

Qual è la qualità dell'aria Kreisfreie Stadt Lübeck oggi? L'aria è inquinata Kreisfreie Stadt Lübeck? C'è smog?
Quanto è alto il livello di NO2? (biossido di azoto (NO2))
18 (Buono)
Qual è il livello attuale di PM2.5 in Kreisfreie Stadt Lübeck? (polvere di particolato (PM2.5))
Il livello PM2.5 di oggi è:
8 (Buono)
Per fare un confronto, il livello più alto di PM2,5 in Kreisfreie Stadt Lübeck negli ultimi 7 giorni è stato: 17 (mercoledì 10 gennaio 2024) e il più basso: 2 (sabato 13 gennaio 2024).
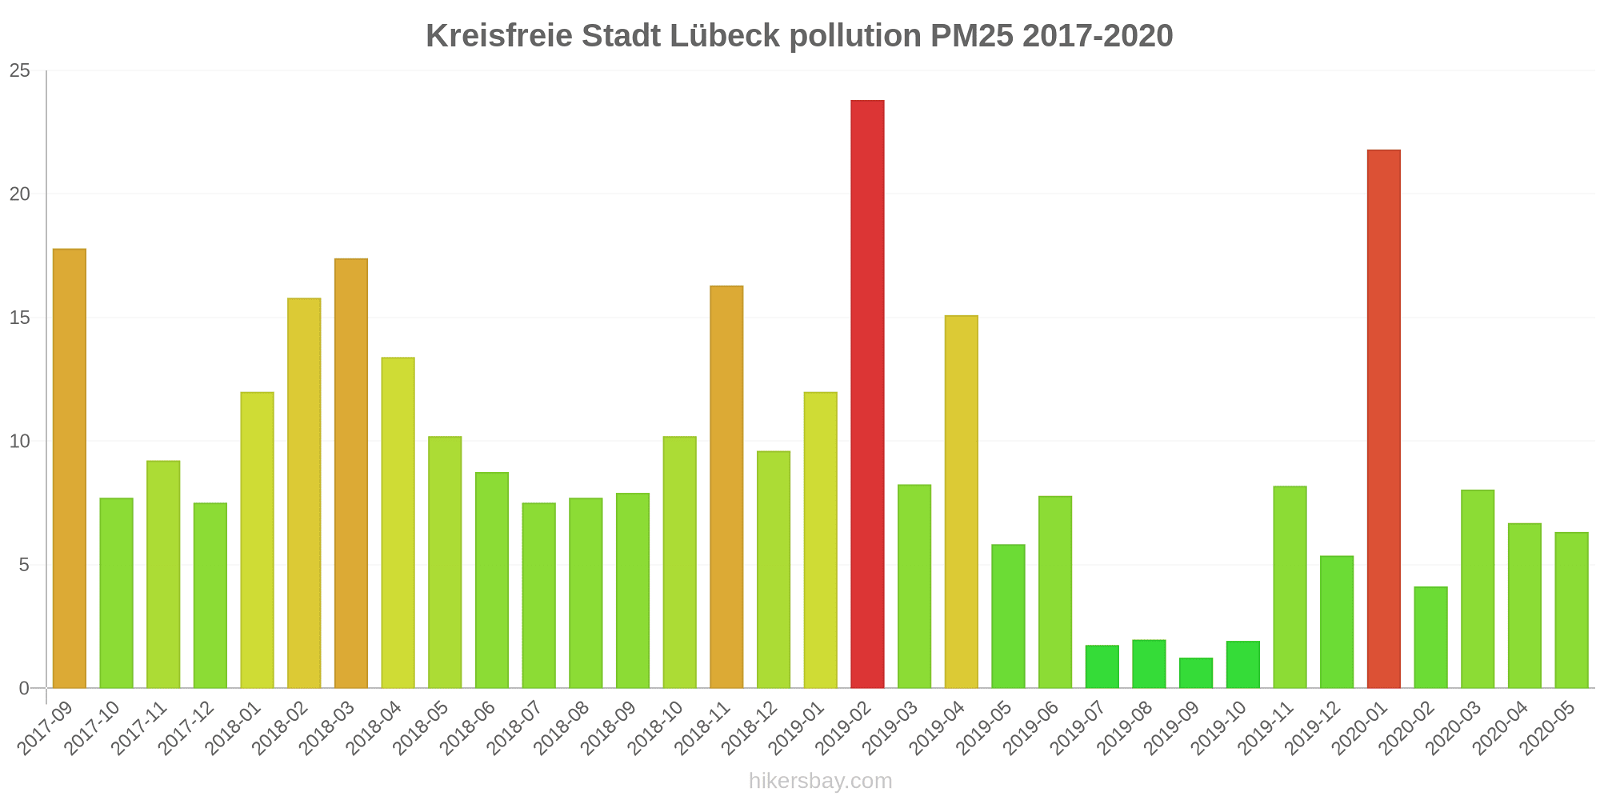
Sono stati registrati i valori PM2,5 più alti: 24 (febbraio 2019).
Il più basso livello di inquinamento da particolato PM2.5 si verifica nel mese: settembre (1.2).
Come è il livello O3 oggi in Kreisfreie Stadt Lübeck? (ozono (O3))
54 (Buono)
Qual è il livello di PM10 oggi in Kreisfreie Stadt Lübeck? (polveri sospese di particolato (PM10))
L'attuale livello di particolato PM10 in Kreisfreie Stadt Lübeck è:
12 (Buono)
I valori PM10 più alti si verificano in genere nel mese: 29 (settembre 2017).
Il valore più basso dell'inquinamento da particolato PM10 in Kreisfreie Stadt Lübeck è di solito registrato in: settembre (3.2).
Dati correnti mercoledì 17 gennaio 2024, 09:00
NO2 18 (Buono)
PM2,5 8 (Buono)
O3 54 (Buono)
PM10 12 (Buono)
Dati sull'inquinamento atmosferico degli ultimi giorni Kreisfreie Stadt Lübeck
index
2024-01-10
2024-01-11
2024-01-12
2024-01-13
2024-01-14
2024-01-15
2024-01-16
2024-01-17
no2
41
Moderate
32
Good
33
Good
11
Good
9
Good
21
Good
23
Good
18
Good
o3
33
Good
35
Good
29
Good
68
Good
69
Good
58
Good
57
Good
46
Good
pm25
17
Moderate
10
Good
10
Good
2
Good
2
Good
3
Good
5
Good
12
Good
pm10
22
Moderate
14
Good
16
Good
6
Good
8
Good
10
Good
10
Good
17
Good
data source »
Inquinamento atmosferico in Kreisfreie Stadt Lübeck da settembre 2017 a maggio 2020
index
2020-05
2020-04
2020-03
2020-02
2020-01
2019-12
2019-11
2019-10
2019-09
2019-08
2019-07
2019-06
2019-05
2019-04
2019-03
2019-02
2019-01
2018-12
2018-11
2018-10
2018-09
2018-08
2018-07
2018-06
2018-05
2018-04
2018-03
2018-02
2018-01
2017-12
2017-11
2017-10
2017-09
o3
57 (Good)
64 (Good)
58 (Good)
63 (Good)
44 (Good)
21 (Good)
14 (Good)
11 (Good)
12 (Good)
11 (Good)
17 (Good)
61 (Good)
57 (Good)
58 (Good)
61 (Good)
30 (Good)
45 (Good)
37 (Good)
27 (Good)
37 (Good)
43 (Good)
44 (Good)
46 (Good)
56 (Good)
58 (Good)
69 (Good)
57 (Good)
46 (Good)
43 (Good)
42 (Good)
32 (Good)
41 (Good)
30 (Good)
pm25
6.3 (Good)
6.7 (Good)
8 (Good)
4.1 (Good)
22 (Moderate)
5.4 (Good)
8.2 (Good)
1.9 (Good)
1.2 (Good)
2 (Good)
1.8 (Good)
7.8 (Good)
5.8 (Good)
15 (Moderate)
8.3 (Good)
24 (Moderate)
12 (Good)
9.6 (Good)
16 (Moderate)
10 (Good)
7.9 (Good)
7.7 (Good)
7.5 (Good)
8.8 (Good)
10 (Good)
13 (Moderate)
17 (Moderate)
16 (Moderate)
12 (Good)
7.5 (Good)
9.2 (Good)
7.7 (Good)
18 (Moderate)
pm10
12 (Good)
15 (Good)
13 (Good)
8.7 (Good)
14 (Good)
6.5 (Good)
11 (Good)
4.1 (Good)
3.2 (Good)
3.8 (Good)
4.7 (Good)
13 (Good)
9.8 (Good)
20 (Good)
14 (Good)
26 (Moderate)
16 (Good)
12 (Good)
18 (Good)
15 (Good)
13 (Good)
13 (Good)
13 (Good)
14 (Good)
17 (Good)
19 (Good)
20 (Good)
21 (Moderate)
14 (Good)
10 (Good)
10 (Good)
16 (Good)
29 (Moderate)
no2
15 (Good)
16 (Good)
17 (Good)
11 (Good)
17 (Good)
13 (Good)
11 (Good)
5.8 (Good)
3.7 (Good)
4.8 (Good)
4.1 (Good)
13 (Good)
15 (Good)
26 (Good)
16 (Good)
32 (Good)
18 (Good)
15 (Good)
20 (Good)
22 (Good)
22 (Good)
20 (Good)
21 (Good)
19 (Good)
26 (Good)
26 (Good)
29 (Good)
34 (Good)
23 (Good)
25 (Good)
27 (Good)
21 (Good)
23 (Good)
data source »
Qualità della vita in Kreisfreie Stadt Lübeck
Verde e parchi in città
Kreisfreie Stadt Lübeck
75%
Lussemburgo: 83%
Paesi Bassi: 82%
Repubblica Ceca: 77%
Belgio: 64%
Liechtenstein: 88%
particolato PM2.5
Kreisfreie Stadt Lübeck
10 (Good)
Il piacere di trascorrere del tempo in città
Kreisfreie Stadt Lübeck
92%
Lussemburgo: 85%
Paesi Bassi: 88%
Repubblica Ceca: 77%
Belgio: 64%
Liechtenstein: 94%
particolato PM10
Kreisfreie Stadt Lübeck
16 (Good)
Inquinamento dell'aria
Kreisfreie Stadt Lübeck
0%
Lussemburgo: 19%
Paesi Bassi: 21%
Repubblica Ceca: 35%
Belgio: 45%
Liechtenstein: 6,3%
Smaltimento dei rifiuti
Kreisfreie Stadt Lübeck
100%
Lussemburgo: 84%
Paesi Bassi: 79%
Repubblica Ceca: 74%
Belgio: 54%
Liechtenstein: 100%
Disponibilità e qualità dell'acqua potabile
Kreisfreie Stadt Lübeck
100%
Lussemburgo: 83%
Paesi Bassi: 92%
Repubblica Ceca: 84%
Belgio: 70%
Liechtenstein: 100%
Pulizia e ordine
Kreisfreie Stadt Lübeck
100%
Lussemburgo: 82%
Paesi Bassi: 77%
Repubblica Ceca: 65%
Belgio: 46%
Liechtenstein: 94%
Rumore e inquinamento luminoso
Kreisfreie Stadt Lübeck
75%
Lussemburgo: 29%
Paesi Bassi: 31%
Repubblica Ceca: 44%
Belgio: 54%
Liechtenstein: 19%
Inquinamento delle acque
Kreisfreie Stadt Lübeck
25%
Lussemburgo: 19%
Paesi Bassi: 17%
Repubblica Ceca: 28%
Belgio: 42%
Liechtenstein: 0%
Source: Numbeo
Lübeck-St. Jürgen
mercoledì 17 gennaio 2024, 09:00
NO2 8.9 (Buono)
biossido di azoto (NO2)
PM2,5 8 (Buono)
polvere di particolato (PM2.5)
O3 54 (Buono)
ozono (O3)
PM10 12 (Buono)
polveri sospese di particolato (PM10)
Lübeck Moislinger Allee
mercoledì 17 gennaio 2024, 09:00
PM2,5 8.3 (Buono)
polvere di particolato (PM2.5)
NO2 28 (Buono)
biossido di azoto (NO2)
PM10 12 (Buono)
polveri sospese di particolato (PM10)
Lübeck Fackenburger Allee
mercoledì 17 gennaio 2024, 09:00
NO2 18 (Buono)
biossido di azoto (NO2)
Lübeck-St. Jürgen
index
2024-01-17
2024-01-16
2024-01-15
2024-01-14
2024-01-13
2024-01-12
2024-01-11
2024-01-10
no2
12
11
12
5
4.6
25
24
29
o3
46
57
58
69
68
29
35
33
pm25
13
4.9
2.8
1.8
1.8
10
9.7
17
pm10
17
9.7
9
7
5
16
14
22
Lübeck Moislinger Allee
index
2024-01-17
2024-01-16
2024-01-15
2024-01-14
2024-01-13
2024-01-12
2024-01-11
2024-01-10
no2
23
31
23
10
15
37
36
45
pm10
16
11
11
8.3
6.6
16
15
21
pm25
12
5.5
3.8
2.5
2.4
10
9.8
16
Lübeck Fackenburger Allee
index
2024-01-17
2024-01-16
2024-01-15
2024-01-14
2024-01-13
2024-01-12
2024-01-11
2024-01-10
no2
19
27
27
11
13
36
37
50
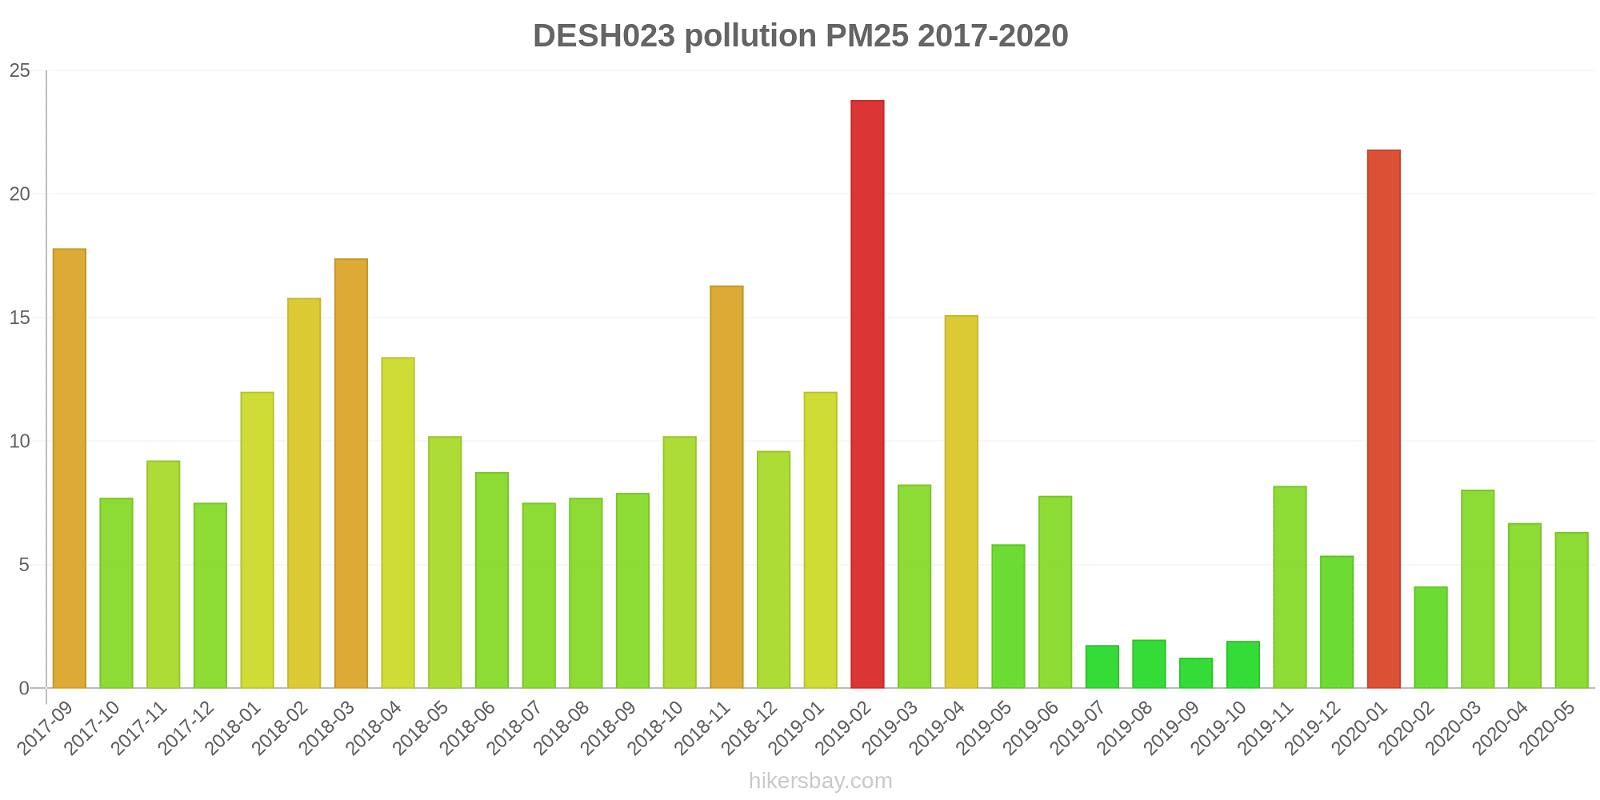
DESH023
2017-09 2020-05
index
2020-05
2020-04
2020-03
2020-02
2020-01
2019-12
2019-11
2019-10
2019-09
2019-08
2019-07
2019-06
2019-05
2019-04
2019-03
2019-02
2019-01
2018-12
2018-11
2018-10
2018-09
2018-08
2018-07
2018-06
2018-05
2018-04
2018-03
2018-02
2018-01
2017-12
2017-11
2017-10
2017-09
pm25
6.3
6.7
8
4.1
22
5.4
8.2
1.9
1.2
2
1.8
7.8
5.8
15
8.3
24
12
9.6
16
10
7.9
7.7
7.5
8.8
10
13
17
16
12
7.5
9.2
7.7
18
pm10
11
13
12
8.2
13
7.3
9.7
3.4
2.8
3.7
4.4
13
9.8
20
14
26
16
12
18
15
13
13
13
14
17
19
20
21
14
10
10
16
29
no2
11
10
12
7
13
10
8.8
4.4
2.6
3.7
3.1
9.4
12
20
10
25
14
11
15
14
13
14
13
13
16
14
18
19
15
16
17
12
13
o3
57
64
58
63
44
21
14
11
12
11
17
61
57
58
61
30
45
37
27
37
43
44
46
56
58
69
57
46
43
42
32
41
30
DESH053
index
2020-05
2020-04
2020-03
2020-02
2020-01
2019-12
2019-11
2019-10
2019-09
2019-08
2019-07
2019-06
2019-05
2019-04
2019-03
2019-02
2019-01
2018-12
2018-11
2018-10
2018-09
2018-08
2018-07
2018-06
2018-05
2018-04
2018-03
2018-02
2018-01
2017-12
2017-11
2017-10
2017-09
no2
18
17
20
13
19
9.1
12
6.3
4.4
4.5
4.3
14
16
25
19
35
20
17
21
25
25
21
23
19
27
30
29
40
27
29
34
26
24
pm10
13
17
14
9.1
15
5.8
12
4.8
3.7
3.9
5.1
-
-
-
-
-
-
-
-
-
-
-
-
-
-
-
-
-
-
-
-
-
-
DESH055
index
2020-05
2020-04
2020-03
2020-02
2020-01
2019-12
2019-11
2019-10
2019-09
2019-08
2019-07
2019-06
2019-05
2019-04
2019-03
2019-02
2019-01
2018-12
2018-11
2018-10
2018-09
2018-08
2018-07
2018-06
2018-05
2018-04
2018-03
2018-02
2018-01
2017-12
2017-11
2017-10
2017-09
no2
15
20
19
12
18
19
11
6.7
4.2
6.3
5
16
18
32
18
37
21
17
24
28
27
26
27
24
35
36
41
44
28
32
32
25
31
* Pollution data source:
https://openaq.org
(EEA Germany)
The data is licensed under CC-By 4.0
NO2 18 (Buono)
PM2,5 8 (Buono)
O3 54 (Buono)
PM10 12 (Buono)
Dati sull'inquinamento atmosferico degli ultimi giorni Kreisfreie Stadt Lübeck
| index | 2024-01-10 | 2024-01-11 | 2024-01-12 | 2024-01-13 | 2024-01-14 | 2024-01-15 | 2024-01-16 | 2024-01-17 |
|---|---|---|---|---|---|---|---|---|
| no2 | 41 Moderate |
32 Good |
33 Good |
11 Good |
9 Good |
21 Good |
23 Good |
18 Good |
| o3 | 33 Good |
35 Good |
29 Good |
68 Good |
69 Good |
58 Good |
57 Good |
46 Good |
| pm25 | 17 Moderate |
10 Good |
10 Good |
2 Good |
2 Good |
3 Good |
5 Good |
12 Good |
| pm10 | 22 Moderate |
14 Good |
16 Good |
6 Good |
8 Good |
10 Good |
10 Good |
17 Good |

| index | 2020-05 | 2020-04 | 2020-03 | 2020-02 | 2020-01 | 2019-12 | 2019-11 | 2019-10 | 2019-09 | 2019-08 | 2019-07 | 2019-06 | 2019-05 | 2019-04 | 2019-03 | 2019-02 | 2019-01 | 2018-12 | 2018-11 | 2018-10 | 2018-09 | 2018-08 | 2018-07 | 2018-06 | 2018-05 | 2018-04 | 2018-03 | 2018-02 | 2018-01 | 2017-12 | 2017-11 | 2017-10 | 2017-09 |
|---|---|---|---|---|---|---|---|---|---|---|---|---|---|---|---|---|---|---|---|---|---|---|---|---|---|---|---|---|---|---|---|---|---|
| o3 | 57 (Good) | 64 (Good) | 58 (Good) | 63 (Good) | 44 (Good) | 21 (Good) | 14 (Good) | 11 (Good) | 12 (Good) | 11 (Good) | 17 (Good) | 61 (Good) | 57 (Good) | 58 (Good) | 61 (Good) | 30 (Good) | 45 (Good) | 37 (Good) | 27 (Good) | 37 (Good) | 43 (Good) | 44 (Good) | 46 (Good) | 56 (Good) | 58 (Good) | 69 (Good) | 57 (Good) | 46 (Good) | 43 (Good) | 42 (Good) | 32 (Good) | 41 (Good) | 30 (Good) |
| pm25 | 6.3 (Good) | 6.7 (Good) | 8 (Good) | 4.1 (Good) | 22 (Moderate) | 5.4 (Good) | 8.2 (Good) | 1.9 (Good) | 1.2 (Good) | 2 (Good) | 1.8 (Good) | 7.8 (Good) | 5.8 (Good) | 15 (Moderate) | 8.3 (Good) | 24 (Moderate) | 12 (Good) | 9.6 (Good) | 16 (Moderate) | 10 (Good) | 7.9 (Good) | 7.7 (Good) | 7.5 (Good) | 8.8 (Good) | 10 (Good) | 13 (Moderate) | 17 (Moderate) | 16 (Moderate) | 12 (Good) | 7.5 (Good) | 9.2 (Good) | 7.7 (Good) | 18 (Moderate) |
| pm10 | 12 (Good) | 15 (Good) | 13 (Good) | 8.7 (Good) | 14 (Good) | 6.5 (Good) | 11 (Good) | 4.1 (Good) | 3.2 (Good) | 3.8 (Good) | 4.7 (Good) | 13 (Good) | 9.8 (Good) | 20 (Good) | 14 (Good) | 26 (Moderate) | 16 (Good) | 12 (Good) | 18 (Good) | 15 (Good) | 13 (Good) | 13 (Good) | 13 (Good) | 14 (Good) | 17 (Good) | 19 (Good) | 20 (Good) | 21 (Moderate) | 14 (Good) | 10 (Good) | 10 (Good) | 16 (Good) | 29 (Moderate) |
| no2 | 15 (Good) | 16 (Good) | 17 (Good) | 11 (Good) | 17 (Good) | 13 (Good) | 11 (Good) | 5.8 (Good) | 3.7 (Good) | 4.8 (Good) | 4.1 (Good) | 13 (Good) | 15 (Good) | 26 (Good) | 16 (Good) | 32 (Good) | 18 (Good) | 15 (Good) | 20 (Good) | 22 (Good) | 22 (Good) | 20 (Good) | 21 (Good) | 19 (Good) | 26 (Good) | 26 (Good) | 29 (Good) | 34 (Good) | 23 (Good) | 25 (Good) | 27 (Good) | 21 (Good) | 23 (Good) |
Verde e parchi in città
Kreisfreie Stadt Lübeck 75%
Lussemburgo: 83% Paesi Bassi: 82% Repubblica Ceca: 77% Belgio: 64% Liechtenstein: 88%particolato PM2.5
Kreisfreie Stadt Lübeck 10 (Good)
Il piacere di trascorrere del tempo in città
Kreisfreie Stadt Lübeck 92%
Lussemburgo: 85% Paesi Bassi: 88% Repubblica Ceca: 77% Belgio: 64% Liechtenstein: 94%particolato PM10
Kreisfreie Stadt Lübeck 16 (Good)
Inquinamento dell'aria
Kreisfreie Stadt Lübeck 0%
Lussemburgo: 19% Paesi Bassi: 21% Repubblica Ceca: 35% Belgio: 45% Liechtenstein: 6,3%Smaltimento dei rifiuti
Kreisfreie Stadt Lübeck 100%
Lussemburgo: 84% Paesi Bassi: 79% Repubblica Ceca: 74% Belgio: 54% Liechtenstein: 100%Disponibilità e qualità dell'acqua potabile
Kreisfreie Stadt Lübeck 100%
Lussemburgo: 83% Paesi Bassi: 92% Repubblica Ceca: 84% Belgio: 70% Liechtenstein: 100%Pulizia e ordine
Kreisfreie Stadt Lübeck 100%
Lussemburgo: 82% Paesi Bassi: 77% Repubblica Ceca: 65% Belgio: 46% Liechtenstein: 94%Rumore e inquinamento luminoso
Kreisfreie Stadt Lübeck 75%
Lussemburgo: 29% Paesi Bassi: 31% Repubblica Ceca: 44% Belgio: 54% Liechtenstein: 19%Inquinamento delle acque
Kreisfreie Stadt Lübeck 25%
Lussemburgo: 19% Paesi Bassi: 17% Repubblica Ceca: 28% Belgio: 42% Liechtenstein: 0%NO2 8.9 (Buono)
biossido di azoto (NO2)PM2,5 8 (Buono)
polvere di particolato (PM2.5)O3 54 (Buono)
ozono (O3)PM10 12 (Buono)
polveri sospese di particolato (PM10)PM2,5 8.3 (Buono)
polvere di particolato (PM2.5)NO2 28 (Buono)
biossido di azoto (NO2)PM10 12 (Buono)
polveri sospese di particolato (PM10)NO2 18 (Buono)
biossido di azoto (NO2)Lübeck-St. Jürgen
| index | 2024-01-17 | 2024-01-16 | 2024-01-15 | 2024-01-14 | 2024-01-13 | 2024-01-12 | 2024-01-11 | 2024-01-10 |
|---|---|---|---|---|---|---|---|---|
| no2 | 12 | 11 | 12 | 5 | 4.6 | 25 | 24 | 29 |
| o3 | 46 | 57 | 58 | 69 | 68 | 29 | 35 | 33 |
| pm25 | 13 | 4.9 | 2.8 | 1.8 | 1.8 | 10 | 9.7 | 17 |
| pm10 | 17 | 9.7 | 9 | 7 | 5 | 16 | 14 | 22 |
Lübeck Moislinger Allee
| index | 2024-01-17 | 2024-01-16 | 2024-01-15 | 2024-01-14 | 2024-01-13 | 2024-01-12 | 2024-01-11 | 2024-01-10 |
|---|---|---|---|---|---|---|---|---|
| no2 | 23 | 31 | 23 | 10 | 15 | 37 | 36 | 45 |
| pm10 | 16 | 11 | 11 | 8.3 | 6.6 | 16 | 15 | 21 |
| pm25 | 12 | 5.5 | 3.8 | 2.5 | 2.4 | 10 | 9.8 | 16 |
Lübeck Fackenburger Allee
| index | 2024-01-17 | 2024-01-16 | 2024-01-15 | 2024-01-14 | 2024-01-13 | 2024-01-12 | 2024-01-11 | 2024-01-10 |
|---|---|---|---|---|---|---|---|---|
| no2 | 19 | 27 | 27 | 11 | 13 | 36 | 37 | 50 |
DESH023

| index | 2020-05 | 2020-04 | 2020-03 | 2020-02 | 2020-01 | 2019-12 | 2019-11 | 2019-10 | 2019-09 | 2019-08 | 2019-07 | 2019-06 | 2019-05 | 2019-04 | 2019-03 | 2019-02 | 2019-01 | 2018-12 | 2018-11 | 2018-10 | 2018-09 | 2018-08 | 2018-07 | 2018-06 | 2018-05 | 2018-04 | 2018-03 | 2018-02 | 2018-01 | 2017-12 | 2017-11 | 2017-10 | 2017-09 |
|---|---|---|---|---|---|---|---|---|---|---|---|---|---|---|---|---|---|---|---|---|---|---|---|---|---|---|---|---|---|---|---|---|---|
| pm25 | 6.3 | 6.7 | 8 | 4.1 | 22 | 5.4 | 8.2 | 1.9 | 1.2 | 2 | 1.8 | 7.8 | 5.8 | 15 | 8.3 | 24 | 12 | 9.6 | 16 | 10 | 7.9 | 7.7 | 7.5 | 8.8 | 10 | 13 | 17 | 16 | 12 | 7.5 | 9.2 | 7.7 | 18 |
| pm10 | 11 | 13 | 12 | 8.2 | 13 | 7.3 | 9.7 | 3.4 | 2.8 | 3.7 | 4.4 | 13 | 9.8 | 20 | 14 | 26 | 16 | 12 | 18 | 15 | 13 | 13 | 13 | 14 | 17 | 19 | 20 | 21 | 14 | 10 | 10 | 16 | 29 |
| no2 | 11 | 10 | 12 | 7 | 13 | 10 | 8.8 | 4.4 | 2.6 | 3.7 | 3.1 | 9.4 | 12 | 20 | 10 | 25 | 14 | 11 | 15 | 14 | 13 | 14 | 13 | 13 | 16 | 14 | 18 | 19 | 15 | 16 | 17 | 12 | 13 |
| o3 | 57 | 64 | 58 | 63 | 44 | 21 | 14 | 11 | 12 | 11 | 17 | 61 | 57 | 58 | 61 | 30 | 45 | 37 | 27 | 37 | 43 | 44 | 46 | 56 | 58 | 69 | 57 | 46 | 43 | 42 | 32 | 41 | 30 |
DESH053
| index | 2020-05 | 2020-04 | 2020-03 | 2020-02 | 2020-01 | 2019-12 | 2019-11 | 2019-10 | 2019-09 | 2019-08 | 2019-07 | 2019-06 | 2019-05 | 2019-04 | 2019-03 | 2019-02 | 2019-01 | 2018-12 | 2018-11 | 2018-10 | 2018-09 | 2018-08 | 2018-07 | 2018-06 | 2018-05 | 2018-04 | 2018-03 | 2018-02 | 2018-01 | 2017-12 | 2017-11 | 2017-10 | 2017-09 |
|---|---|---|---|---|---|---|---|---|---|---|---|---|---|---|---|---|---|---|---|---|---|---|---|---|---|---|---|---|---|---|---|---|---|
| no2 | 18 | 17 | 20 | 13 | 19 | 9.1 | 12 | 6.3 | 4.4 | 4.5 | 4.3 | 14 | 16 | 25 | 19 | 35 | 20 | 17 | 21 | 25 | 25 | 21 | 23 | 19 | 27 | 30 | 29 | 40 | 27 | 29 | 34 | 26 | 24 |
| pm10 | 13 | 17 | 14 | 9.1 | 15 | 5.8 | 12 | 4.8 | 3.7 | 3.9 | 5.1 | - | - | - | - | - | - | - | - | - | - | - | - | - | - | - | - | - | - | - | - | - | - |
DESH055
| index | 2020-05 | 2020-04 | 2020-03 | 2020-02 | 2020-01 | 2019-12 | 2019-11 | 2019-10 | 2019-09 | 2019-08 | 2019-07 | 2019-06 | 2019-05 | 2019-04 | 2019-03 | 2019-02 | 2019-01 | 2018-12 | 2018-11 | 2018-10 | 2018-09 | 2018-08 | 2018-07 | 2018-06 | 2018-05 | 2018-04 | 2018-03 | 2018-02 | 2018-01 | 2017-12 | 2017-11 | 2017-10 | 2017-09 |
|---|---|---|---|---|---|---|---|---|---|---|---|---|---|---|---|---|---|---|---|---|---|---|---|---|---|---|---|---|---|---|---|---|---|
| no2 | 15 | 20 | 19 | 12 | 18 | 19 | 11 | 6.7 | 4.2 | 6.3 | 5 | 16 | 18 | 32 | 18 | 37 | 21 | 17 | 24 | 28 | 27 | 26 | 27 | 24 | 35 | 36 | 41 | 44 | 28 | 32 | 32 | 25 | 31 |