Inquinamento atmosferico in Centre-du-Québec: indice di qualità dell'aria in tempo reale e allarme smog.
Previsioni di inquinamento e qualità dell'aria per Centre-du-Québec. Oggi è mercoledì 17 giugno 2026. Per Centre-du-Québec sono stati registrati i seguenti valori di inquinamento atmosferico:- ozono (O3) - 0 (Buono)
- polvere di particolato (PM2.5) - 2 (Buono)

Qual è la qualità dell'aria Centre-du-Québec oggi? L'aria è inquinata Centre-du-Québec? C'è smog?
Come è il livello O3 oggi in Centre-du-Québec? (ozono (O3))
0 (Buono)
Qual è il livello attuale di PM2.5 in Centre-du-Québec? (polvere di particolato (PM2.5))
Il livello PM2.5 di oggi è:
2 (Buono)
Per fare un confronto, il livello più alto di PM2,5 in Centre-du-Québec negli ultimi 7 giorni è stato: 4 (mercoledì 10 aprile 2024) e il più basso: 1 (venerdì 12 aprile 2024).
Sono stati registrati i valori PM2,5 più alti: 14 (febbraio 2020).
Il più basso livello di inquinamento da particolato PM2.5 si verifica nel mese: settembre (2.9).
Dati correnti martedì 16 aprile 2024, 11:00
O3 0 (Buono)
PM2,5 2 (Buono)
Dati sull'inquinamento atmosferico degli ultimi giorni Centre-du-Québec
index
2024-04-09
2024-04-10
2024-04-11
2024-04-12
2024-04-13
2024-04-14
2024-04-15
2024-04-16
o3
0
Good
0
Good
0
Good
0
Good
0
Good
0
Good
0
Good
0
Good
pm25
3
Good
4
Good
4
Good
1
Good
1
Good
2
Good
4
Good
2
Good
data source »
Inquinamento atmosferico in Centre-du-Québec da marzo 2016 a maggio 2020

index
2020-05
2020-04
2020-03
2020-02
2020-01
2019-12
2019-11
2019-10
2019-09
2019-08
2019-07
2019-06
2019-05
2019-04
2019-03
2019-02
2019-01
2018-12
2018-11
2018-10
2018-09
2018-08
2018-07
2018-06
2018-05
2018-04
2018-03
2018-02
2018-01
2017-12
2017-11
2017-10
2017-09
2017-08
2017-07
2017-06
2017-05
2017-04
2016-09
2016-08
2016-05
2016-03
pm25
3.3 (Good)
4.5 (Good)
8.1 (Good)
14 (Moderate)
8 (Good)
7 (Good)
6.6 (Good)
4.2 (Good)
2.9 (Good)
3.3 (Good)
8.4 (Good)
4.5 (Good)
3.5 (Good)
4.5 (Good)
9.5 (Good)
9.7 (Good)
12 (Good)
11 (Good)
7.2 (Good)
5.2 (Good)
3.2 (Good)
6 (Good)
5.9 (Good)
4.8 (Good)
5.5 (Good)
5.6 (Good)
6.3 (Good)
13 (Good)
14 (Moderate)
11 (Good)
8.8 (Good)
7 (Good)
8.9 (Good)
7.5 (Good)
7.8 (Good)
7 (Good)
- (Good)
- (Good)
- (Good)
- (Good)
- (Good)
- (Good)
o3:ppm
0.03 (Good)
0.04 (Good)
0.04 (Good)
0.03 (Good)
0.03 (Good)
0.03 (Good)
0.03 (Good)
0.02 (Good)
0.02 (Good)
0.02 (Good)
0.03 (Good)
0.03 (Good)
0.03 (Good)
0.04 (Good)
0.04 (Good)
0.04 (Good)
0.03 (Good)
0.03 (Good)
0.03 (Good)
0.02 (Good)
0.02 (Good)
0.03 (Good)
0.03 (Good)
0.03 (Good)
0.04 (Good)
0.04 (Good)
0.04 (Good)
0.04 (Good)
0.03 (Good)
0.03 (Good)
0.03 (Good)
0.03 (Good)
0.02 (Good)
0.02 (Good)
0.03 (Good)
0.03 (Good)
0.03 (Good)
0.04 (Good)
0.02 (Good)
0.03 (Good)
0.05 (Good)
0.04 (Good)
data source »
Qualità della vita in Centre-du-Québec
Verde e parchi in città
Centre-du-Québec
88%
Stati Uniti D'America: 70%
Venezuela: 41%
Islanda: 72%
particolato PM2.5
Centre-du-Québec
10 (Good)
Il piacere di trascorrere del tempo in città
Centre-du-Québec
100%
Stati Uniti D'America: 75%
Bahamas: 53%
Venezuela: 41%
Islanda: 89%
particolato PM10
Centre-du-Québec
18 (Good)
Inquinamento dell'aria
Centre-du-Québec
9,4%
Stati Uniti D'America: 29%
Bahamas: 52%
Venezuela: 59%
Islanda: 13%
Smaltimento dei rifiuti
Centre-du-Québec
88%
Stati Uniti D'America: 71%
Bahamas: 29%
Venezuela: 18%
Islanda: 79%
Disponibilità e qualità dell'acqua potabile
Centre-du-Québec
100%
Stati Uniti D'America: 71%
Bahamas: 55%
Venezuela: 28%
Islanda: 96%
Pulizia e ordine
Centre-du-Québec
75%
Stati Uniti D'America: 60%
Bahamas: 35%
Venezuela: 22%
Islanda: 75%
Rumore e inquinamento luminoso
Centre-du-Québec
63%
Stati Uniti D'America: 47%
Bahamas: 39%
Venezuela: 47%
Islanda: 23%
Inquinamento delle acque
Centre-du-Québec
38%
Stati Uniti D'America: 44%
Bahamas: 58%
Venezuela: 76%
Islanda: 8,4%
Source: Numbeo
Tingwick
martedì 16 aprile 2024, 11:00
O3 0.04 (Buono)
ozono (O3)
PM2,5 1.5 (Buono)
polvere di particolato (PM2.5)
Tingwick
index
2024-04-16
2024-04-15
2024-04-14
2024-04-13
2024-04-12
2024-04-11
2024-04-10
2024-04-09
o3
0.04
0.04
0.04
0.03
0.04
0.04
0.05
0.04
pm25
2.1
4
1.6
1.2
1.3
3.5
3.6
2.9
Bécancour (Aréna)
2017-06 2020-05
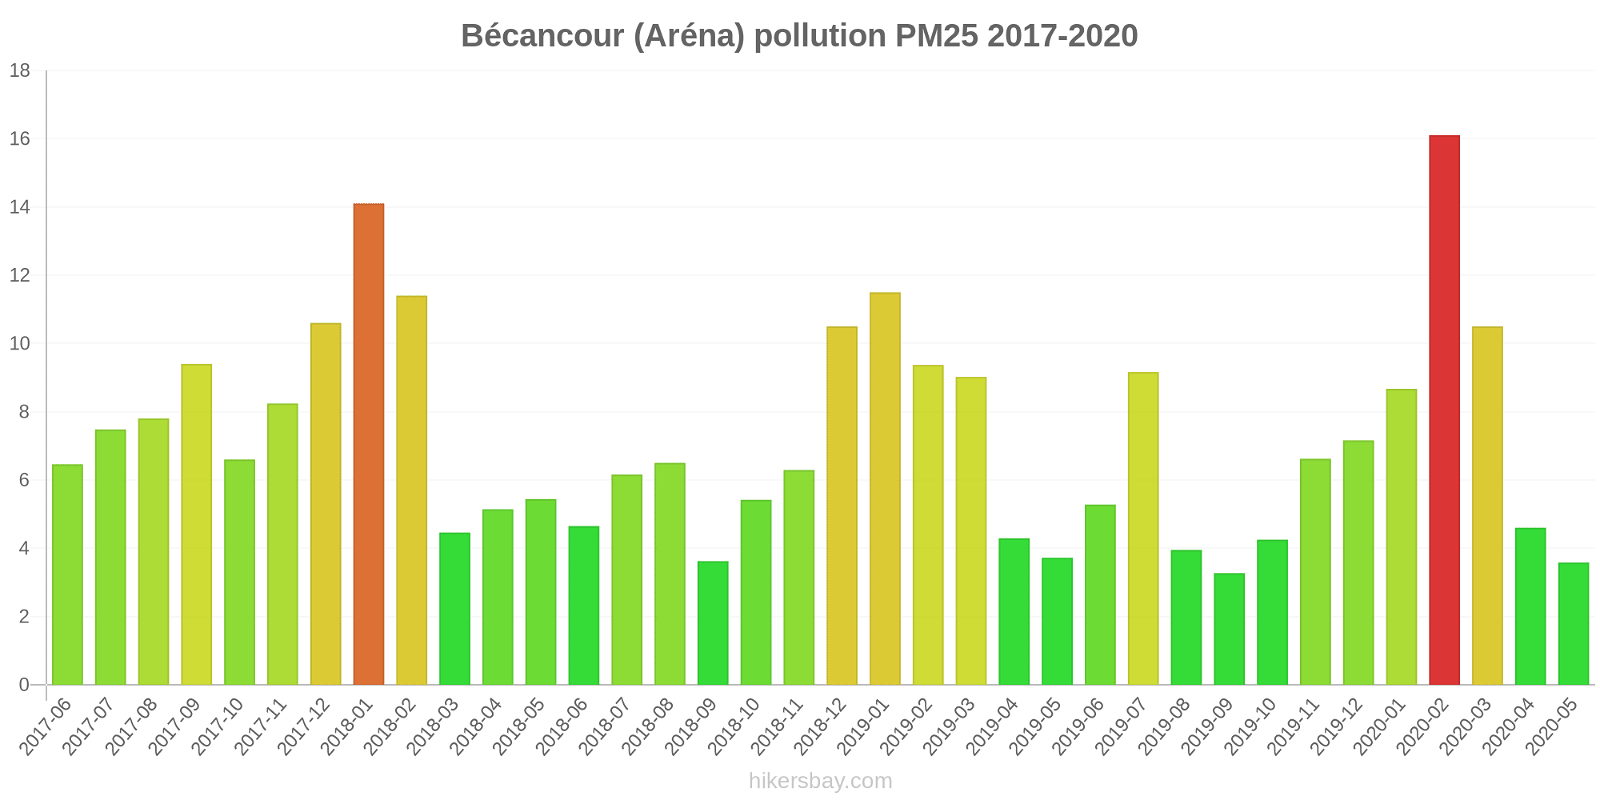
index
2020-05
2020-04
2020-03
2020-02
2020-01
2019-12
2019-11
2019-10
2019-09
2019-08
2019-07
2019-06
2019-05
2019-04
2019-03
2019-02
2019-01
2018-12
2018-11
2018-10
2018-09
2018-08
2018-07
2018-06
2018-05
2018-04
2018-03
2018-02
2018-01
2017-12
2017-11
2017-10
2017-09
2017-08
2017-07
2017-06
pm25
3.6
4.6
11
16
8.7
7.2
6.6
4.3
3.3
4
9.2
5.3
3.7
4.3
9
9.4
12
11
6.3
5.4
3.6
6.5
6.2
4.7
5.4
5.1
4.5
11
14
11
8.2
6.6
9.4
7.8
7.5
6.5
Tingwick
index
2020-05
2020-04
2020-03
2020-02
2020-01
2019-12
2019-11
2019-10
2019-09
2019-08
2019-07
2019-06
2019-05
2019-04
2019-03
2019-02
2019-01
2018-12
2018-11
2018-10
2018-09
2018-08
2018-07
2018-06
2018-05
2018-04
2018-03
2018-02
2018-01
2017-12
2017-11
2017-10
2017-09
2017-08
2017-07
2017-06
2017-05
2017-04
2016-09
2016-08
2016-05
2016-03
o3:ppm
0.03
0.04
0.04
0.03
0.03
0.03
0.03
0.02
0.02
0.03
0.03
0.03
0.03
0.04
0.04
0.04
0.03
0.03
0.03
0.02
0.02
0.03
0.03
0.03
0.04
0.04
0.04
0.04
0.03
0.03
0.03
0.03
0.03
0.03
0.03
0.03
0.03
0.04
0.02
0.03
0.05
0.04
Zéphirin
2017-06 2020-05

index
2020-05
2020-04
2020-03
2020-02
2020-01
2019-12
2019-11
2019-10
2019-09
2019-08
2019-07
2019-06
2019-05
2019-04
2019-03
2019-02
2019-01
2018-12
2018-11
2018-10
2018-09
2018-08
2018-07
2018-06
2018-05
2018-04
2018-03
2018-02
2018-01
2017-12
2017-11
2017-10
2017-09
2017-08
2017-07
2017-06
o3:ppm
0.03
0.04
0.04
0.03
0.03
0.03
0.02
0.02
0.02
0.02
0.03
0.03
0.03
0.04
0.04
0.04
0.02
0.02
0.03
0.01
0.02
0.03
0.03
0.03
0.03
0.04
0.05
0.04
0.03
0.03
0.03
0.02
0.02
0.02
0.02
0.03
pm25
3.1
4.5
5.7
11
7.3
7
6.5
4.2
2.5
2.6
7.6
3.8
3.3
4.7
9.9
9.9
12
11
8.1
5
2.7
5.5
5.7
4.8
5.5
6
8.2
14
13
11
9.4
7.5
8.3
7.1
8.1
7.5
* Pollution data source:
https://openaq.org
(AirNow)
The data is licensed under CC-By 4.0
O3 0 (Buono)
PM2,5 2 (Buono)
Dati sull'inquinamento atmosferico degli ultimi giorni Centre-du-Québec
| index | 2024-04-09 | 2024-04-10 | 2024-04-11 | 2024-04-12 | 2024-04-13 | 2024-04-14 | 2024-04-15 | 2024-04-16 |
|---|---|---|---|---|---|---|---|---|
| o3 | 0 Good |
0 Good |
0 Good |
0 Good |
0 Good |
0 Good |
0 Good |
0 Good |
| pm25 | 3 Good |
4 Good |
4 Good |
1 Good |
1 Good |
2 Good |
4 Good |
2 Good |
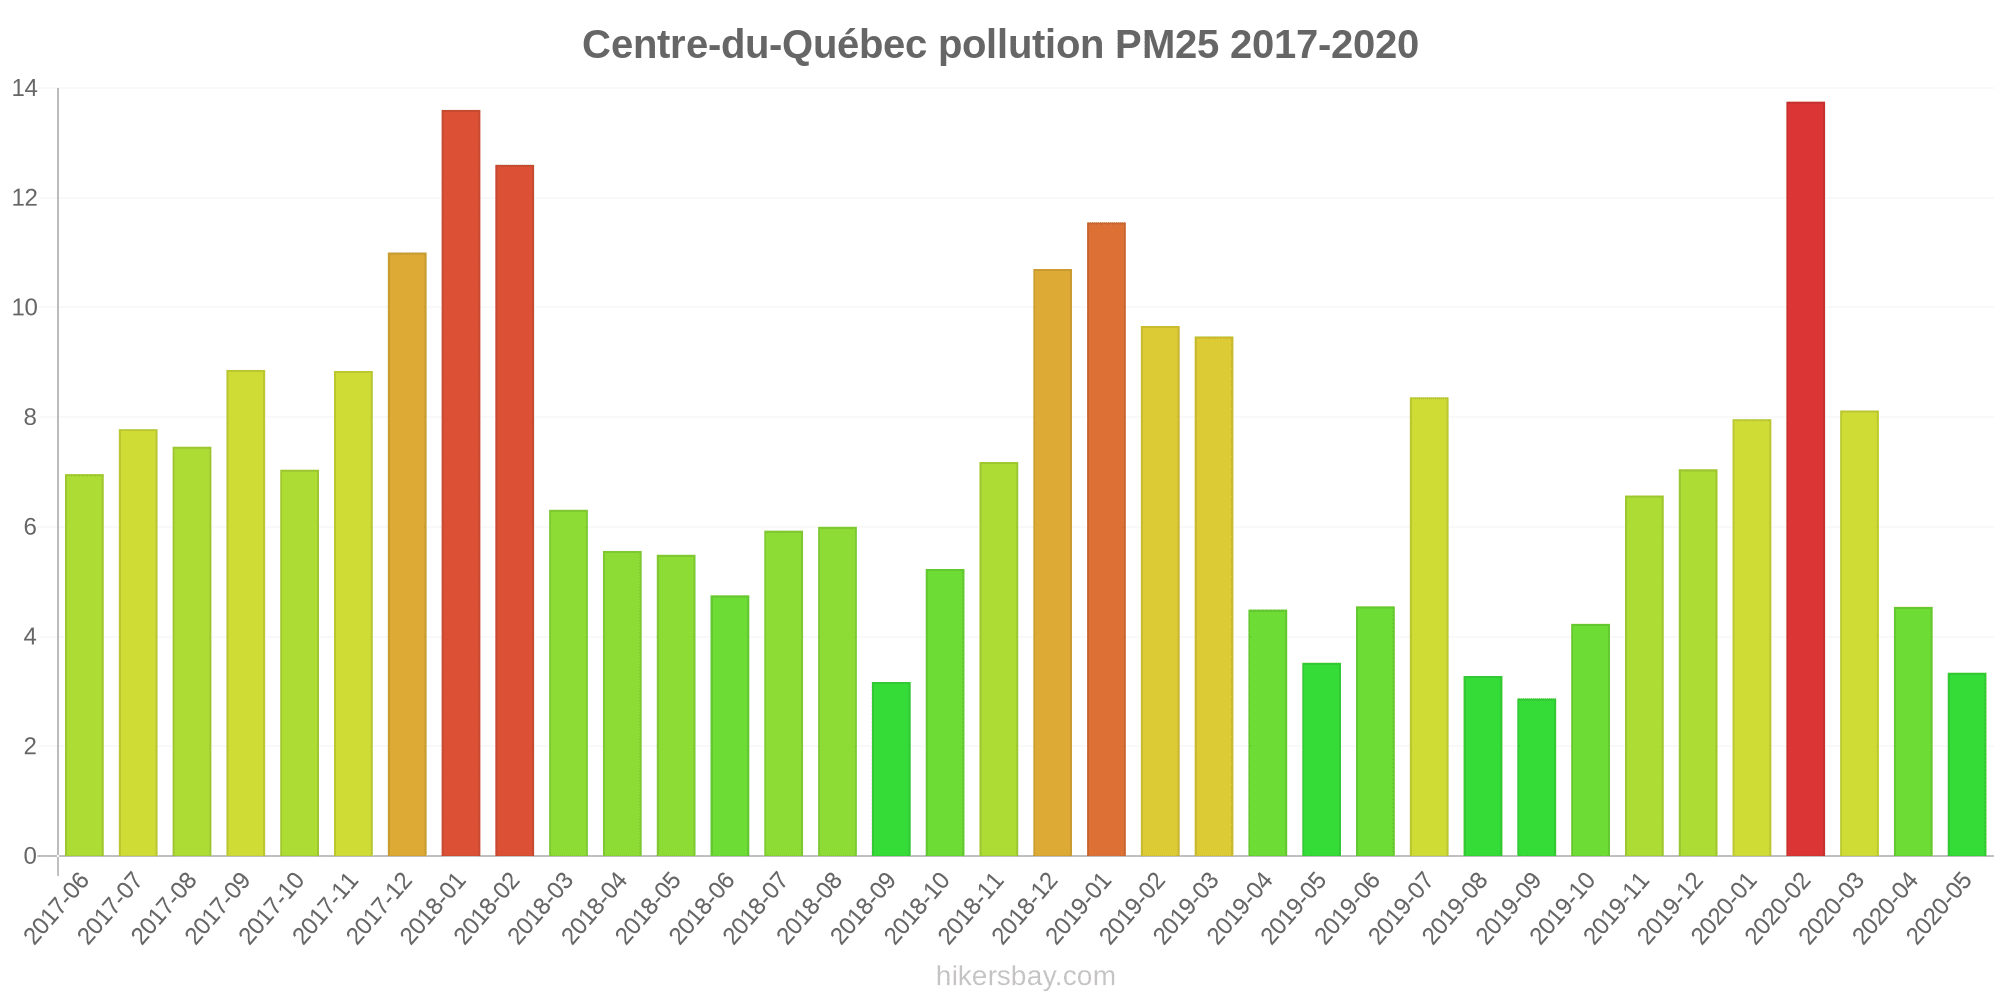
| index | 2020-05 | 2020-04 | 2020-03 | 2020-02 | 2020-01 | 2019-12 | 2019-11 | 2019-10 | 2019-09 | 2019-08 | 2019-07 | 2019-06 | 2019-05 | 2019-04 | 2019-03 | 2019-02 | 2019-01 | 2018-12 | 2018-11 | 2018-10 | 2018-09 | 2018-08 | 2018-07 | 2018-06 | 2018-05 | 2018-04 | 2018-03 | 2018-02 | 2018-01 | 2017-12 | 2017-11 | 2017-10 | 2017-09 | 2017-08 | 2017-07 | 2017-06 | 2017-05 | 2017-04 | 2016-09 | 2016-08 | 2016-05 | 2016-03 |
|---|---|---|---|---|---|---|---|---|---|---|---|---|---|---|---|---|---|---|---|---|---|---|---|---|---|---|---|---|---|---|---|---|---|---|---|---|---|---|---|---|---|---|
| pm25 | 3.3 (Good) | 4.5 (Good) | 8.1 (Good) | 14 (Moderate) | 8 (Good) | 7 (Good) | 6.6 (Good) | 4.2 (Good) | 2.9 (Good) | 3.3 (Good) | 8.4 (Good) | 4.5 (Good) | 3.5 (Good) | 4.5 (Good) | 9.5 (Good) | 9.7 (Good) | 12 (Good) | 11 (Good) | 7.2 (Good) | 5.2 (Good) | 3.2 (Good) | 6 (Good) | 5.9 (Good) | 4.8 (Good) | 5.5 (Good) | 5.6 (Good) | 6.3 (Good) | 13 (Good) | 14 (Moderate) | 11 (Good) | 8.8 (Good) | 7 (Good) | 8.9 (Good) | 7.5 (Good) | 7.8 (Good) | 7 (Good) | - (Good) | - (Good) | - (Good) | - (Good) | - (Good) | - (Good) |
| o3:ppm | 0.03 (Good) | 0.04 (Good) | 0.04 (Good) | 0.03 (Good) | 0.03 (Good) | 0.03 (Good) | 0.03 (Good) | 0.02 (Good) | 0.02 (Good) | 0.02 (Good) | 0.03 (Good) | 0.03 (Good) | 0.03 (Good) | 0.04 (Good) | 0.04 (Good) | 0.04 (Good) | 0.03 (Good) | 0.03 (Good) | 0.03 (Good) | 0.02 (Good) | 0.02 (Good) | 0.03 (Good) | 0.03 (Good) | 0.03 (Good) | 0.04 (Good) | 0.04 (Good) | 0.04 (Good) | 0.04 (Good) | 0.03 (Good) | 0.03 (Good) | 0.03 (Good) | 0.03 (Good) | 0.02 (Good) | 0.02 (Good) | 0.03 (Good) | 0.03 (Good) | 0.03 (Good) | 0.04 (Good) | 0.02 (Good) | 0.03 (Good) | 0.05 (Good) | 0.04 (Good) |
Verde e parchi in città
Centre-du-Québec 88%
Stati Uniti D'America: 70% Venezuela: 41% Islanda: 72%particolato PM2.5
Centre-du-Québec 10 (Good)
Il piacere di trascorrere del tempo in città
Centre-du-Québec 100%
Stati Uniti D'America: 75% Bahamas: 53% Venezuela: 41% Islanda: 89%particolato PM10
Centre-du-Québec 18 (Good)
Inquinamento dell'aria
Centre-du-Québec 9,4%
Stati Uniti D'America: 29% Bahamas: 52% Venezuela: 59% Islanda: 13%Smaltimento dei rifiuti
Centre-du-Québec 88%
Stati Uniti D'America: 71% Bahamas: 29% Venezuela: 18% Islanda: 79%Disponibilità e qualità dell'acqua potabile
Centre-du-Québec 100%
Stati Uniti D'America: 71% Bahamas: 55% Venezuela: 28% Islanda: 96%Pulizia e ordine
Centre-du-Québec 75%
Stati Uniti D'America: 60% Bahamas: 35% Venezuela: 22% Islanda: 75%Rumore e inquinamento luminoso
Centre-du-Québec 63%
Stati Uniti D'America: 47% Bahamas: 39% Venezuela: 47% Islanda: 23%Inquinamento delle acque
Centre-du-Québec 38%
Stati Uniti D'America: 44% Bahamas: 58% Venezuela: 76% Islanda: 8,4%O3 0.04 (Buono)
ozono (O3)PM2,5 1.5 (Buono)
polvere di particolato (PM2.5)Tingwick
| index | 2024-04-16 | 2024-04-15 | 2024-04-14 | 2024-04-13 | 2024-04-12 | 2024-04-11 | 2024-04-10 | 2024-04-09 |
|---|---|---|---|---|---|---|---|---|
| o3 | 0.04 | 0.04 | 0.04 | 0.03 | 0.04 | 0.04 | 0.05 | 0.04 |
| pm25 | 2.1 | 4 | 1.6 | 1.2 | 1.3 | 3.5 | 3.6 | 2.9 |
Bécancour (Aréna)

| index | 2020-05 | 2020-04 | 2020-03 | 2020-02 | 2020-01 | 2019-12 | 2019-11 | 2019-10 | 2019-09 | 2019-08 | 2019-07 | 2019-06 | 2019-05 | 2019-04 | 2019-03 | 2019-02 | 2019-01 | 2018-12 | 2018-11 | 2018-10 | 2018-09 | 2018-08 | 2018-07 | 2018-06 | 2018-05 | 2018-04 | 2018-03 | 2018-02 | 2018-01 | 2017-12 | 2017-11 | 2017-10 | 2017-09 | 2017-08 | 2017-07 | 2017-06 |
|---|---|---|---|---|---|---|---|---|---|---|---|---|---|---|---|---|---|---|---|---|---|---|---|---|---|---|---|---|---|---|---|---|---|---|---|---|
| pm25 | 3.6 | 4.6 | 11 | 16 | 8.7 | 7.2 | 6.6 | 4.3 | 3.3 | 4 | 9.2 | 5.3 | 3.7 | 4.3 | 9 | 9.4 | 12 | 11 | 6.3 | 5.4 | 3.6 | 6.5 | 6.2 | 4.7 | 5.4 | 5.1 | 4.5 | 11 | 14 | 11 | 8.2 | 6.6 | 9.4 | 7.8 | 7.5 | 6.5 |
Tingwick
| index | 2020-05 | 2020-04 | 2020-03 | 2020-02 | 2020-01 | 2019-12 | 2019-11 | 2019-10 | 2019-09 | 2019-08 | 2019-07 | 2019-06 | 2019-05 | 2019-04 | 2019-03 | 2019-02 | 2019-01 | 2018-12 | 2018-11 | 2018-10 | 2018-09 | 2018-08 | 2018-07 | 2018-06 | 2018-05 | 2018-04 | 2018-03 | 2018-02 | 2018-01 | 2017-12 | 2017-11 | 2017-10 | 2017-09 | 2017-08 | 2017-07 | 2017-06 | 2017-05 | 2017-04 | 2016-09 | 2016-08 | 2016-05 | 2016-03 |
|---|---|---|---|---|---|---|---|---|---|---|---|---|---|---|---|---|---|---|---|---|---|---|---|---|---|---|---|---|---|---|---|---|---|---|---|---|---|---|---|---|---|---|
| o3:ppm | 0.03 | 0.04 | 0.04 | 0.03 | 0.03 | 0.03 | 0.03 | 0.02 | 0.02 | 0.03 | 0.03 | 0.03 | 0.03 | 0.04 | 0.04 | 0.04 | 0.03 | 0.03 | 0.03 | 0.02 | 0.02 | 0.03 | 0.03 | 0.03 | 0.04 | 0.04 | 0.04 | 0.04 | 0.03 | 0.03 | 0.03 | 0.03 | 0.03 | 0.03 | 0.03 | 0.03 | 0.03 | 0.04 | 0.02 | 0.03 | 0.05 | 0.04 |
Zéphirin
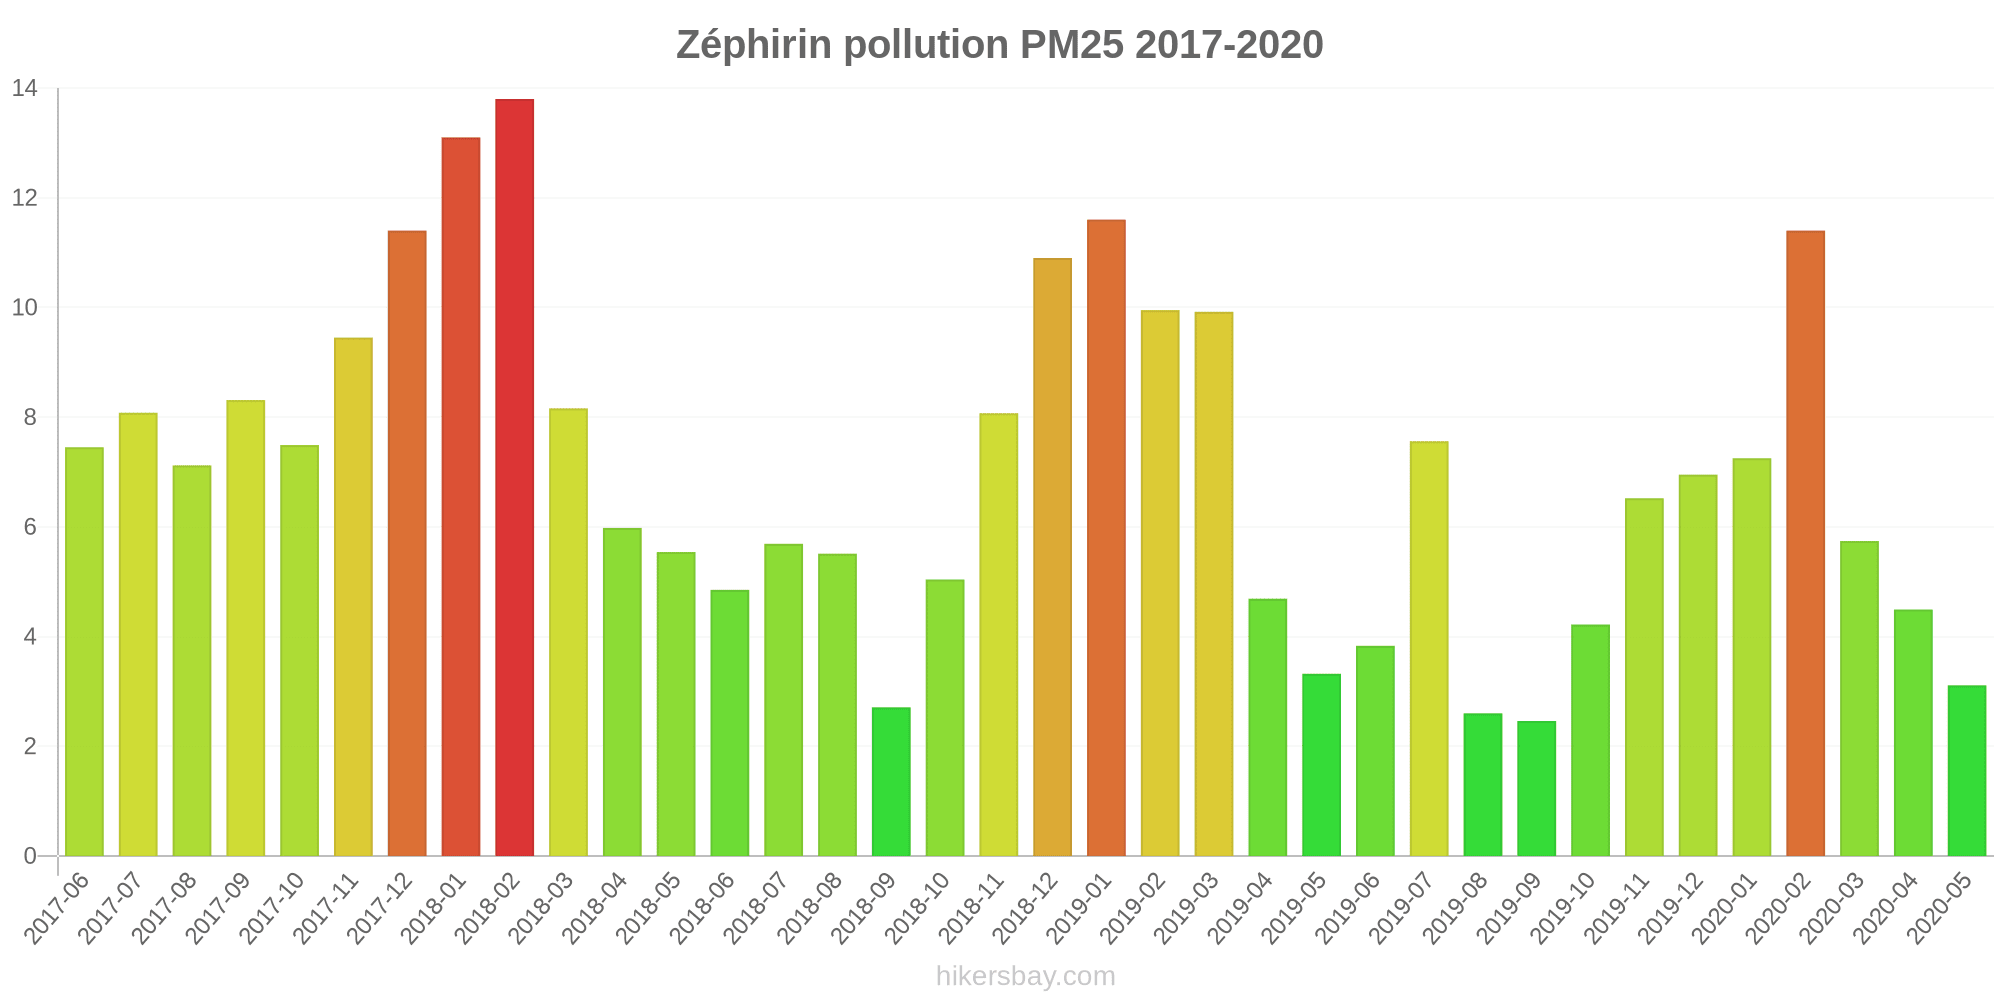
| index | 2020-05 | 2020-04 | 2020-03 | 2020-02 | 2020-01 | 2019-12 | 2019-11 | 2019-10 | 2019-09 | 2019-08 | 2019-07 | 2019-06 | 2019-05 | 2019-04 | 2019-03 | 2019-02 | 2019-01 | 2018-12 | 2018-11 | 2018-10 | 2018-09 | 2018-08 | 2018-07 | 2018-06 | 2018-05 | 2018-04 | 2018-03 | 2018-02 | 2018-01 | 2017-12 | 2017-11 | 2017-10 | 2017-09 | 2017-08 | 2017-07 | 2017-06 |
|---|---|---|---|---|---|---|---|---|---|---|---|---|---|---|---|---|---|---|---|---|---|---|---|---|---|---|---|---|---|---|---|---|---|---|---|---|
| o3:ppm | 0.03 | 0.04 | 0.04 | 0.03 | 0.03 | 0.03 | 0.02 | 0.02 | 0.02 | 0.02 | 0.03 | 0.03 | 0.03 | 0.04 | 0.04 | 0.04 | 0.02 | 0.02 | 0.03 | 0.01 | 0.02 | 0.03 | 0.03 | 0.03 | 0.03 | 0.04 | 0.05 | 0.04 | 0.03 | 0.03 | 0.03 | 0.02 | 0.02 | 0.02 | 0.02 | 0.03 |
| pm25 | 3.1 | 4.5 | 5.7 | 11 | 7.3 | 7 | 6.5 | 4.2 | 2.5 | 2.6 | 7.6 | 3.8 | 3.3 | 4.7 | 9.9 | 9.9 | 12 | 11 | 8.1 | 5 | 2.7 | 5.5 | 5.7 | 4.8 | 5.5 | 6 | 8.2 | 14 | 13 | 11 | 9.4 | 7.5 | 8.3 | 7.1 | 8.1 | 7.5 |