Inquinamento atmosferico in Vernon: indice di qualità dell'aria in tempo reale e allarme smog.
Previsioni di inquinamento e qualità dell'aria per Vernon. Oggi è giovedì 18 giugno 2026. Per Vernon sono stati registrati i seguenti valori di inquinamento atmosferico:- ozono (O3) - 0 (Buono)
- polveri sospese di particolato (PM10) - 4 (Buono)
- biossido di azoto (NO2) - 0 (Buono)
- polvere di particolato (PM2.5) - 2 (Buono)

Qual è la qualità dell'aria Vernon oggi? L'aria è inquinata Vernon? C'è smog?
Come è il livello O3 oggi in Vernon? (ozono (O3))
0 (Buono)
Qual è il livello di PM10 oggi in Vernon? (polveri sospese di particolato (PM10))
L'attuale livello di particolato PM10 in Vernon è:
4 (Buono)
Quanto è alto il livello di NO2? (biossido di azoto (NO2))
0 (Buono)
Qual è il livello attuale di PM2.5 in Vernon? (polvere di particolato (PM2.5))
Il livello PM2.5 di oggi è:
2 (Buono)
Per fare un confronto, il livello più alto di PM2,5 in Vernon negli ultimi 7 giorni è stato: 8 (domenica 14 aprile 2024) e il più basso: 2 (martedì 16 aprile 2024).
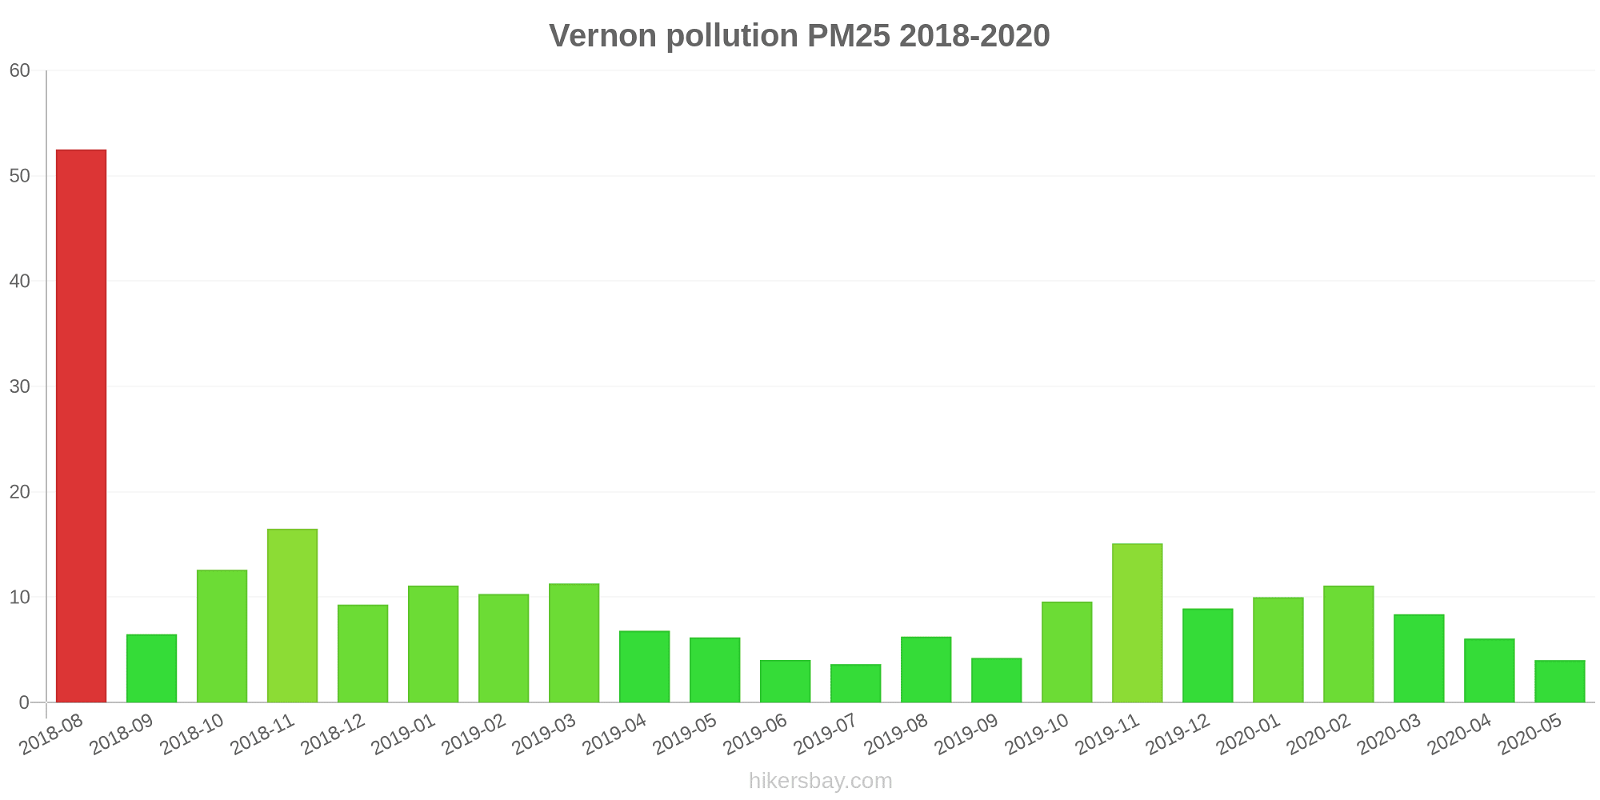
Sono stati registrati i valori PM2,5 più alti: 53 (agosto 2018).
Il più basso livello di inquinamento da particolato PM2.5 si verifica nel mese: luglio (3.6).
Dati correnti martedì 16 aprile 2024, 11:00
O3 0 (Buono)
PM10 4 (Buono)
NO2 0 (Buono)
0 (Buono)
PM2,5 2 (Buono)
Dati sull'inquinamento atmosferico degli ultimi giorni Vernon
index
2024-04-09
2024-04-10
2024-04-11
2024-04-12
2024-04-13
2024-04-14
2024-04-15
2024-04-16
no2
0
Good
0
Good
0
Good
0
Good
0
Good
0
Good
0
Good
0
Good
o3
0
Good
0
Good
0
Good
0
Good
0
Good
0
Good
0
Good
0
Good
pm25
4
Good
5
Good
7
Good
5
Good
6
Good
8
Good
5
Good
2
Good
no
0
Good
0
Good
0
Good
0
Good
0
Good
0
Good
0
Good
0
Good
pm10
15
Good
19
Good
30
Moderate
10
Good
17
Good
16
Good
14
Good
9
Good
data source »
Inquinamento atmosferico in Vernon da marzo 2016 a maggio 2020
index
2020-05
2020-04
2020-03
2020-02
2020-01
2019-12
2019-11
2019-10
2019-09
2019-08
2019-07
2019-06
2019-05
2019-04
2019-03
2019-02
2019-01
2018-12
2018-11
2018-10
2018-09
2018-08
2018-07
2018-06
2018-05
2018-04
2018-03
2018-02
2018-01
2017-12
2017-11
2017-10
2017-09
2017-08
2017-07
2017-06
2017-05
2017-04
2017-03
2017-02
2017-01
2016-12
2016-11
2016-10
2016-09
2016-08
2016-07
2016-06
2016-05
2016-04
2016-03
o3:ppm
0.03 (Good)
0.03 (Good)
0.03 (Good)
0.02 (Good)
0.01 (Good)
0.01 (Good)
0.01 (Good)
0.02 (Good)
0.02 (Good)
0.03 (Good)
0.02 (Good)
0.03 (Good)
0.03 (Good)
0.03 (Good)
0.03 (Good)
0.02 (Good)
0.01 (Good)
0.01 (Good)
0.01 (Good)
0.01 (Good)
0.01 (Good)
0.02 (Good)
0.02 (Good)
0.03 (Good)
0.03 (Good)
0.03 (Good)
0.03 (Good)
0.02 (Good)
0.01 (Good)
0.01 (Good)
0.01 (Good)
0.01 (Good)
0.02 (Good)
0.03 (Good)
0.03 (Good)
0.03 (Good)
0.03 (Good)
0.03 (Good)
0.02 (Good)
0.02 (Good)
0.01 (Good)
0.01 (Good)
0.01 (Good)
0.01 (Good)
0.01 (Good)
0.02 (Good)
0.02 (Good)
0.03 (Good)
0.03 (Good)
0.03 (Good)
0.02 (Good)
pm25
4 (Good)
6.1 (Good)
8.4 (Good)
11 (Good)
10 (Good)
8.9 (Good)
15 (Moderate)
9.6 (Good)
4.2 (Good)
6.3 (Good)
3.6 (Good)
4 (Good)
6.2 (Good)
6.8 (Good)
11 (Good)
10 (Good)
11 (Good)
9.3 (Good)
17 (Moderate)
13 (Good)
6.5 (Good)
53 (Unhealthy for Sensitive Groups)
- (Good)
- (Good)
- (Good)
- (Good)
- (Good)
- (Good)
- (Good)
- (Good)
- (Good)
- (Good)
- (Good)
- (Good)
- (Good)
- (Good)
- (Good)
- (Good)
- (Good)
- (Good)
- (Good)
- (Good)
- (Good)
- (Good)
- (Good)
- (Good)
- (Good)
- (Good)
- (Good)
- (Good)
- (Good)
data source »
Qualità della vita in Vernon
Verde e parchi in città
Vernon
78%
Stati Uniti D'America: 70%
Venezuela: 41%
Islanda: 72%
particolato PM2.5
Vernon
9 (Good)
Il piacere di trascorrere del tempo in città
Vernon
79%
Stati Uniti D'America: 75%
Bahamas: 53%
Venezuela: 41%
Islanda: 89%
particolato PM10
Vernon
16 (Good)
Inquinamento dell'aria
Vernon
27%
Stati Uniti D'America: 29%
Bahamas: 52%
Venezuela: 59%
Islanda: 13%
Smaltimento dei rifiuti
Vernon
78%
Stati Uniti D'America: 71%
Bahamas: 29%
Venezuela: 18%
Islanda: 79%
Disponibilità e qualità dell'acqua potabile
Vernon
70%
Stati Uniti D'America: 71%
Bahamas: 55%
Venezuela: 28%
Islanda: 96%
Pulizia e ordine
Vernon
73%
Stati Uniti D'America: 60%
Bahamas: 35%
Venezuela: 22%
Islanda: 75%
Rumore e inquinamento luminoso
Vernon
53%
Stati Uniti D'America: 47%
Bahamas: 39%
Venezuela: 47%
Islanda: 23%
Inquinamento delle acque
Vernon
50%
Stati Uniti D'America: 44%
Bahamas: 58%
Venezuela: 76%
Islanda: 8,4%
Source: Numbeo
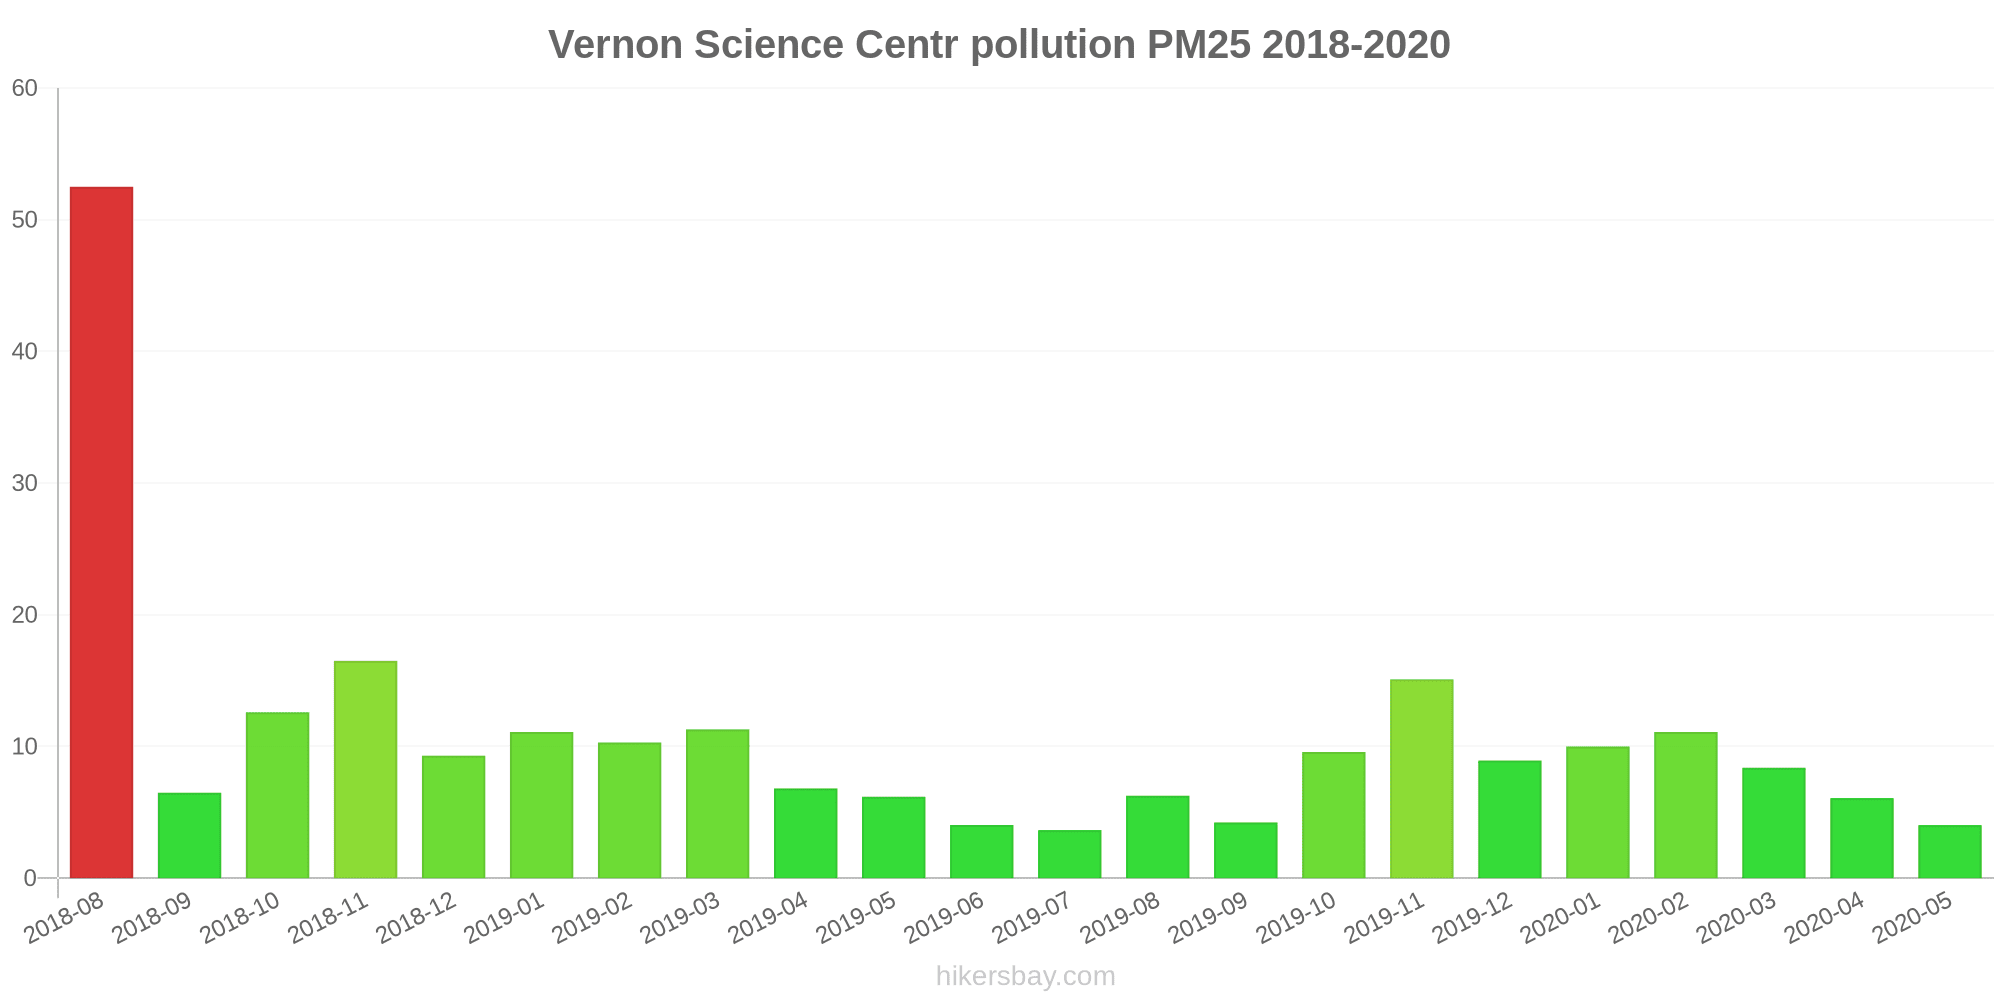
Vernon Science Centr
martedì 16 aprile 2024, 11:00
O3 0.04 (Buono)
ozono (O3)
PM10 4 (Buono)
polveri sospese di particolato (PM10)
NO2 0 (Buono)
biossido di azoto (NO2)
0 (Buono)
index_name_no
PM2,5 1.7 (Buono)
polvere di particolato (PM2.5)
Vernon Science Centr
index
2024-04-16
2024-04-15
2024-04-14
2024-04-13
2024-04-12
2024-04-11
2024-04-10
2024-04-09
no2
0
0
0.01
0.01
0.01
0.01
0.01
0.01
o3
0.05
0.04
0.03
0.02
0.03
0.02
0.03
0.03
pm25
2.2
5.1
7.7
5.5
4.8
7.2
5.3
4.1
no
0
0
0
0
0
0.01
0.01
0
pm10
8.7
14
16
17
10
30
19
15
Vernon Science Centr
2016-03 2020-05

index
2020-05
2020-04
2020-03
2020-02
2020-01
2019-12
2019-11
2019-10
2019-09
2019-08
2019-07
2019-06
2019-05
2019-04
2019-03
2019-02
2019-01
2018-12
2018-11
2018-10
2018-09
2018-08
2018-07
2018-06
2018-05
2018-04
2018-03
2018-02
2018-01
2017-12
2017-11
2017-10
2017-09
2017-08
2017-07
2017-06
2017-05
2017-04
2017-03
2017-02
2017-01
2016-12
2016-11
2016-10
2016-09
2016-08
2016-07
2016-06
2016-05
2016-04
2016-03
o3:ppm
0.03
0.03
0.03
0.02
0.01
0.01
0.01
0.02
0.02
0.03
0.02
0.03
0.03
0.03
0.03
0.02
0.01
0.01
0.01
0.01
0.01
0.02
0.02
0.03
0.03
0.03
0.03
0.02
0.01
0.01
0.01
0.01
0.02
0.03
0.03
0.03
0.03
0.03
0.02
0.02
0.01
0.01
0.01
0.01
0.01
0.02
0.02
0.03
0.03
0.03
0.02
pm25
4
6.1
8.4
11
10
8.9
15
9.6
4.2
6.3
3.6
4
6.2
6.8
11
10
11
9.3
17
13
6.5
53
-
-
-
-
-
-
-
-
-
-
-
-
-
-
-
-
-
-
-
-
-
-
-
-
-
-
-
-
-
* Pollution data source:
https://openaq.org
(AirNow)
The data is licensed under CC-By 4.0
O3 0 (Buono)
PM10 4 (Buono)
NO2 0 (Buono)
0 (Buono)
PM2,5 2 (Buono)
Dati sull'inquinamento atmosferico degli ultimi giorni Vernon
| index | 2024-04-09 | 2024-04-10 | 2024-04-11 | 2024-04-12 | 2024-04-13 | 2024-04-14 | 2024-04-15 | 2024-04-16 |
|---|---|---|---|---|---|---|---|---|
| no2 | 0 Good |
0 Good |
0 Good |
0 Good |
0 Good |
0 Good |
0 Good |
0 Good |
| o3 | 0 Good |
0 Good |
0 Good |
0 Good |
0 Good |
0 Good |
0 Good |
0 Good |
| pm25 | 4 Good |
5 Good |
7 Good |
5 Good |
6 Good |
8 Good |
5 Good |
2 Good |
| no | 0 Good |
0 Good |
0 Good |
0 Good |
0 Good |
0 Good |
0 Good |
0 Good |
| pm10 | 15 Good |
19 Good |
30 Moderate |
10 Good |
17 Good |
16 Good |
14 Good |
9 Good |

| index | 2020-05 | 2020-04 | 2020-03 | 2020-02 | 2020-01 | 2019-12 | 2019-11 | 2019-10 | 2019-09 | 2019-08 | 2019-07 | 2019-06 | 2019-05 | 2019-04 | 2019-03 | 2019-02 | 2019-01 | 2018-12 | 2018-11 | 2018-10 | 2018-09 | 2018-08 | 2018-07 | 2018-06 | 2018-05 | 2018-04 | 2018-03 | 2018-02 | 2018-01 | 2017-12 | 2017-11 | 2017-10 | 2017-09 | 2017-08 | 2017-07 | 2017-06 | 2017-05 | 2017-04 | 2017-03 | 2017-02 | 2017-01 | 2016-12 | 2016-11 | 2016-10 | 2016-09 | 2016-08 | 2016-07 | 2016-06 | 2016-05 | 2016-04 | 2016-03 |
|---|---|---|---|---|---|---|---|---|---|---|---|---|---|---|---|---|---|---|---|---|---|---|---|---|---|---|---|---|---|---|---|---|---|---|---|---|---|---|---|---|---|---|---|---|---|---|---|---|---|---|---|
| o3:ppm | 0.03 (Good) | 0.03 (Good) | 0.03 (Good) | 0.02 (Good) | 0.01 (Good) | 0.01 (Good) | 0.01 (Good) | 0.02 (Good) | 0.02 (Good) | 0.03 (Good) | 0.02 (Good) | 0.03 (Good) | 0.03 (Good) | 0.03 (Good) | 0.03 (Good) | 0.02 (Good) | 0.01 (Good) | 0.01 (Good) | 0.01 (Good) | 0.01 (Good) | 0.01 (Good) | 0.02 (Good) | 0.02 (Good) | 0.03 (Good) | 0.03 (Good) | 0.03 (Good) | 0.03 (Good) | 0.02 (Good) | 0.01 (Good) | 0.01 (Good) | 0.01 (Good) | 0.01 (Good) | 0.02 (Good) | 0.03 (Good) | 0.03 (Good) | 0.03 (Good) | 0.03 (Good) | 0.03 (Good) | 0.02 (Good) | 0.02 (Good) | 0.01 (Good) | 0.01 (Good) | 0.01 (Good) | 0.01 (Good) | 0.01 (Good) | 0.02 (Good) | 0.02 (Good) | 0.03 (Good) | 0.03 (Good) | 0.03 (Good) | 0.02 (Good) |
| pm25 | 4 (Good) | 6.1 (Good) | 8.4 (Good) | 11 (Good) | 10 (Good) | 8.9 (Good) | 15 (Moderate) | 9.6 (Good) | 4.2 (Good) | 6.3 (Good) | 3.6 (Good) | 4 (Good) | 6.2 (Good) | 6.8 (Good) | 11 (Good) | 10 (Good) | 11 (Good) | 9.3 (Good) | 17 (Moderate) | 13 (Good) | 6.5 (Good) | 53 (Unhealthy for Sensitive Groups) | - (Good) | - (Good) | - (Good) | - (Good) | - (Good) | - (Good) | - (Good) | - (Good) | - (Good) | - (Good) | - (Good) | - (Good) | - (Good) | - (Good) | - (Good) | - (Good) | - (Good) | - (Good) | - (Good) | - (Good) | - (Good) | - (Good) | - (Good) | - (Good) | - (Good) | - (Good) | - (Good) | - (Good) | - (Good) |
Verde e parchi in città
Vernon 78%
Stati Uniti D'America: 70% Venezuela: 41% Islanda: 72%particolato PM2.5
Vernon 9 (Good)
Il piacere di trascorrere del tempo in città
Vernon 79%
Stati Uniti D'America: 75% Bahamas: 53% Venezuela: 41% Islanda: 89%particolato PM10
Vernon 16 (Good)
Inquinamento dell'aria
Vernon 27%
Stati Uniti D'America: 29% Bahamas: 52% Venezuela: 59% Islanda: 13%Smaltimento dei rifiuti
Vernon 78%
Stati Uniti D'America: 71% Bahamas: 29% Venezuela: 18% Islanda: 79%Disponibilità e qualità dell'acqua potabile
Vernon 70%
Stati Uniti D'America: 71% Bahamas: 55% Venezuela: 28% Islanda: 96%Pulizia e ordine
Vernon 73%
Stati Uniti D'America: 60% Bahamas: 35% Venezuela: 22% Islanda: 75%Rumore e inquinamento luminoso
Vernon 53%
Stati Uniti D'America: 47% Bahamas: 39% Venezuela: 47% Islanda: 23%Inquinamento delle acque
Vernon 50%
Stati Uniti D'America: 44% Bahamas: 58% Venezuela: 76% Islanda: 8,4%O3 0.04 (Buono)
ozono (O3)PM10 4 (Buono)
polveri sospese di particolato (PM10)NO2 0 (Buono)
biossido di azoto (NO2)0 (Buono)
index_name_noPM2,5 1.7 (Buono)
polvere di particolato (PM2.5)Vernon Science Centr
| index | 2024-04-16 | 2024-04-15 | 2024-04-14 | 2024-04-13 | 2024-04-12 | 2024-04-11 | 2024-04-10 | 2024-04-09 |
|---|---|---|---|---|---|---|---|---|
| no2 | 0 | 0 | 0.01 | 0.01 | 0.01 | 0.01 | 0.01 | 0.01 |
| o3 | 0.05 | 0.04 | 0.03 | 0.02 | 0.03 | 0.02 | 0.03 | 0.03 |
| pm25 | 2.2 | 5.1 | 7.7 | 5.5 | 4.8 | 7.2 | 5.3 | 4.1 |
| no | 0 | 0 | 0 | 0 | 0 | 0.01 | 0.01 | 0 |
| pm10 | 8.7 | 14 | 16 | 17 | 10 | 30 | 19 | 15 |
Vernon Science Centr
| index | 2020-05 | 2020-04 | 2020-03 | 2020-02 | 2020-01 | 2019-12 | 2019-11 | 2019-10 | 2019-09 | 2019-08 | 2019-07 | 2019-06 | 2019-05 | 2019-04 | 2019-03 | 2019-02 | 2019-01 | 2018-12 | 2018-11 | 2018-10 | 2018-09 | 2018-08 | 2018-07 | 2018-06 | 2018-05 | 2018-04 | 2018-03 | 2018-02 | 2018-01 | 2017-12 | 2017-11 | 2017-10 | 2017-09 | 2017-08 | 2017-07 | 2017-06 | 2017-05 | 2017-04 | 2017-03 | 2017-02 | 2017-01 | 2016-12 | 2016-11 | 2016-10 | 2016-09 | 2016-08 | 2016-07 | 2016-06 | 2016-05 | 2016-04 | 2016-03 |
|---|---|---|---|---|---|---|---|---|---|---|---|---|---|---|---|---|---|---|---|---|---|---|---|---|---|---|---|---|---|---|---|---|---|---|---|---|---|---|---|---|---|---|---|---|---|---|---|---|---|---|---|
| o3:ppm | 0.03 | 0.03 | 0.03 | 0.02 | 0.01 | 0.01 | 0.01 | 0.02 | 0.02 | 0.03 | 0.02 | 0.03 | 0.03 | 0.03 | 0.03 | 0.02 | 0.01 | 0.01 | 0.01 | 0.01 | 0.01 | 0.02 | 0.02 | 0.03 | 0.03 | 0.03 | 0.03 | 0.02 | 0.01 | 0.01 | 0.01 | 0.01 | 0.02 | 0.03 | 0.03 | 0.03 | 0.03 | 0.03 | 0.02 | 0.02 | 0.01 | 0.01 | 0.01 | 0.01 | 0.01 | 0.02 | 0.02 | 0.03 | 0.03 | 0.03 | 0.02 |
| pm25 | 4 | 6.1 | 8.4 | 11 | 10 | 8.9 | 15 | 9.6 | 4.2 | 6.3 | 3.6 | 4 | 6.2 | 6.8 | 11 | 10 | 11 | 9.3 | 17 | 13 | 6.5 | 53 | - | - | - | - | - | - | - | - | - | - | - | - | - | - | - | - | - | - | - | - | - | - | - | - | - | - | - | - | - |