Polusi udara di Crow Wing: indeks kualitas udara real-time dan siaga asap.
Perkiraan kualitas polusi dan udara untuk Crow Wing. Hari ini Rabu, 24 Juni 2026. Nilai polusi udara berikut telah tercatat untuk Crow Wing:- ozon (O3) - 0 (Bagus)
- partikulat Matter (PM 2.5) debu - 2 (Bagus)

Apa kualitas udara di Crow Wing hari ini? Apakah udara tercemar di Crow Wing?. Apakah ada Smog?
Bagaimana tingkat O3 hari ini di Crow Wing? (ozon (O3))
0 (Bagus)
Apa tingkat saat PM 2,5 in Crow Wing? (partikulat Matter (PM 2.5) debu)
Hari ini PM 2.5 tingkat:
2 (Bagus)
Sebagai perbandingan, tingkat tertinggi PM 2,5 in Crow Wing dalam 7 hari terakhir adalah: 8 (Rabu, 10 April 2024) dan Terendah: 2 (Jumat, 12 April 2024).
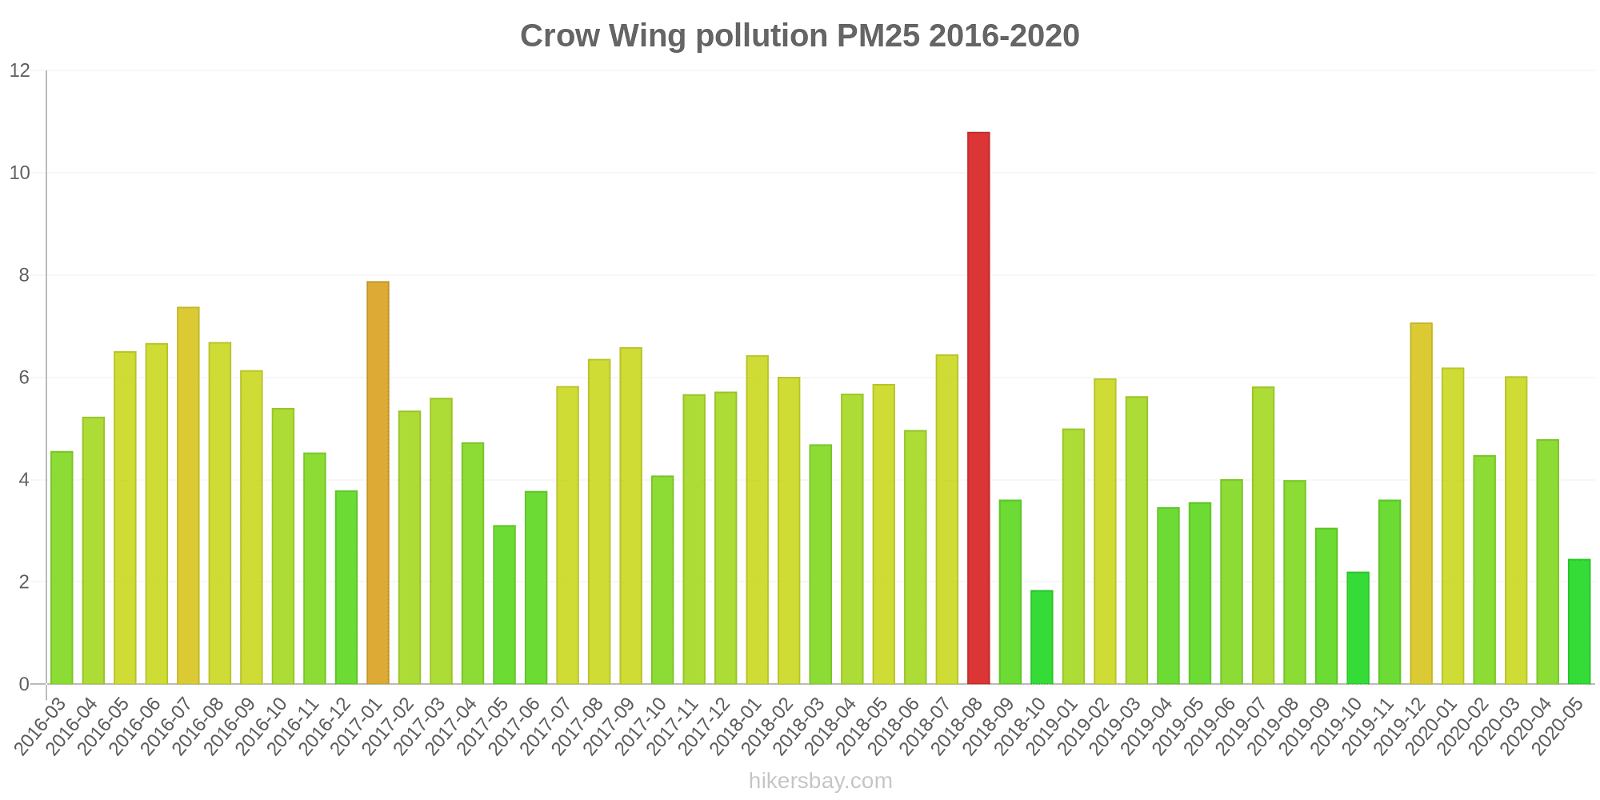
Nilai tertinggi PM 2.5 direkam: 11 (Agustus 2018).
Tingkat terendah dari partikulat Matter PM 2.5 polusi terjadi di bulan: Oktober (1.8).
Data saat ini Selasa, 16 April 2024 10.00
O3 0 (Bagus)
PM2,5 2 (Bagus)
Data tentang polusi udara dari beberapa hari terakhir di Crow Wing
index
2024-04-09
2024-04-10
2024-04-11
2024-04-12
2024-04-13
2024-04-14
2024-04-15
2024-04-16
pm25
4
Good
8
Good
4
Good
2
Good
7
Good
6
Good
4
Good
3
Good
o3
0
Good
0
Good
0
Good
0
Good
0
Good
0
Good
0
Good
0
Good
data source »
Polusi udara di Crow Wing dari Maret 2016 ke Mei 2020
index
2020-05
2020-04
2020-03
2020-02
2020-01
2019-12
2019-11
2019-10
2019-09
2019-08
2019-07
2019-06
2019-05
2019-04
2019-03
2019-02
2019-01
2018-10
2018-09
2018-08
2018-07
2018-06
2018-05
2018-04
2018-03
2018-02
2018-01
2017-12
2017-11
2017-10
2017-09
2017-08
2017-07
2017-06
2017-05
2017-04
2017-03
2017-02
2017-01
2016-12
2016-11
2016-10
2016-09
2016-08
2016-07
2016-06
2016-05
2016-04
2016-03
o3:ppm
0.04 (Good)
0.04 (Good)
0.03 (Good)
0.04 (Good)
- (Good)
- (Good)
0.02 (Good)
0.02 (Good)
0.02 (Good)
0.02 (Good)
0.03 (Good)
0.03 (Good)
0.04 (Good)
0.04 (Good)
0.04 (Good)
0.04 (Good)
- (Good)
0.02 (Good)
0.02 (Good)
0.02 (Good)
0.02 (Good)
0.02 (Good)
0.04 (Good)
0.05 (Good)
0.04 (Good)
0.04 (Good)
- (Good)
- (Good)
- (Good)
0.02 (Good)
0.02 (Good)
0.02 (Good)
0.03 (Good)
0.04 (Good)
0.04 (Good)
0.03 (Good)
0.03 (Good)
0.03 (Good)
- (Good)
- (Good)
- (Good)
0.02 (Good)
0.02 (Good)
0.02 (Good)
0.03 (Good)
0.03 (Good)
0.04 (Good)
0.04 (Good)
0.03 (Good)
pm25
2.5 (Good)
4.8 (Good)
6 (Good)
4.5 (Good)
6.2 (Good)
7.1 (Good)
3.6 (Good)
2.2 (Good)
3.1 (Good)
4 (Good)
5.8 (Good)
4 (Good)
3.6 (Good)
3.5 (Good)
5.6 (Good)
6 (Good)
5 (Good)
1.8 (Good)
3.6 (Good)
11 (Good)
6.5 (Good)
5 (Good)
5.9 (Good)
5.7 (Good)
4.7 (Good)
6 (Good)
6.4 (Good)
5.7 (Good)
5.7 (Good)
4.1 (Good)
6.6 (Good)
6.4 (Good)
5.8 (Good)
3.8 (Good)
3.1 (Good)
4.7 (Good)
5.6 (Good)
5.3 (Good)
7.9 (Good)
3.8 (Good)
4.5 (Good)
5.4 (Good)
6.1 (Good)
6.7 (Good)
7.4 (Good)
6.7 (Good)
6.5 (Good)
5.2 (Good)
4.6 (Good)
data source »
Brainerd
Selasa, 16 April 2024 10.00
O3 0.04 (Bagus)
ozon (O3)
PM2,5 2.2 (Bagus)
partikulat Matter (PM 2.5) debu
Brainerd
index
2024-04-16
2024-04-15
2024-04-14
2024-04-13
2024-04-12
2024-04-11
2024-04-10
2024-04-09
pm25
2.6
4.1
6.1
6.8
2
3.8
7.7
4.4
o3
0.04
0.04
0.05
0.04
0.04
0.04
0.03
0.03
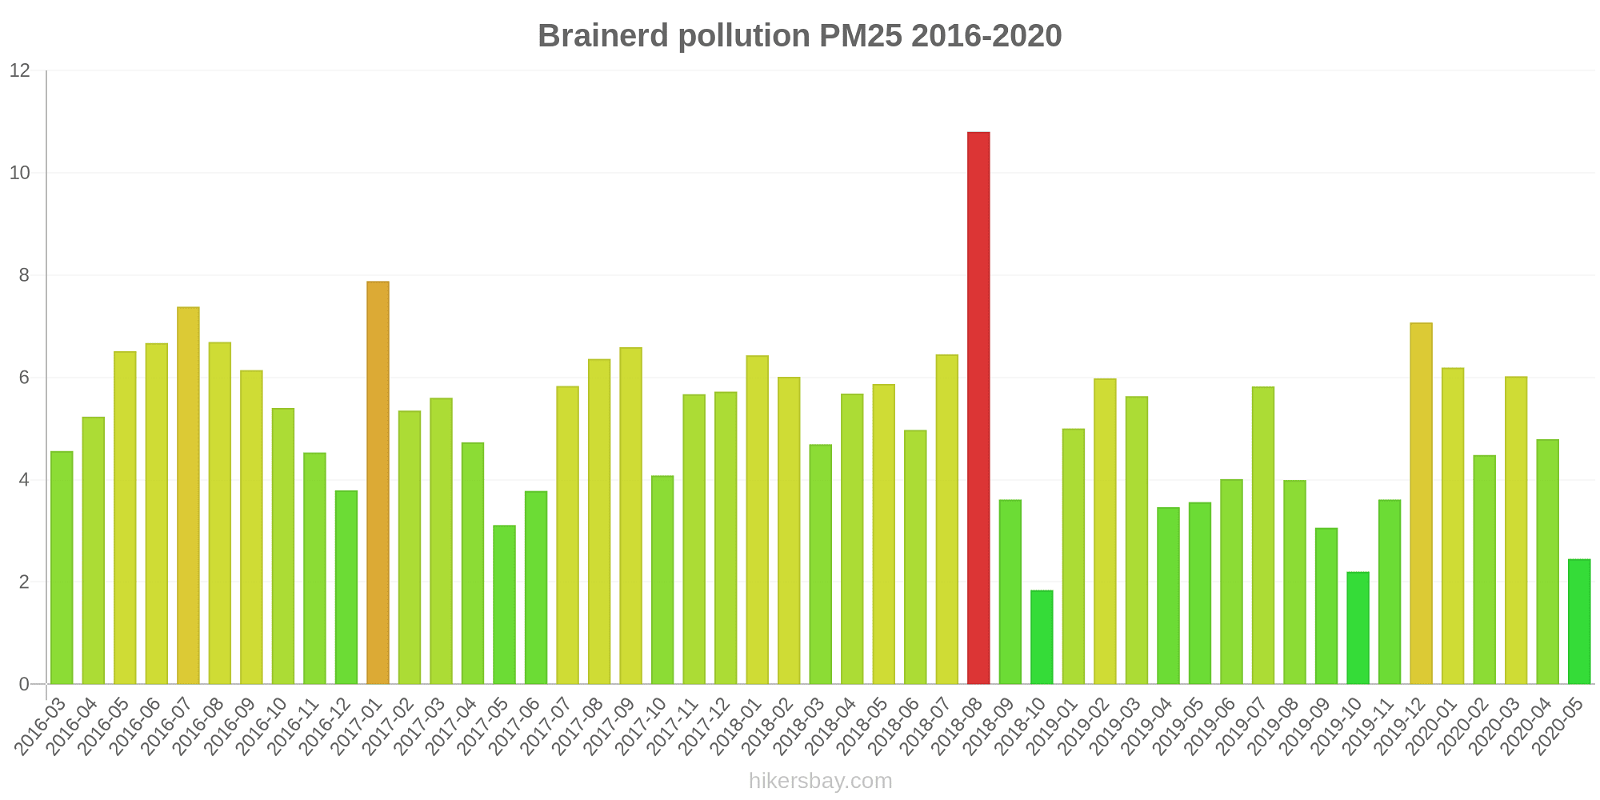
Brainerd
2016-03 2020-05
index
2020-05
2020-04
2020-03
2020-02
2020-01
2019-12
2019-11
2019-10
2019-09
2019-08
2019-07
2019-06
2019-05
2019-04
2019-03
2019-02
2019-01
2018-10
2018-09
2018-08
2018-07
2018-06
2018-05
2018-04
2018-03
2018-02
2018-01
2017-12
2017-11
2017-10
2017-09
2017-08
2017-07
2017-06
2017-05
2017-04
2017-03
2017-02
2017-01
2016-12
2016-11
2016-10
2016-09
2016-08
2016-07
2016-06
2016-05
2016-04
2016-03
pm25
2.5
4.8
6
4.5
6.2
7.1
3.6
2.2
3.1
4
5.8
4
3.6
3.5
5.6
6
5
1.8
3.6
11
6.5
5
5.9
5.7
4.7
6
6.4
5.7
5.7
4.1
6.6
6.4
5.8
3.8
3.1
4.7
5.6
5.3
7.9
3.8
4.5
5.4
6.1
6.7
7.4
6.7
6.5
5.2
4.6
o3:ppm
0.04
0.04
0.03
0.04
-
-
0.02
0.02
0.02
0.02
0.03
0.03
0.04
0.04
0.04
0.04
-
0.02
0.02
0.02
0.02
0.02
0.04
0.05
0.04
0.04
-
-
-
0.02
0.02
0.02
0.03
0.04
0.04
0.03
0.03
0.03
-
-
-
0.02
0.02
0.02
0.03
0.03
0.04
0.04
0.03
* Pollution data source:
https://openaq.org
(AirNow)
The data is licensed under CC-By 4.0
O3 0 (Bagus)
PM2,5 2 (Bagus)
Data tentang polusi udara dari beberapa hari terakhir di Crow Wing
| index | 2024-04-09 | 2024-04-10 | 2024-04-11 | 2024-04-12 | 2024-04-13 | 2024-04-14 | 2024-04-15 | 2024-04-16 |
|---|---|---|---|---|---|---|---|---|
| pm25 | 4 Good |
8 Good |
4 Good |
2 Good |
7 Good |
6 Good |
4 Good |
3 Good |
| o3 | 0 Good |
0 Good |
0 Good |
0 Good |
0 Good |
0 Good |
0 Good |
0 Good |

| index | 2020-05 | 2020-04 | 2020-03 | 2020-02 | 2020-01 | 2019-12 | 2019-11 | 2019-10 | 2019-09 | 2019-08 | 2019-07 | 2019-06 | 2019-05 | 2019-04 | 2019-03 | 2019-02 | 2019-01 | 2018-10 | 2018-09 | 2018-08 | 2018-07 | 2018-06 | 2018-05 | 2018-04 | 2018-03 | 2018-02 | 2018-01 | 2017-12 | 2017-11 | 2017-10 | 2017-09 | 2017-08 | 2017-07 | 2017-06 | 2017-05 | 2017-04 | 2017-03 | 2017-02 | 2017-01 | 2016-12 | 2016-11 | 2016-10 | 2016-09 | 2016-08 | 2016-07 | 2016-06 | 2016-05 | 2016-04 | 2016-03 |
|---|---|---|---|---|---|---|---|---|---|---|---|---|---|---|---|---|---|---|---|---|---|---|---|---|---|---|---|---|---|---|---|---|---|---|---|---|---|---|---|---|---|---|---|---|---|---|---|---|---|
| o3:ppm | 0.04 (Good) | 0.04 (Good) | 0.03 (Good) | 0.04 (Good) | - (Good) | - (Good) | 0.02 (Good) | 0.02 (Good) | 0.02 (Good) | 0.02 (Good) | 0.03 (Good) | 0.03 (Good) | 0.04 (Good) | 0.04 (Good) | 0.04 (Good) | 0.04 (Good) | - (Good) | 0.02 (Good) | 0.02 (Good) | 0.02 (Good) | 0.02 (Good) | 0.02 (Good) | 0.04 (Good) | 0.05 (Good) | 0.04 (Good) | 0.04 (Good) | - (Good) | - (Good) | - (Good) | 0.02 (Good) | 0.02 (Good) | 0.02 (Good) | 0.03 (Good) | 0.04 (Good) | 0.04 (Good) | 0.03 (Good) | 0.03 (Good) | 0.03 (Good) | - (Good) | - (Good) | - (Good) | 0.02 (Good) | 0.02 (Good) | 0.02 (Good) | 0.03 (Good) | 0.03 (Good) | 0.04 (Good) | 0.04 (Good) | 0.03 (Good) |
| pm25 | 2.5 (Good) | 4.8 (Good) | 6 (Good) | 4.5 (Good) | 6.2 (Good) | 7.1 (Good) | 3.6 (Good) | 2.2 (Good) | 3.1 (Good) | 4 (Good) | 5.8 (Good) | 4 (Good) | 3.6 (Good) | 3.5 (Good) | 5.6 (Good) | 6 (Good) | 5 (Good) | 1.8 (Good) | 3.6 (Good) | 11 (Good) | 6.5 (Good) | 5 (Good) | 5.9 (Good) | 5.7 (Good) | 4.7 (Good) | 6 (Good) | 6.4 (Good) | 5.7 (Good) | 5.7 (Good) | 4.1 (Good) | 6.6 (Good) | 6.4 (Good) | 5.8 (Good) | 3.8 (Good) | 3.1 (Good) | 4.7 (Good) | 5.6 (Good) | 5.3 (Good) | 7.9 (Good) | 3.8 (Good) | 4.5 (Good) | 5.4 (Good) | 6.1 (Good) | 6.7 (Good) | 7.4 (Good) | 6.7 (Good) | 6.5 (Good) | 5.2 (Good) | 4.6 (Good) |
O3 0.04 (Bagus)
ozon (O3)PM2,5 2.2 (Bagus)
partikulat Matter (PM 2.5) debuBrainerd
| index | 2024-04-16 | 2024-04-15 | 2024-04-14 | 2024-04-13 | 2024-04-12 | 2024-04-11 | 2024-04-10 | 2024-04-09 |
|---|---|---|---|---|---|---|---|---|
| pm25 | 2.6 | 4.1 | 6.1 | 6.8 | 2 | 3.8 | 7.7 | 4.4 |
| o3 | 0.04 | 0.04 | 0.05 | 0.04 | 0.04 | 0.04 | 0.03 | 0.03 |
Brainerd

| index | 2020-05 | 2020-04 | 2020-03 | 2020-02 | 2020-01 | 2019-12 | 2019-11 | 2019-10 | 2019-09 | 2019-08 | 2019-07 | 2019-06 | 2019-05 | 2019-04 | 2019-03 | 2019-02 | 2019-01 | 2018-10 | 2018-09 | 2018-08 | 2018-07 | 2018-06 | 2018-05 | 2018-04 | 2018-03 | 2018-02 | 2018-01 | 2017-12 | 2017-11 | 2017-10 | 2017-09 | 2017-08 | 2017-07 | 2017-06 | 2017-05 | 2017-04 | 2017-03 | 2017-02 | 2017-01 | 2016-12 | 2016-11 | 2016-10 | 2016-09 | 2016-08 | 2016-07 | 2016-06 | 2016-05 | 2016-04 | 2016-03 |
|---|---|---|---|---|---|---|---|---|---|---|---|---|---|---|---|---|---|---|---|---|---|---|---|---|---|---|---|---|---|---|---|---|---|---|---|---|---|---|---|---|---|---|---|---|---|---|---|---|---|
| pm25 | 2.5 | 4.8 | 6 | 4.5 | 6.2 | 7.1 | 3.6 | 2.2 | 3.1 | 4 | 5.8 | 4 | 3.6 | 3.5 | 5.6 | 6 | 5 | 1.8 | 3.6 | 11 | 6.5 | 5 | 5.9 | 5.7 | 4.7 | 6 | 6.4 | 5.7 | 5.7 | 4.1 | 6.6 | 6.4 | 5.8 | 3.8 | 3.1 | 4.7 | 5.6 | 5.3 | 7.9 | 3.8 | 4.5 | 5.4 | 6.1 | 6.7 | 7.4 | 6.7 | 6.5 | 5.2 | 4.6 |
| o3:ppm | 0.04 | 0.04 | 0.03 | 0.04 | - | - | 0.02 | 0.02 | 0.02 | 0.02 | 0.03 | 0.03 | 0.04 | 0.04 | 0.04 | 0.04 | - | 0.02 | 0.02 | 0.02 | 0.02 | 0.02 | 0.04 | 0.05 | 0.04 | 0.04 | - | - | - | 0.02 | 0.02 | 0.02 | 0.03 | 0.04 | 0.04 | 0.03 | 0.03 | 0.03 | - | - | - | 0.02 | 0.02 | 0.02 | 0.03 | 0.03 | 0.04 | 0.04 | 0.03 |