Polusi udara di Hanley: indeks kualitas udara real-time dan siaga asap.
Perkiraan kualitas polusi dan udara untuk Hanley. Hari ini Kamis, 18 Juni 2026. Nilai polusi udara berikut telah tercatat untuk Hanley:- ozon (O3) - 41 (Bagus)
- nitrogen dioksida (NO2) - 25 (Bagus)
- partikulat Matter (PM10) debu tersuspensi - 14 (Bagus)
- partikulat Matter (PM 2.5) debu - 8 (Bagus)

Apa kualitas udara di Hanley hari ini? Apakah udara tercemar di Hanley?. Apakah ada Smog?
Bagaimana tingkat O3 hari ini di Hanley? (ozon (O3))
41 (Bagus)
Seberapa tinggi tingkat NO2? (nitrogen dioksida (NO2))
25 (Bagus)
Apa tingkat PM10 hari ini di Hanley? (partikulat Matter (PM10) debu tersuspensi)
Level saat ini dari partikulat Matter PM10 di Hanley adalah:
14 (Bagus)
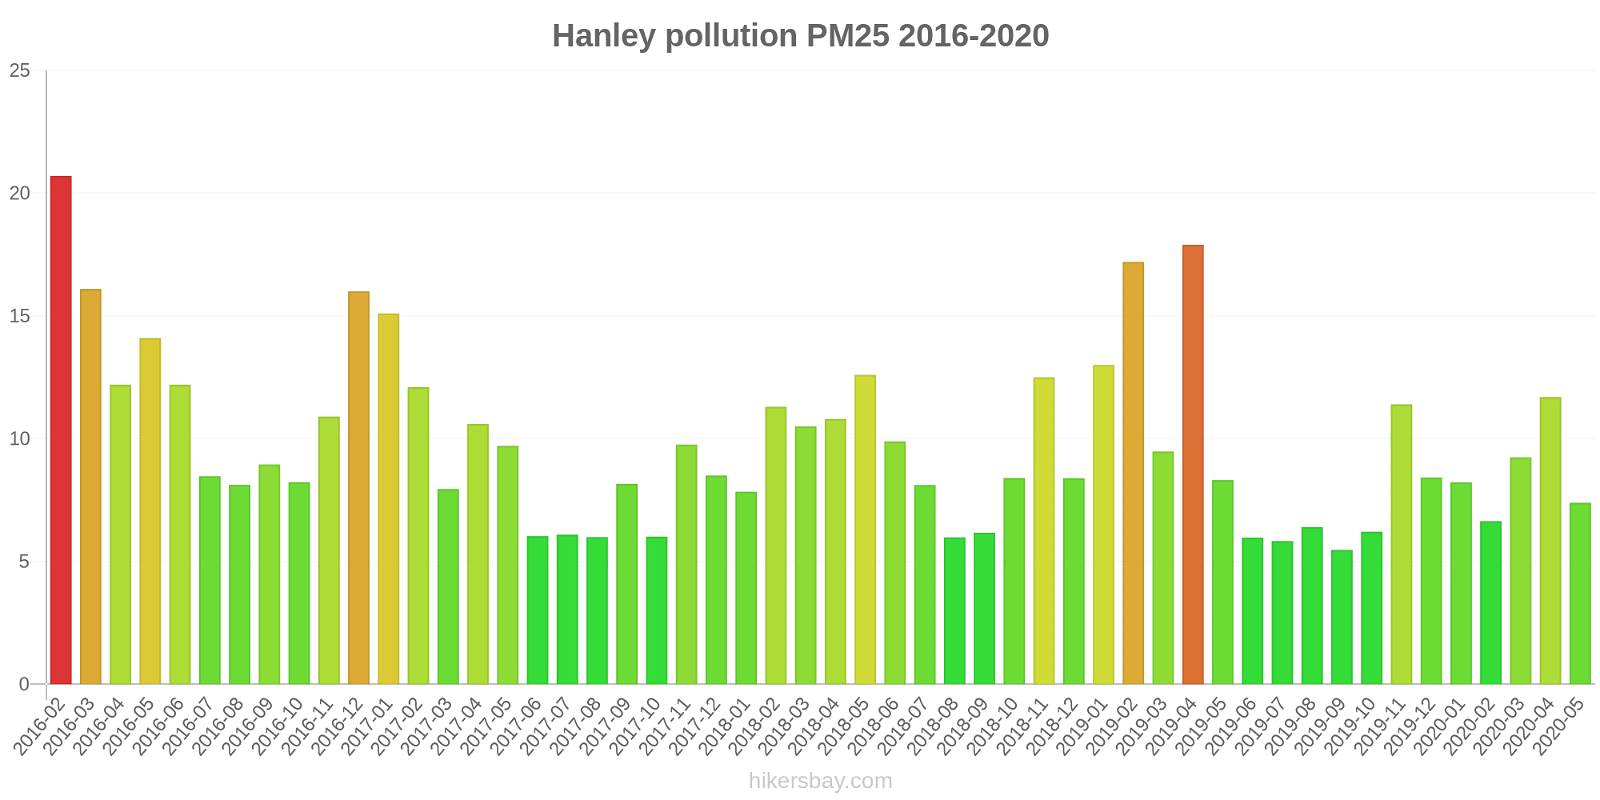
Nilai PM10 tertinggi biasanya terjadi di bulan: 18 (April 2020).
Nilai terendah dari partikulat PM10 pencemaran Hanley biasanya dicatat di: Juni (10).
Apa tingkat saat PM 2,5 in Hanley? (partikulat Matter (PM 2.5) debu)
Hari ini PM 2.5 tingkat:
8 (Bagus)
Sebagai perbandingan, tingkat tertinggi PM 2,5 in Hanley dalam 7 hari terakhir adalah: 9 (Senin, 5 Februari 2024) dan Terendah: 3 (Jumat, 2 Februari 2024).
Nilai tertinggi PM 2.5 direkam: 21 (Februari 2016).
Tingkat terendah dari partikulat Matter PM 2.5 polusi terjadi di bulan: September (5.5).
Data saat ini Rabu, 7 Februari 2024 07.00
O3 41 (Bagus)
NO2 25 (Bagus)
PM10 14 (Bagus)
PM2,5 8 (Bagus)
Data tentang polusi udara dari beberapa hari terakhir di Hanley
index
2024-01-31
2024-02-02
2024-02-03
2024-02-04
2024-02-05
2024-02-06
2024-02-07
pm25
8
Good
3
Good
3
Good
5
Good
9
Good
5
Good
7
Good
no2
23
Good
14
Good
16
Good
8
Good
7
Good
19
Good
17
Good
pm10
14
Good
5
Good
6
Good
8
Good
19
Good
10
Good
14
Good
o3
36
Good
52
Good
51
Good
53
Good
64
Good
59
Good
35
Good
data source »
Polusi udara di Hanley dari Februari 2016 ke Mei 2020
index
2020-05
2020-04
2020-03
2020-02
2020-01
2019-12
2019-11
2019-10
2019-09
2019-08
2019-07
2019-06
2019-05
2019-04
2019-03
2019-02
2019-01
2018-12
2018-11
2018-10
2018-09
2018-08
2018-07
2018-06
2018-05
2018-04
2018-03
2018-02
2018-01
2017-12
2017-11
2017-10
2017-09
2017-08
2017-07
2017-06
2017-05
2017-04
2017-03
2017-02
2017-01
2016-12
2016-11
2016-10
2016-09
2016-08
2016-07
2016-06
2016-05
2016-04
2016-03
2016-02
o3
65 (Good)
69 (Good)
56 (Good)
54 (Good)
38 (Good)
31 (Good)
25 (Good)
32 (Good)
34 (Good)
46 (Good)
40 (Good)
47 (Good)
53 (Good)
70 (Good)
51 (Good)
35 (Good)
33 (Good)
32 (Good)
35 (Good)
37 (Good)
37 (Good)
37 (Good)
58 (Good)
57 (Good)
68 (Good)
58 (Good)
53 (Good)
42 (Good)
39 (Good)
32 (Good)
31 (Good)
39 (Good)
32 (Good)
36 (Good)
40 (Good)
47 (Good)
58 (Good)
54 (Good)
50 (Good)
43 (Good)
25 (Good)
18 (Good)
28 (Good)
32 (Good)
32 (Good)
39 (Good)
34 (Good)
42 (Good)
60 (Good)
50 (Good)
38 (Good)
43 (Good)
no2
12 (Good)
10 (Good)
20 (Good)
20 (Good)
28 (Good)
30 (Good)
30 (Good)
24 (Good)
22 (Good)
16 (Good)
18 (Good)
19 (Good)
22 (Good)
19 (Good)
23 (Good)
34 (Good)
37 (Good)
31 (Good)
24 (Good)
26 (Good)
24 (Good)
20 (Good)
21 (Good)
17 (Good)
19 (Good)
22 (Good)
24 (Good)
27 (Good)
28 (Good)
33 (Good)
32 (Good)
20 (Good)
26 (Good)
22 (Good)
20 (Good)
19 (Good)
21 (Good)
28 (Good)
28 (Good)
31 (Good)
39 (Good)
41 (Moderate)
40 (Good)
26 (Good)
23 (Good)
21 (Good)
22 (Good)
24 (Good)
23 (Good)
28 (Good)
35 (Good)
36 (Good)
pm25
7.4 (Good)
12 (Good)
9.2 (Good)
6.6 (Good)
8.2 (Good)
8.4 (Good)
11 (Good)
6.2 (Good)
5.5 (Good)
6.4 (Good)
5.8 (Good)
6 (Good)
8.3 (Good)
18 (Moderate)
9.5 (Good)
17 (Moderate)
13 (Moderate)
8.4 (Good)
13 (Good)
8.4 (Good)
6.2 (Good)
6 (Good)
8.1 (Good)
9.9 (Good)
13 (Good)
11 (Good)
11 (Good)
11 (Good)
7.8 (Good)
8.5 (Good)
9.8 (Good)
6 (Good)
8.2 (Good)
6 (Good)
6.1 (Good)
6 (Good)
9.7 (Good)
11 (Good)
8 (Good)
12 (Good)
15 (Moderate)
16 (Moderate)
11 (Good)
8.2 (Good)
8.9 (Good)
8.1 (Good)
8.5 (Good)
12 (Good)
14 (Moderate)
12 (Good)
16 (Moderate)
21 (Moderate)
pm10
12 (Good)
18 (Good)
16 (Good)
12 (Good)
13 (Good)
12 (Good)
16 (Good)
11 (Good)
11 (Good)
12 (Good)
11 (Good)
10 (Good)
13 (Good)
- (Good)
- (Good)
- (Good)
- (Good)
- (Good)
- (Good)
- (Good)
- (Good)
- (Good)
- (Good)
- (Good)
- (Good)
- (Good)
- (Good)
- (Good)
- (Good)
- (Good)
- (Good)
- (Good)
- (Good)
- (Good)
- (Good)
- (Good)
- (Good)
- (Good)
- (Good)
- (Good)
- (Good)
- (Good)
- (Good)
- (Good)
- (Good)
- (Good)
- (Good)
- (Good)
- (Good)
- (Good)
- (Good)
- (Good)
data source »
Kualitas hidup di Hanley
Hijau dan taman di kota
Hanley
50%
Pulau Man: 78%
Republik Irlandia: 72%
Belanda: 82%
Belgia: 64%
Kepulauan Faroe: 87%
partikulat Matter PM 2.5
Hanley
12 (Good)
Kenikmatan menghabiskan waktu di kota
Hanley
67%
Pulau Man: 83%
Republik Irlandia: 78%
Belanda: 88%
Belgia: 64%
Kepulauan Faroe: 100%
partikulat Matter PM10
Hanley
20 (Moderate)
Polusi udara
Hanley
36%
Pulau Man: 13%
Republik Irlandia: 24%
Belanda: 21%
Belgia: 45%
Kepulauan Faroe: 0%
Pembuangan sampah
Hanley
46%
Pulau Man: 78%
Republik Irlandia: 61%
Belanda: 79%
Belgia: 54%
Kepulauan Faroe: 88%
Ketersediaan dan kualitas air minum
Hanley
82%
Pulau Man: 88%
Republik Irlandia: 72%
Belanda: 92%
Belgia: 70%
Kepulauan Faroe: 98%
Kebersihan dan kerasnya
Hanley
32%
Pulau Man: 69%
Republik Irlandia: 52%
Belanda: 77%
Belgia: 46%
Kepulauan Faroe: 94%
Kebisingan dan polusi cahaya
Hanley
25%
Pulau Man: 12%
Republik Irlandia: 37%
Belanda: 31%
Belgia: 54%
Kepulauan Faroe: 21%
Polusi air
Hanley
43%
Pulau Man: 13%
Republik Irlandia: 37%
Belanda: 17%
Belgia: 42%
Kepulauan Faroe: 7,7%
Source: Numbeo
Stoke-on-Trent Centre
Rabu, 7 Februari 2024 07.00
O3 41 (Bagus)
ozon (O3)
NO2 25 (Bagus)
nitrogen dioksida (NO2)
PM10 14 (Bagus)
partikulat Matter (PM10) debu tersuspensi
PM2,5 8 (Bagus)
partikulat Matter (PM 2.5) debu
Stoke-on-Trent Centre
index
2024-02-07
2024-02-06
2024-02-05
2024-02-04
2024-02-03
2024-02-02
2024-01-31
pm25
7
5
8.5
4.7
3.4
2.7
8.2
no2
17
19
7
8.1
16
14
23
pm10
14
10
19
7.6
6
5
14
o3
35
59
64
53
51
52
36
Stoke-on-Trent Centre
2016-02 2020-05
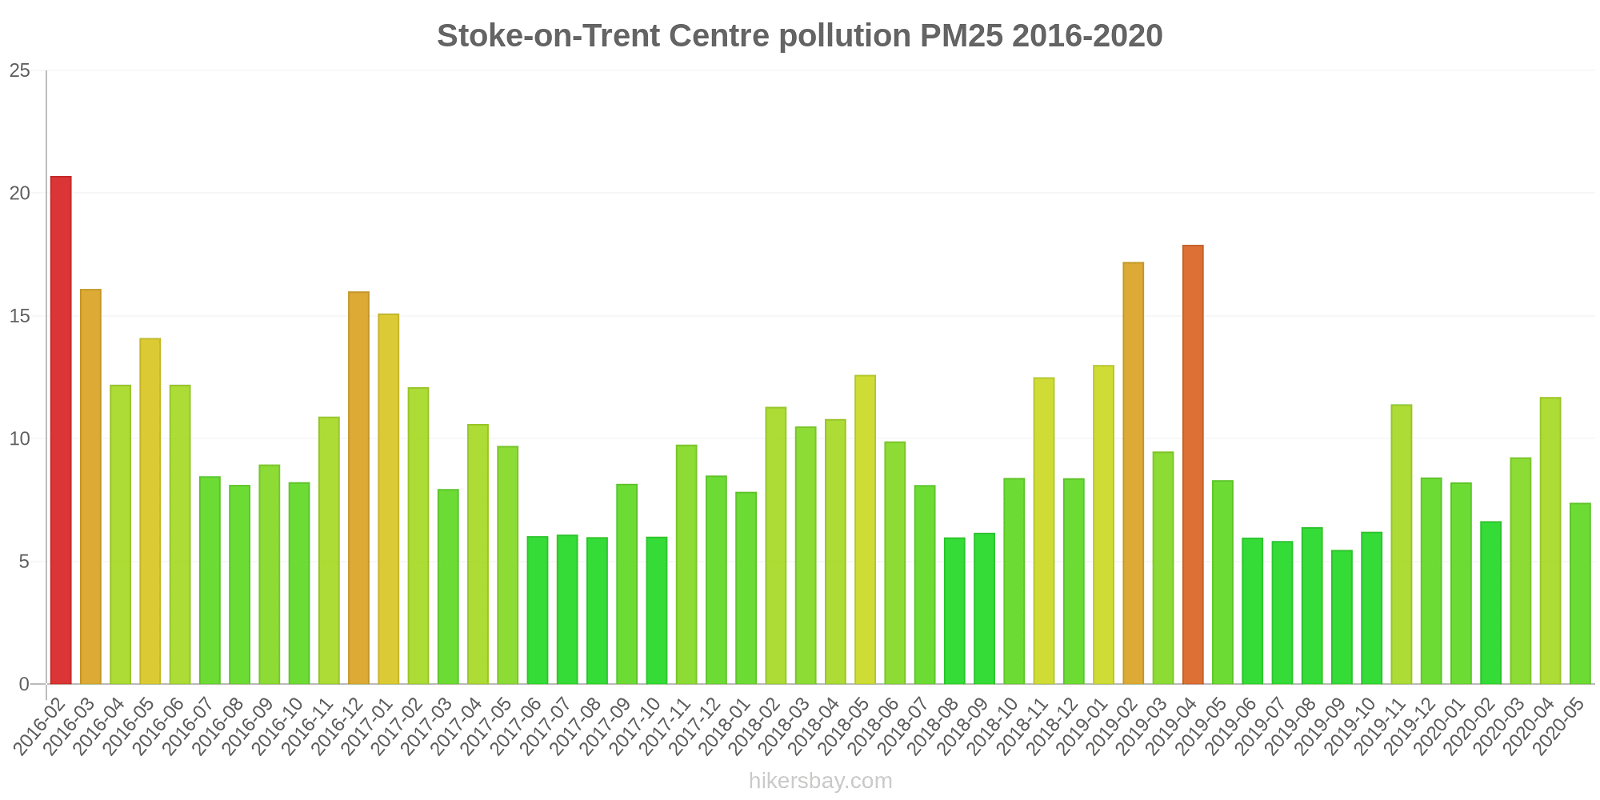
index
2020-05
2020-04
2020-03
2020-02
2020-01
2019-12
2019-11
2019-10
2019-09
2019-08
2019-07
2019-06
2019-05
2019-04
2019-03
2019-02
2019-01
2018-12
2018-11
2018-10
2018-09
2018-08
2018-07
2018-06
2018-05
2018-04
2018-03
2018-02
2018-01
2017-12
2017-11
2017-10
2017-09
2017-08
2017-07
2017-06
2017-05
2017-04
2017-03
2017-02
2017-01
2016-12
2016-11
2016-10
2016-09
2016-08
2016-07
2016-06
2016-05
2016-04
2016-03
2016-02
o3
65
69
56
54
38
31
25
32
34
46
40
47
53
70
51
35
33
32
35
37
37
37
58
57
68
58
53
42
39
32
31
39
32
36
40
47
58
54
50
43
25
18
28
32
32
39
34
42
60
50
38
43
no2
12
10
20
20
28
30
30
24
22
16
18
19
22
19
23
34
37
31
24
26
24
20
21
17
19
22
24
27
28
33
32
20
26
22
20
19
21
28
28
31
39
41
40
26
23
21
22
24
23
28
35
36
pm25
7.4
12
9.2
6.6
8.2
8.4
11
6.2
5.5
6.4
5.8
6
8.3
18
9.5
17
13
8.4
13
8.4
6.2
6
8.1
9.9
13
11
11
11
7.8
8.5
9.8
6
8.2
6
6.1
6
9.7
11
8
12
15
16
11
8.2
8.9
8.1
8.5
12
14
12
16
21
pm10
12
18
16
12
13
12
16
11
11
12
11
10
13
-
-
-
-
-
-
-
-
-
-
-
-
-
-
-
-
-
-
-
-
-
-
-
-
-
-
-
-
-
-
-
-
-
-
-
-
-
-
-
* Pollution data source:
https://openaq.org
(DEFRA)
The data is licensed under CC-By 4.0
O3 41 (Bagus)
NO2 25 (Bagus)
PM10 14 (Bagus)
PM2,5 8 (Bagus)
Data tentang polusi udara dari beberapa hari terakhir di Hanley
| index | 2024-01-31 | 2024-02-02 | 2024-02-03 | 2024-02-04 | 2024-02-05 | 2024-02-06 | 2024-02-07 |
|---|---|---|---|---|---|---|---|
| pm25 | 8 Good |
3 Good |
3 Good |
5 Good |
9 Good |
5 Good |
7 Good |
| no2 | 23 Good |
14 Good |
16 Good |
8 Good |
7 Good |
19 Good |
17 Good |
| pm10 | 14 Good |
5 Good |
6 Good |
8 Good |
19 Good |
10 Good |
14 Good |
| o3 | 36 Good |
52 Good |
51 Good |
53 Good |
64 Good |
59 Good |
35 Good |

| index | 2020-05 | 2020-04 | 2020-03 | 2020-02 | 2020-01 | 2019-12 | 2019-11 | 2019-10 | 2019-09 | 2019-08 | 2019-07 | 2019-06 | 2019-05 | 2019-04 | 2019-03 | 2019-02 | 2019-01 | 2018-12 | 2018-11 | 2018-10 | 2018-09 | 2018-08 | 2018-07 | 2018-06 | 2018-05 | 2018-04 | 2018-03 | 2018-02 | 2018-01 | 2017-12 | 2017-11 | 2017-10 | 2017-09 | 2017-08 | 2017-07 | 2017-06 | 2017-05 | 2017-04 | 2017-03 | 2017-02 | 2017-01 | 2016-12 | 2016-11 | 2016-10 | 2016-09 | 2016-08 | 2016-07 | 2016-06 | 2016-05 | 2016-04 | 2016-03 | 2016-02 |
|---|---|---|---|---|---|---|---|---|---|---|---|---|---|---|---|---|---|---|---|---|---|---|---|---|---|---|---|---|---|---|---|---|---|---|---|---|---|---|---|---|---|---|---|---|---|---|---|---|---|---|---|---|
| o3 | 65 (Good) | 69 (Good) | 56 (Good) | 54 (Good) | 38 (Good) | 31 (Good) | 25 (Good) | 32 (Good) | 34 (Good) | 46 (Good) | 40 (Good) | 47 (Good) | 53 (Good) | 70 (Good) | 51 (Good) | 35 (Good) | 33 (Good) | 32 (Good) | 35 (Good) | 37 (Good) | 37 (Good) | 37 (Good) | 58 (Good) | 57 (Good) | 68 (Good) | 58 (Good) | 53 (Good) | 42 (Good) | 39 (Good) | 32 (Good) | 31 (Good) | 39 (Good) | 32 (Good) | 36 (Good) | 40 (Good) | 47 (Good) | 58 (Good) | 54 (Good) | 50 (Good) | 43 (Good) | 25 (Good) | 18 (Good) | 28 (Good) | 32 (Good) | 32 (Good) | 39 (Good) | 34 (Good) | 42 (Good) | 60 (Good) | 50 (Good) | 38 (Good) | 43 (Good) |
| no2 | 12 (Good) | 10 (Good) | 20 (Good) | 20 (Good) | 28 (Good) | 30 (Good) | 30 (Good) | 24 (Good) | 22 (Good) | 16 (Good) | 18 (Good) | 19 (Good) | 22 (Good) | 19 (Good) | 23 (Good) | 34 (Good) | 37 (Good) | 31 (Good) | 24 (Good) | 26 (Good) | 24 (Good) | 20 (Good) | 21 (Good) | 17 (Good) | 19 (Good) | 22 (Good) | 24 (Good) | 27 (Good) | 28 (Good) | 33 (Good) | 32 (Good) | 20 (Good) | 26 (Good) | 22 (Good) | 20 (Good) | 19 (Good) | 21 (Good) | 28 (Good) | 28 (Good) | 31 (Good) | 39 (Good) | 41 (Moderate) | 40 (Good) | 26 (Good) | 23 (Good) | 21 (Good) | 22 (Good) | 24 (Good) | 23 (Good) | 28 (Good) | 35 (Good) | 36 (Good) |
| pm25 | 7.4 (Good) | 12 (Good) | 9.2 (Good) | 6.6 (Good) | 8.2 (Good) | 8.4 (Good) | 11 (Good) | 6.2 (Good) | 5.5 (Good) | 6.4 (Good) | 5.8 (Good) | 6 (Good) | 8.3 (Good) | 18 (Moderate) | 9.5 (Good) | 17 (Moderate) | 13 (Moderate) | 8.4 (Good) | 13 (Good) | 8.4 (Good) | 6.2 (Good) | 6 (Good) | 8.1 (Good) | 9.9 (Good) | 13 (Good) | 11 (Good) | 11 (Good) | 11 (Good) | 7.8 (Good) | 8.5 (Good) | 9.8 (Good) | 6 (Good) | 8.2 (Good) | 6 (Good) | 6.1 (Good) | 6 (Good) | 9.7 (Good) | 11 (Good) | 8 (Good) | 12 (Good) | 15 (Moderate) | 16 (Moderate) | 11 (Good) | 8.2 (Good) | 8.9 (Good) | 8.1 (Good) | 8.5 (Good) | 12 (Good) | 14 (Moderate) | 12 (Good) | 16 (Moderate) | 21 (Moderate) |
| pm10 | 12 (Good) | 18 (Good) | 16 (Good) | 12 (Good) | 13 (Good) | 12 (Good) | 16 (Good) | 11 (Good) | 11 (Good) | 12 (Good) | 11 (Good) | 10 (Good) | 13 (Good) | - (Good) | - (Good) | - (Good) | - (Good) | - (Good) | - (Good) | - (Good) | - (Good) | - (Good) | - (Good) | - (Good) | - (Good) | - (Good) | - (Good) | - (Good) | - (Good) | - (Good) | - (Good) | - (Good) | - (Good) | - (Good) | - (Good) | - (Good) | - (Good) | - (Good) | - (Good) | - (Good) | - (Good) | - (Good) | - (Good) | - (Good) | - (Good) | - (Good) | - (Good) | - (Good) | - (Good) | - (Good) | - (Good) | - (Good) |
Hijau dan taman di kota
Hanley 50%
Pulau Man: 78% Republik Irlandia: 72% Belanda: 82% Belgia: 64% Kepulauan Faroe: 87%partikulat Matter PM 2.5
Hanley 12 (Good)
Kenikmatan menghabiskan waktu di kota
Hanley 67%
Pulau Man: 83% Republik Irlandia: 78% Belanda: 88% Belgia: 64% Kepulauan Faroe: 100%partikulat Matter PM10
Hanley 20 (Moderate)
Polusi udara
Hanley 36%
Pulau Man: 13% Republik Irlandia: 24% Belanda: 21% Belgia: 45% Kepulauan Faroe: 0%Pembuangan sampah
Hanley 46%
Pulau Man: 78% Republik Irlandia: 61% Belanda: 79% Belgia: 54% Kepulauan Faroe: 88%Ketersediaan dan kualitas air minum
Hanley 82%
Pulau Man: 88% Republik Irlandia: 72% Belanda: 92% Belgia: 70% Kepulauan Faroe: 98%Kebersihan dan kerasnya
Hanley 32%
Pulau Man: 69% Republik Irlandia: 52% Belanda: 77% Belgia: 46% Kepulauan Faroe: 94%Kebisingan dan polusi cahaya
Hanley 25%
Pulau Man: 12% Republik Irlandia: 37% Belanda: 31% Belgia: 54% Kepulauan Faroe: 21%Polusi air
Hanley 43%
Pulau Man: 13% Republik Irlandia: 37% Belanda: 17% Belgia: 42% Kepulauan Faroe: 7,7%O3 41 (Bagus)
ozon (O3)NO2 25 (Bagus)
nitrogen dioksida (NO2)PM10 14 (Bagus)
partikulat Matter (PM10) debu tersuspensiPM2,5 8 (Bagus)
partikulat Matter (PM 2.5) debuStoke-on-Trent Centre
| index | 2024-02-07 | 2024-02-06 | 2024-02-05 | 2024-02-04 | 2024-02-03 | 2024-02-02 | 2024-01-31 |
|---|---|---|---|---|---|---|---|
| pm25 | 7 | 5 | 8.5 | 4.7 | 3.4 | 2.7 | 8.2 |
| no2 | 17 | 19 | 7 | 8.1 | 16 | 14 | 23 |
| pm10 | 14 | 10 | 19 | 7.6 | 6 | 5 | 14 |
| o3 | 35 | 59 | 64 | 53 | 51 | 52 | 36 |
Stoke-on-Trent Centre
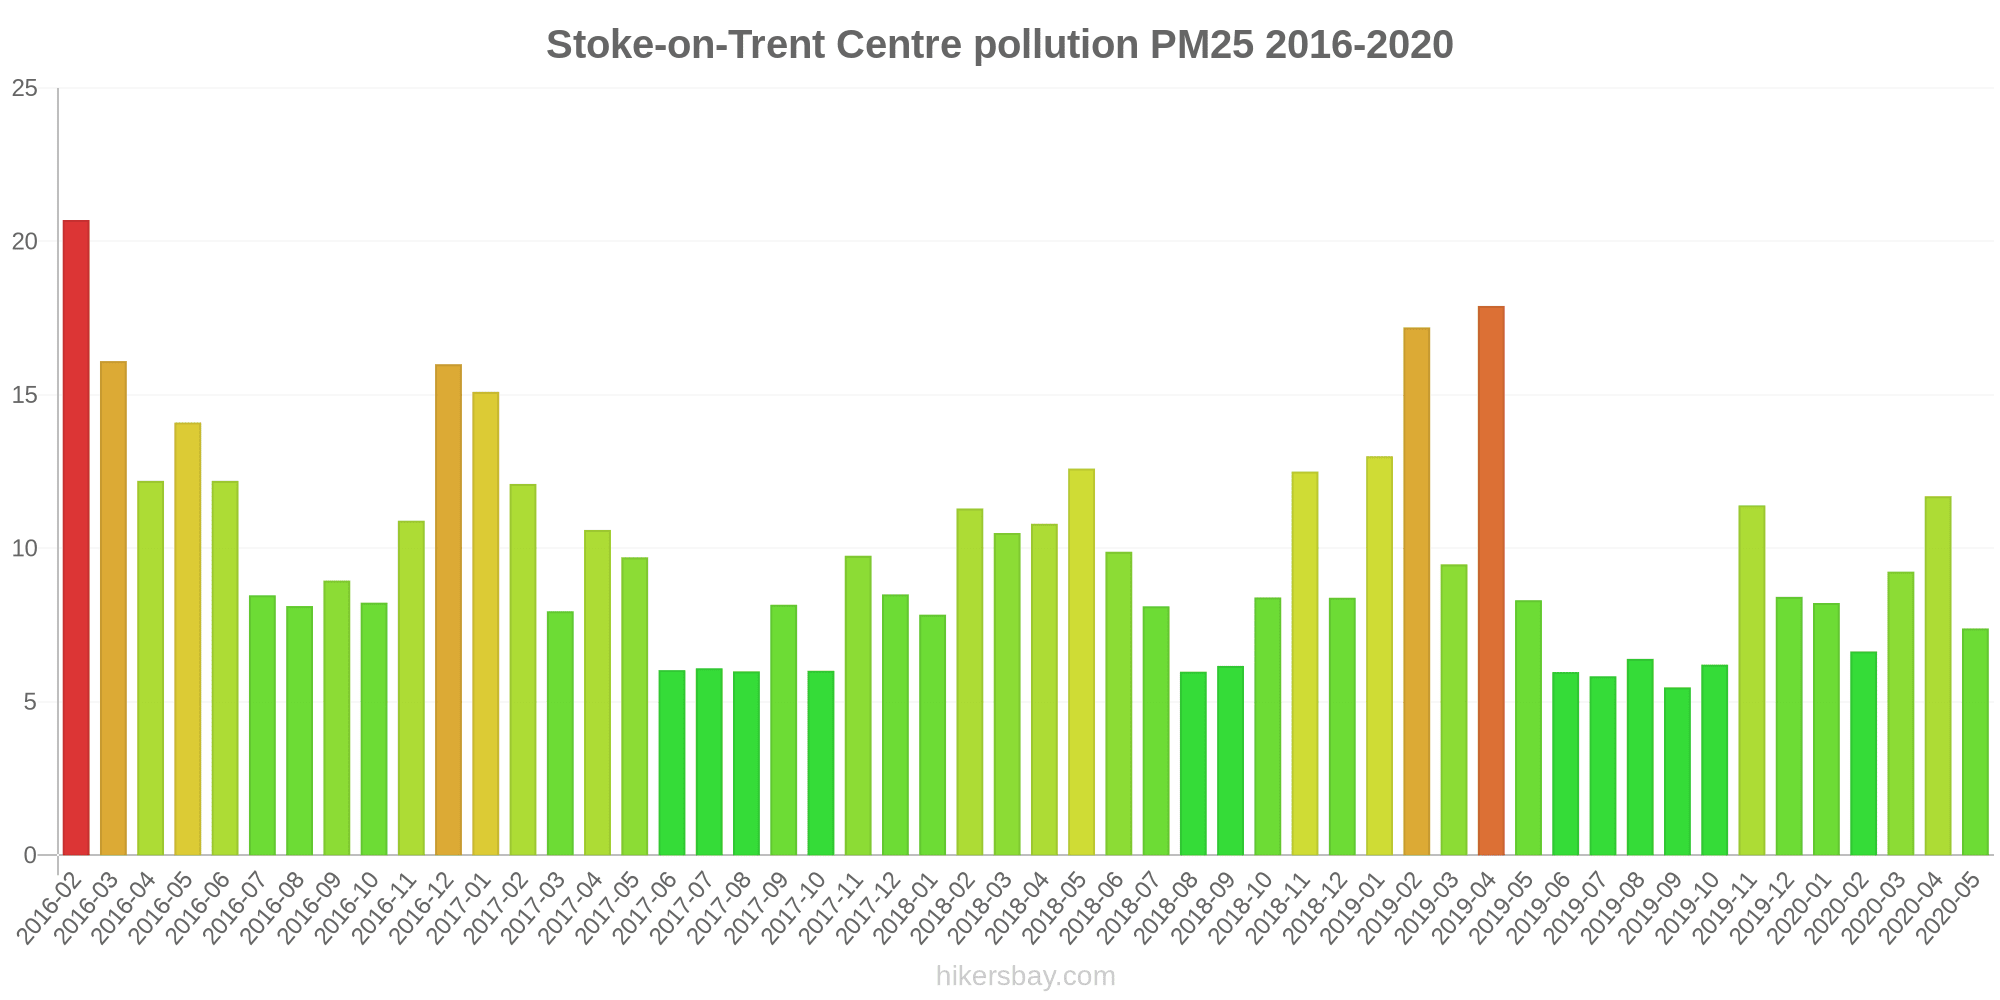
| index | 2020-05 | 2020-04 | 2020-03 | 2020-02 | 2020-01 | 2019-12 | 2019-11 | 2019-10 | 2019-09 | 2019-08 | 2019-07 | 2019-06 | 2019-05 | 2019-04 | 2019-03 | 2019-02 | 2019-01 | 2018-12 | 2018-11 | 2018-10 | 2018-09 | 2018-08 | 2018-07 | 2018-06 | 2018-05 | 2018-04 | 2018-03 | 2018-02 | 2018-01 | 2017-12 | 2017-11 | 2017-10 | 2017-09 | 2017-08 | 2017-07 | 2017-06 | 2017-05 | 2017-04 | 2017-03 | 2017-02 | 2017-01 | 2016-12 | 2016-11 | 2016-10 | 2016-09 | 2016-08 | 2016-07 | 2016-06 | 2016-05 | 2016-04 | 2016-03 | 2016-02 |
|---|---|---|---|---|---|---|---|---|---|---|---|---|---|---|---|---|---|---|---|---|---|---|---|---|---|---|---|---|---|---|---|---|---|---|---|---|---|---|---|---|---|---|---|---|---|---|---|---|---|---|---|---|
| o3 | 65 | 69 | 56 | 54 | 38 | 31 | 25 | 32 | 34 | 46 | 40 | 47 | 53 | 70 | 51 | 35 | 33 | 32 | 35 | 37 | 37 | 37 | 58 | 57 | 68 | 58 | 53 | 42 | 39 | 32 | 31 | 39 | 32 | 36 | 40 | 47 | 58 | 54 | 50 | 43 | 25 | 18 | 28 | 32 | 32 | 39 | 34 | 42 | 60 | 50 | 38 | 43 |
| no2 | 12 | 10 | 20 | 20 | 28 | 30 | 30 | 24 | 22 | 16 | 18 | 19 | 22 | 19 | 23 | 34 | 37 | 31 | 24 | 26 | 24 | 20 | 21 | 17 | 19 | 22 | 24 | 27 | 28 | 33 | 32 | 20 | 26 | 22 | 20 | 19 | 21 | 28 | 28 | 31 | 39 | 41 | 40 | 26 | 23 | 21 | 22 | 24 | 23 | 28 | 35 | 36 |
| pm25 | 7.4 | 12 | 9.2 | 6.6 | 8.2 | 8.4 | 11 | 6.2 | 5.5 | 6.4 | 5.8 | 6 | 8.3 | 18 | 9.5 | 17 | 13 | 8.4 | 13 | 8.4 | 6.2 | 6 | 8.1 | 9.9 | 13 | 11 | 11 | 11 | 7.8 | 8.5 | 9.8 | 6 | 8.2 | 6 | 6.1 | 6 | 9.7 | 11 | 8 | 12 | 15 | 16 | 11 | 8.2 | 8.9 | 8.1 | 8.5 | 12 | 14 | 12 | 16 | 21 |
| pm10 | 12 | 18 | 16 | 12 | 13 | 12 | 16 | 11 | 11 | 12 | 11 | 10 | 13 | - | - | - | - | - | - | - | - | - | - | - | - | - | - | - | - | - | - | - | - | - | - | - | - | - | - | - | - | - | - | - | - | - | - | - | - | - | - | - |