Polusi udara di Taichung City: indeks kualitas udara real-time dan siaga asap.
Perkiraan kualitas polusi dan udara untuk Taichung City. Hari ini Minggu, 10 Mei 2026. Nilai polusi udara berikut telah tercatat untuk Taichung City:- nitrogen dioksida (NO2) - 7 (Bagus)
- partikulat Matter (PM10) debu tersuspensi - 19 (Bagus)
- ozon (O3) - 91 (Moderat)
- partikulat Matter (PM 2.5) debu - 10 (Bagus)
- sulfur dioksida (SO2) - 0 (Bagus)
- karbon monoksida (CO) - 100 (Bagus)

Apa kualitas udara di Taichung City hari ini? Apakah udara tercemar di Taichung City?. Apakah ada Smog?
Seberapa tinggi tingkat NO2? (nitrogen dioksida (NO2))
7 (Bagus)
Apa tingkat PM10 hari ini di Taichung City? (partikulat Matter (PM10) debu tersuspensi)
Level saat ini dari partikulat Matter PM10 di Taichung City adalah:
19 (Bagus)
Nilai PM10 tertinggi biasanya terjadi di bulan: 57 (Desember 2016).
Nilai terendah dari partikulat PM10 pencemaran Taichung City biasanya dicatat di: Juni (16).
Bagaimana tingkat O3 hari ini di Taichung City? (ozon (O3))
91 (Moderat)
Apa tingkat saat PM 2,5 in Taichung City? (partikulat Matter (PM 2.5) debu)
Hari ini PM 2.5 tingkat:
10 (Bagus)
Sebagai perbandingan, tingkat tertinggi PM 2,5 in Taichung City dalam 7 hari terakhir adalah: 20 (Jumat, 27 Mei 2022) dan Terendah: 20 (Jumat, 27 Mei 2022).
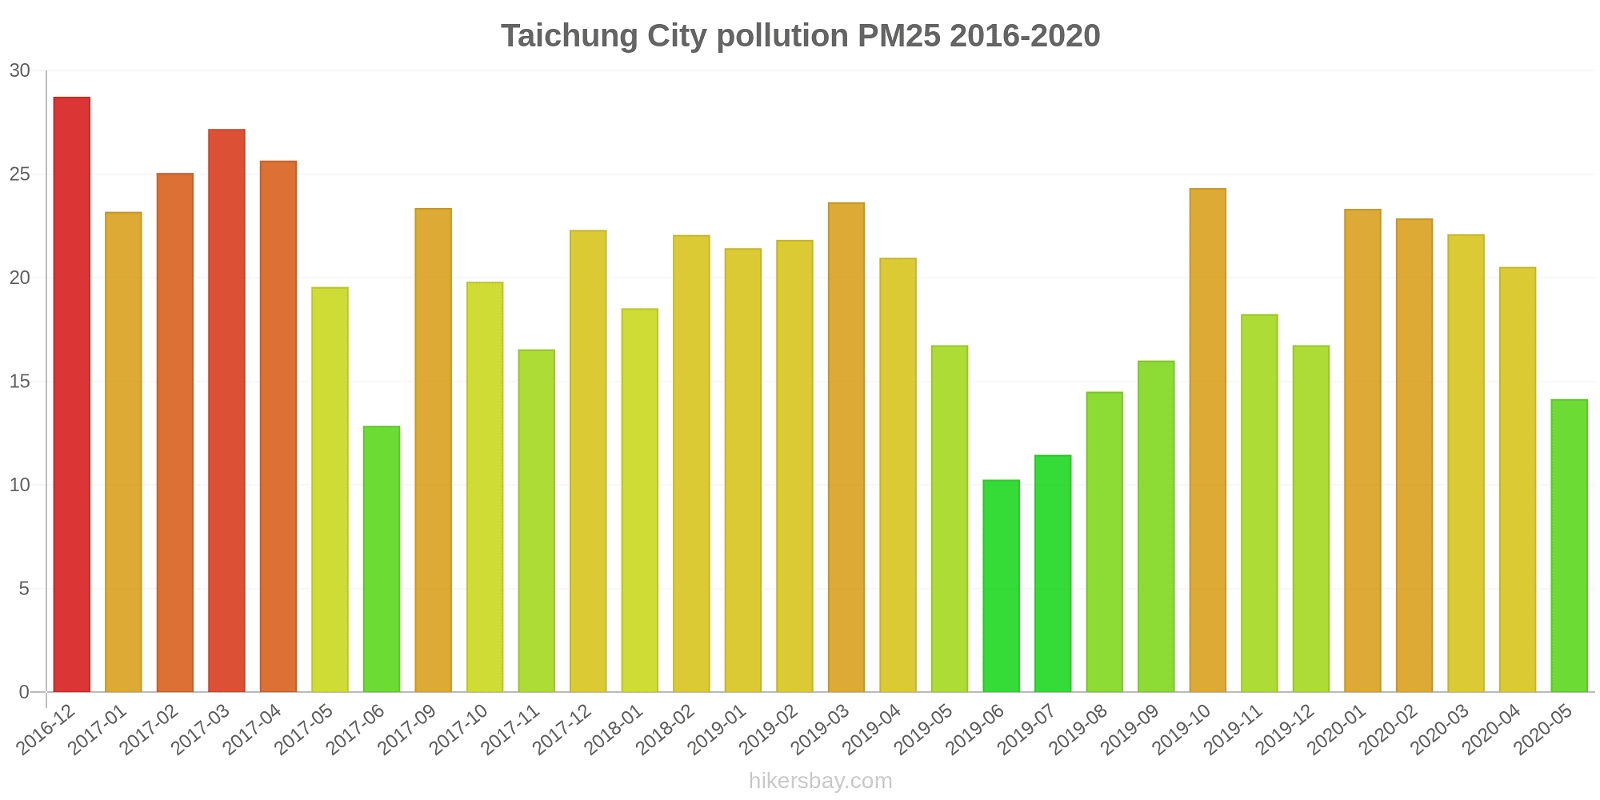
Nilai tertinggi PM 2.5 direkam: 29 (Desember 2016).
Tingkat terendah dari partikulat Matter PM 2.5 polusi terjadi di bulan: Juni (10).
Apa tingkat polusi SO2? (sulfur dioksida (SO2))
0 (Bagus)
Seberapa tinggi tingkat CO? (karbon monoksida (CO))
100 (Bagus)
Data saat ini Jumat, 27 Mei 2022 12.00
NO2 7 (Bagus)
PM10 19 (Bagus)
O3 91 (Moderat)
PM2,5 10 (Bagus)
SO2 0 (Bagus)
CO 100 (Bagus)
Data tentang polusi udara dari beberapa hari terakhir di Taichung City
index
2022-05-27
no2
20
Good
pm10
27
Moderate
o3
39
Good
pm25
20
Moderate
so2
5
Good
co
240
Good
data source »
Polusi udara di Taichung City dari Desember 2016 ke Mei 2020
index
2020-05
2020-04
2020-03
2020-02
2020-01
2019-12
2019-11
2019-10
2019-09
2019-08
2019-07
2019-06
2019-05
2019-04
2019-03
2019-02
2019-01
2018-02
2018-01
2017-12
2017-11
2017-10
2017-09
2017-06
2017-05
2017-04
2017-03
2017-02
2017-01
2016-12
pm25
14 (Moderate)
21 (Moderate)
22 (Moderate)
23 (Moderate)
23 (Moderate)
17 (Moderate)
18 (Moderate)
24 (Moderate)
16 (Moderate)
15 (Moderate)
11 (Good)
10 (Good)
17 (Moderate)
21 (Moderate)
24 (Moderate)
22 (Moderate)
21 (Moderate)
22 (Moderate)
19 (Moderate)
22 (Moderate)
17 (Moderate)
20 (Moderate)
23 (Moderate)
13 (Good)
20 (Moderate)
26 (Moderate)
27 (Moderate)
25 (Moderate)
23 (Moderate)
29 (Moderate)
pm10
26 (Moderate)
35 (Moderate)
39 (Moderate)
39 (Moderate)
39 (Moderate)
31 (Moderate)
36 (Moderate)
42 (Moderate)
30 (Moderate)
26 (Moderate)
22 (Moderate)
16 (Good)
31 (Moderate)
36 (Moderate)
43 (Moderate)
40 (Moderate)
43 (Moderate)
45 (Moderate)
41 (Moderate)
47 (Moderate)
39 (Moderate)
43 (Moderate)
46 (Moderate)
26 (Moderate)
40 (Moderate)
48 (Moderate)
54 (Unhealthy for Sensitive Groups)
50 (Unhealthy for Sensitive Groups)
47 (Moderate)
57 (Unhealthy for Sensitive Groups)
o3:ppm
0.03 (Good)
0.04 (Good)
0.03 (Good)
0.03 (Good)
0.03 (Good)
0.03 (Good)
0.04 (Good)
0.04 (Good)
0.04 (Good)
0.03 (Good)
0.02 (Good)
0.02 (Good)
0.03 (Good)
0.03 (Good)
0.03 (Good)
0.03 (Good)
0.03 (Good)
0.03 (Good)
0.02 (Good)
0.03 (Good)
0.03 (Good)
0.04 (Good)
0.04 (Good)
0.02 (Good)
0.03 (Good)
0.04 (Good)
0.04 (Good)
0.03 (Good)
0.03 (Good)
0.02 (Good)
so2:ppm
0 (Good)
0 (Good)
0 (Good)
0 (Good)
0 (Good)
0 (Good)
0 (Good)
0 (Good)
0 (Good)
0 (Good)
0 (Good)
0 (Good)
0 (Good)
0 (Good)
0 (Good)
0 (Good)
0 (Good)
0 (Good)
0 (Good)
0 (Good)
0 (Good)
0 (Good)
0 (Good)
0 (Good)
0 (Good)
0 (Good)
0 (Good)
0 (Good)
0 (Good)
0 (Good)
co:ppm
0.28 (Good)
0.39 (Good)
0.41 (Good)
0.43 (Good)
0.51 (Good)
0.41 (Good)
0.34 (Good)
0.37 (Good)
0.29 (Good)
0.29 (Good)
0.23 (Good)
0.29 (Good)
0.39 (Good)
0.42 (Good)
0.48 (Good)
0.46 (Good)
0.49 (Good)
0.46 (Good)
0.45 (Good)
0.44 (Good)
0.37 (Good)
0.34 (Good)
0.36 (Good)
0.3 (Good)
0.38 (Good)
0.42 (Good)
0.44 (Good)
0.4 (Good)
0.41 (Good)
0.46 (Good)
no2:ppm
0.01 (Good)
0.01 (Good)
0.01 (Good)
0.02 (Good)
0.02 (Good)
0.02 (Good)
0.01 (Good)
0.01 (Good)
0.01 (Good)
0.01 (Good)
0.01 (Good)
0.01 (Good)
0.01 (Good)
0.01 (Good)
0.02 (Good)
0.02 (Good)
0.02 (Good)
0.02 (Good)
0.02 (Good)
0.02 (Good)
0.01 (Good)
0.01 (Good)
0.01 (Good)
0.01 (Good)
0.01 (Good)
0.02 (Good)
0.02 (Good)
0.02 (Good)
0.01 (Good)
0.02 (Good)
data source »
Kualitas hidup di Taichung City
Hijau dan taman di kota
Taichung City
38%
Hong Kong: 52%
Meksiko: 56%
Filipina: 45%
Korea Selatan: 61%
partikulat Matter PM 2.5
Taichung City
32 (Moderate)
Kenikmatan menghabiskan waktu di kota
Taichung City
28%
Hong Kong: 43%
Meksiko: 57%
Filipina: 39%
Korea Selatan: 43%
partikulat Matter PM10
Taichung City
48 (Moderate)
Polusi udara
Taichung City
81%
Hong Kong: 67%
Meksiko: 53%
Filipina: 64%
Korea Selatan: 69%
Pembuangan sampah
Taichung City
48%
Hong Kong: 52%
Meksiko: 52%
Filipina: 35%
Korea Selatan: 62%
Ketersediaan dan kualitas air minum
Taichung City
33%
Hong Kong: 66%
Meksiko: 57%
Filipina: 54%
Korea Selatan: 72%
Kebersihan dan kerasnya
Taichung City
40%
Hong Kong: 54%
Meksiko: 45%
Filipina: 38%
Korea Selatan: 63%
Kebisingan dan polusi cahaya
Taichung City
71%
Hong Kong: 66%
Meksiko: 48%
Filipina: 60%
Polusi air
Taichung City
77%
Hong Kong: 53%
Meksiko: 55%
Filipina: 74%
Korea Selatan: 38%
Source: Numbeo
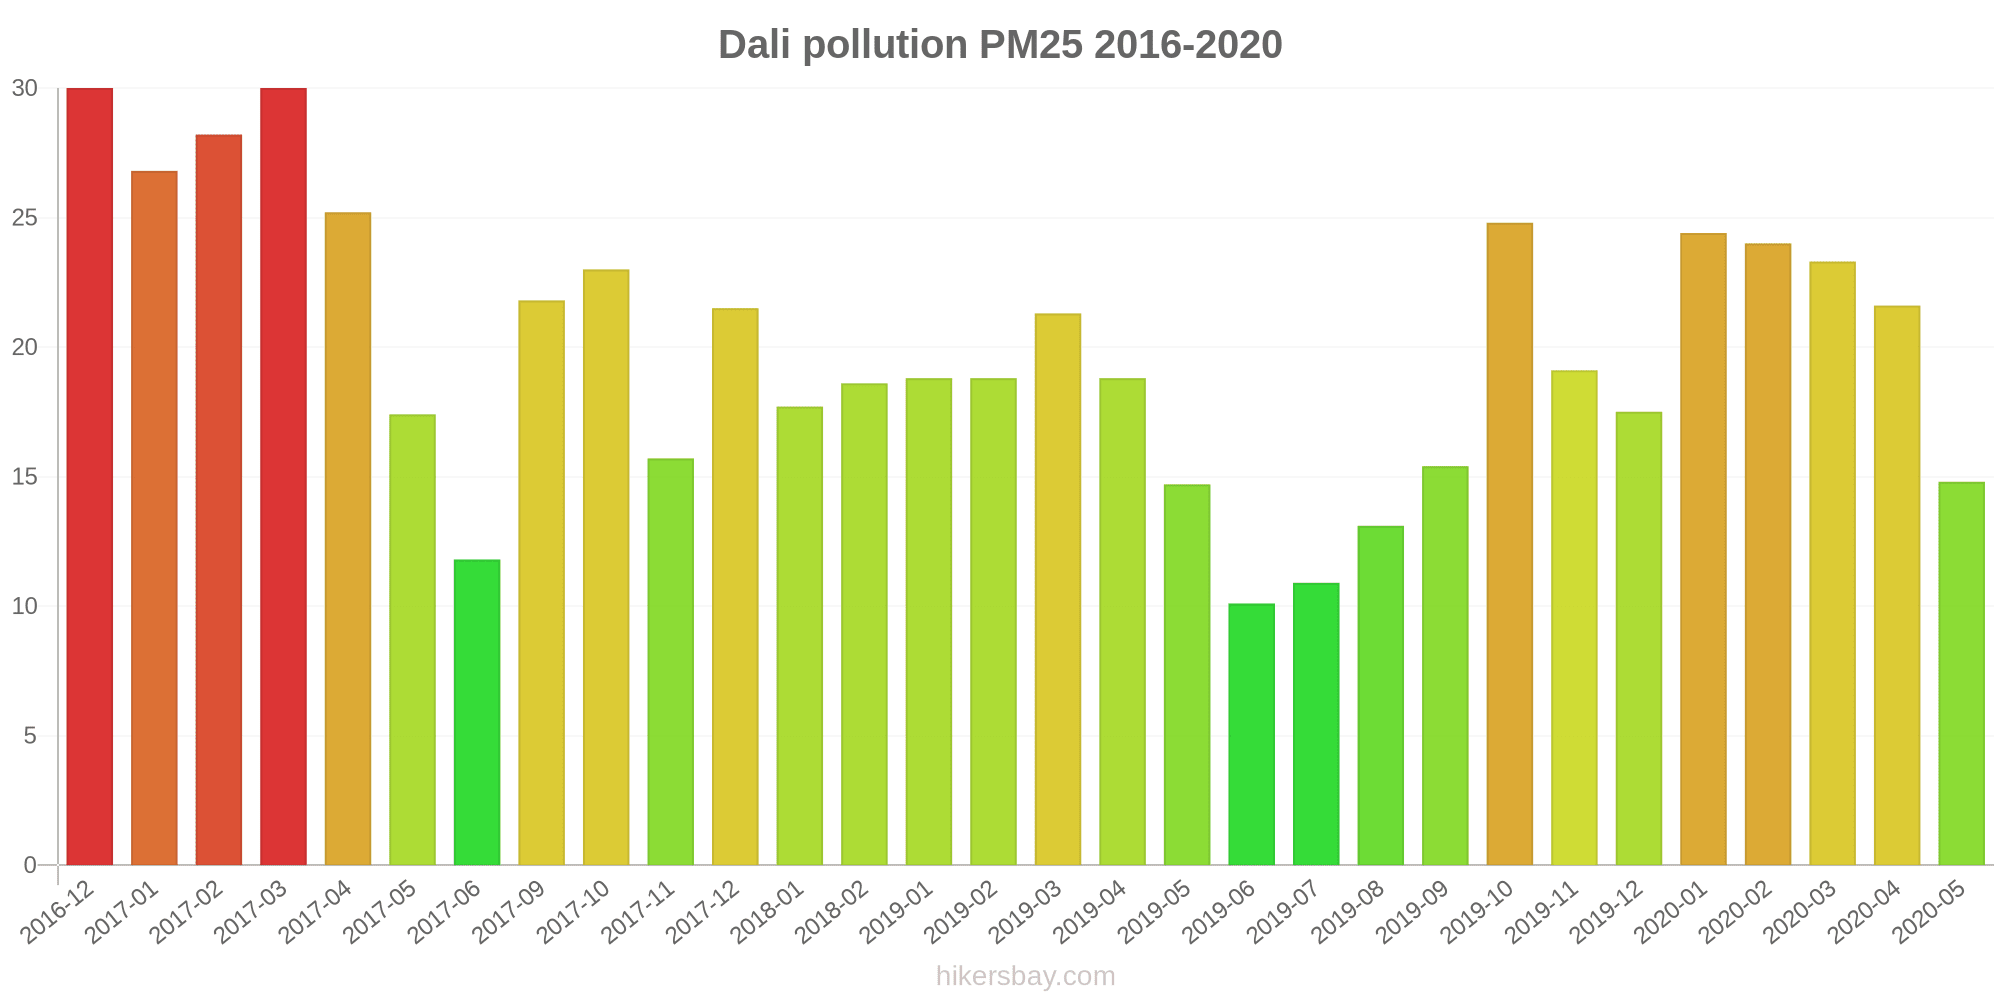
Dali
Jumat, 27 Mei 2022 12.00
NO2 7.3 (Bagus)
nitrogen dioksida (NO2)
PM10 19 (Bagus)
partikulat Matter (PM10) debu tersuspensi
O3 91 (Moderat)
ozon (O3)
PM2,5 10 (Bagus)
partikulat Matter (PM 2.5) debu
SO2 0.1 (Bagus)
sulfur dioksida (SO2)
CO 100 (Bagus)
karbon monoksida (CO)
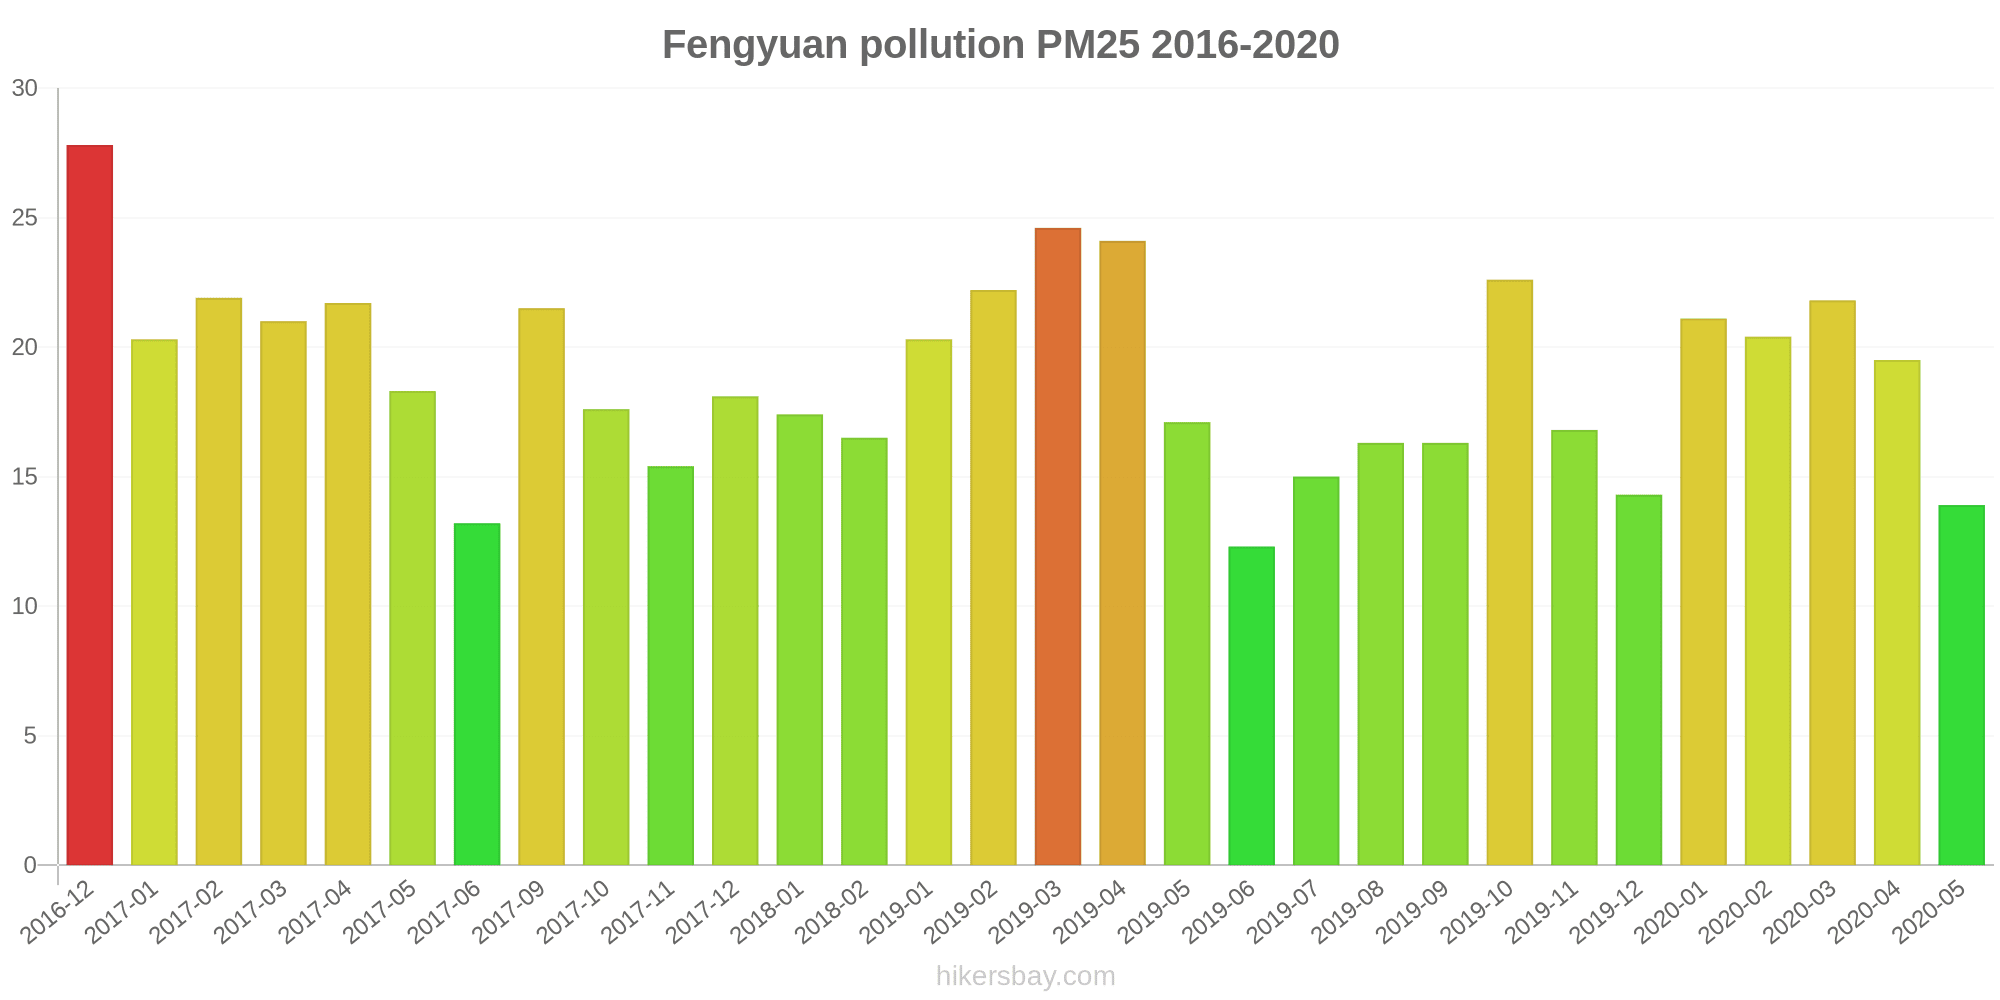
Fengyuan
Jumat, 27 Mei 2022 12.00
NO2 7.3 (Bagus)
nitrogen dioksida (NO2)
PM10 19 (Bagus)
partikulat Matter (PM10) debu tersuspensi
O3 91 (Moderat)
ozon (O3)
PM2,5 10 (Bagus)
partikulat Matter (PM 2.5) debu
SO2 0.1 (Bagus)
sulfur dioksida (SO2)
CO 100 (Bagus)
karbon monoksida (CO)
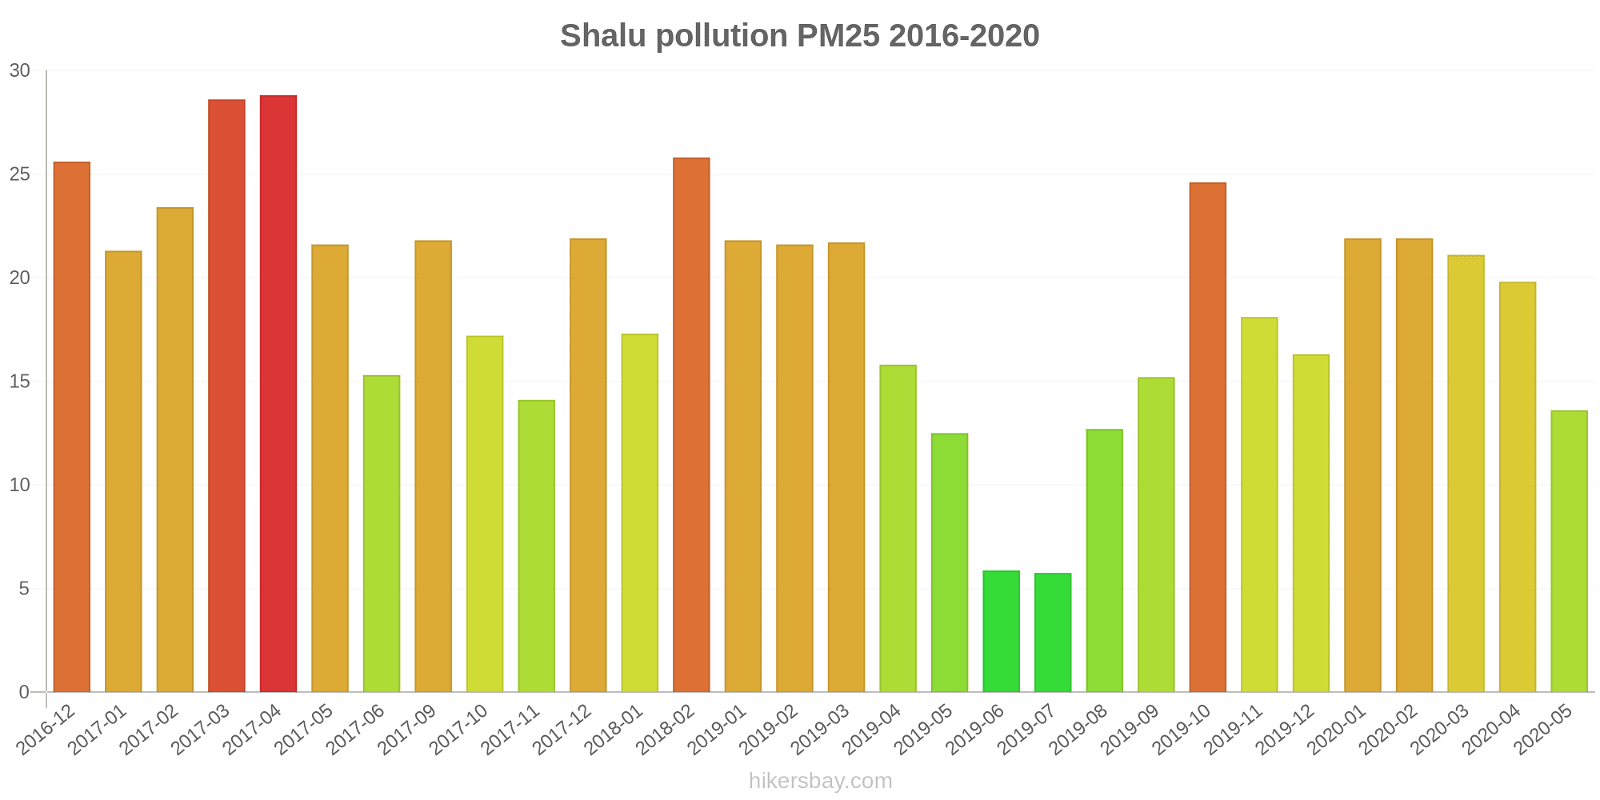
Shalu
Jumat, 27 Mei 2022 12.00
NO2 7.3 (Bagus)
nitrogen dioksida (NO2)
PM10 19 (Bagus)
partikulat Matter (PM10) debu tersuspensi
O3 91 (Moderat)
ozon (O3)
PM2,5 10 (Bagus)
partikulat Matter (PM 2.5) debu
SO2 0.1 (Bagus)
sulfur dioksida (SO2)
CO 100 (Bagus)
karbon monoksida (CO)
Xitun
Jumat, 27 Mei 2022 12.00
NO2 7.3 (Bagus)
nitrogen dioksida (NO2)
PM10 19 (Bagus)
partikulat Matter (PM10) debu tersuspensi
O3 91 (Moderat)
ozon (O3)
PM2,5 10 (Bagus)
partikulat Matter (PM 2.5) debu
SO2 0.1 (Bagus)
sulfur dioksida (SO2)
CO 100 (Bagus)
karbon monoksida (CO)
Zhongming
Jumat, 27 Mei 2022 12.00
NO2 7.3 (Bagus)
nitrogen dioksida (NO2)
PM10 19 (Bagus)
partikulat Matter (PM10) debu tersuspensi
O3 91 (Moderat)
ozon (O3)
PM2,5 10 (Bagus)
partikulat Matter (PM 2.5) debu
SO2 0.1 (Bagus)
sulfur dioksida (SO2)
CO 100 (Bagus)
karbon monoksida (CO)
Dali
index
2022-05-27
no2
20
pm10
27
o3
39
pm25
20
so2
4.9
co
240
Fengyuan
index
2022-05-27
no2
20
pm10
27
o3
39
pm25
20
so2
4.9
co
240
Shalu
index
2022-05-27
no2
20
pm10
27
o3
39
pm25
20
so2
4.9
co
240
Xitun
index
2022-05-27
no2
20
pm10
27
o3
39
pm25
20
so2
4.9
co
240
Zhongming
index
2022-05-27
no2
20
pm10
27
o3
39
pm25
20
so2
4.9
co
240
Dali
2016-12 2020-05

index
2020-05
2020-04
2020-03
2020-02
2020-01
2019-12
2019-11
2019-10
2019-09
2019-08
2019-07
2019-06
2019-05
2019-04
2019-03
2019-02
2019-01
2018-02
2018-01
2017-12
2017-11
2017-10
2017-09
2017-06
2017-05
2017-04
2017-03
2017-02
2017-01
2016-12
pm10
28
38
44
45
43
34
39
44
32
27
21
21
35
38
46
44
46
50
48
53
46
51
54
29
47
56
61
58
53
66
pm25
15
22
23
24
24
18
19
25
15
13
11
10
15
19
21
19
19
19
18
22
16
23
22
12
17
25
30
28
27
30
o3:ppm
0.03
0.03
0.03
0.03
0.02
0.02
0.03
0.04
0.04
0.03
0.02
0.02
0.02
0.03
0.03
0.02
0.02
0.02
0.02
0.02
0.02
0.03
0.04
0.02
0.03
0.03
0.03
0.03
0.02
0.02
so2:ppm
0
0
0
0
0
0
0
0
0
0
0
0
0
0
0
0
0
0
0
0
0
0
0
0
0
0
0
0
0
0
co:ppm
0.31
0.48
0.5
0.53
0.64
0.55
0.47
0.48
0.39
0.36
0.29
0.34
0.51
0.48
0.62
0.57
0.63
0.6
0.57
0.56
0.5
0.46
0.45
0.31
0.45
0.5
0.54
0.53
0.57
0.6
no2:ppm
0.01
0.02
0.02
0.02
0.02
0.02
0.02
0.02
0.01
0.01
0.01
0.01
0.02
0.02
0.02
0.02
0.02
0.02
0.02
0.02
0.02
0.01
0.02
0.01
0.02
0.02
0.02
0.02
0.02
0.02
Fengyuan
2016-12 2020-05

index
2020-05
2020-04
2020-03
2020-02
2020-01
2019-12
2019-11
2019-10
2019-09
2019-08
2019-07
2019-06
2019-05
2019-04
2019-03
2019-02
2019-01
2018-02
2018-01
2017-12
2017-11
2017-10
2017-09
2017-06
2017-05
2017-04
2017-03
2017-02
2017-01
2016-12
so2:ppm
0
0
0
0
0
0
0
0
0
0
0
0
0
0
0
0
0
0
0
0
0
0
0
0
0
0
0
0
0
0
pm25
14
20
22
20
21
14
17
23
16
16
15
12
17
24
25
22
20
17
17
18
15
18
22
13
18
22
21
22
20
28
pm10
26
32
36
33
32
24
33
39
30
25
23
17
27
36
39
37
39
32
36
40
33
37
41
21
33
39
46
40
37
45
o3:ppm
0.03
0.04
0.03
0.03
0.03
0.03
0.04
0.04
0.04
0.03
0.03
0.03
0.03
0.03
0.03
0.03
0.03
0.03
0.02
0.03
0.03
0.04
0.04
0.03
0.04
0.04
0.04
0.03
0.03
0.03
co:ppm
0.33
0.35
0.4
0.37
0.43
0.34
0.28
0.32
0.26
0.24
0.23
0.29
0.34
0.48
0.44
0.41
0.45
0.39
0.38
0.36
0.32
0.29
0.33
0.35
0.4
0.44
0.43
0.35
0.38
0.43
no2:ppm
0.01
0.01
0.01
0.01
0.01
0.01
0.01
0.01
0.01
0.01
0.01
0.01
0.01
0.01
0.01
0.01
0.01
0.01
0.01
0.01
0.01
0.01
0.01
0.01
0.01
0.01
0.01
0.01
0.01
0.01
Shalu
2016-12 2020-05
index
2020-05
2020-04
2020-03
2020-02
2020-01
2019-12
2019-11
2019-10
2019-09
2019-08
2019-07
2019-06
2019-05
2019-04
2019-03
2019-02
2019-01
2018-02
2018-01
2017-12
2017-11
2017-10
2017-09
2017-06
2017-05
2017-04
2017-03
2017-02
2017-01
2016-12
o3:ppm
0.03
0.04
0.04
0.03
0.03
0.03
0.04
0.04
0.04
0.03
0.02
0.02
0.04
0.03
0.04
0.03
0.03
0.03
0.03
0.03
0.03
0.04
0.03
0.02
0.04
0.04
0.04
0.04
0.03
0.03
pm10
24
34
38
39
37
30
38
43
29
26
22
13
30
32
41
38
43
50
39
48
39
42
44
22
37
47
54
47
49
58
so2:ppm
0
0
0
0
0
0
0
0
0
0
0
0
0
0
0
0
0
0
0
0
0
0
0
0
0
0
0
0
0
0
no2:ppm
0.01
0.01
0.01
0.02
0.01
0.01
0.01
0.01
0.01
0.01
0.01
0.01
0.01
0.01
0.02
0.01
0.01
0.01
0.01
0.01
0.01
0.01
0.01
0.01
0.02
0.02
0.02
0.01
0.01
0.02
co:ppm
0.24
0.35
0.36
0.38
0.44
0.33
0.29
0.32
0.23
0.25
0.2
0.25
0.34
0.36
0.42
0.4
0.42
0.39
0.39
0.37
0.31
0.29
0.32
0.31
0.35
0.39
0.4
0.36
0.36
0.41
pm25
14
20
21
22
22
16
18
25
15
13
5.8
5.9
13
16
22
22
22
26
17
22
14
17
22
15
22
29
29
23
21
26
Xitun
2016-12 2020-05

index
2020-05
2020-04
2020-03
2020-02
2020-01
2019-12
2019-11
2019-10
2019-09
2019-08
2019-07
2019-06
2019-05
2019-04
2019-03
2019-02
2019-01
2018-02
2018-01
2017-12
2017-11
2017-10
2017-09
2017-06
2017-05
2017-04
2017-03
2017-02
2017-01
2016-12
so2:ppm
0
0
0
0
0
0
0
0
0
0
0
0
0
0
0
0
0
0
0
0
0
0
0
0
0
0
0
0
0
0
no2:ppm
0.01
0.01
0.02
0.02
0.02
0.02
0.01
0.01
0.01
0.01
0.01
0.01
0.01
0.01
0.02
0.01
0.02
0.02
0.02
0.02
0.01
0.01
0.02
0.01
0.02
0.02
0.02
0.02
0.01
0.02
co:ppm
0.23
0.36
0.38
0.41
0.48
0.38
0.3
0.34
0.27
0.27
0.21
0.26
0.36
0.37
0.43
0.42
0.44
0.42
0.42
0.41
0.33
0.31
0.33
0.25
0.33
0.36
0.41
0.36
0.36
0.41
pm25
14
21
22
24
24
17
18
24
16
14
12
11
20
25
25
23
23
25
20
25
18
20
25
11
21
27
29
27
24
32
pm10
27
36
40
40
43
37
36
42
30
26
24
21
38
42
50
47
49
50
44
52
44
49
52
32
45
50
56
57
49
61
o3:ppm
0.03
0.04
0.04
0.03
0.03
0.03
0.04
0.04
0.04
0.03
0.02
0.02
0.03
0.03
0.03
0.03
0.03
0.03
0.03
0.03
0.03
0.04
0.03
0.02
0.03
0.04
0.04
0.03
0.03
0.03
Zhongming
2017-09 2020-05

index
2020-05
2020-04
2020-03
2020-02
2020-01
2019-12
2019-11
2019-10
2019-09
2019-08
2019-07
2019-06
2019-05
2019-04
2019-03
2019-02
2019-01
2018-02
2018-01
2017-12
2017-11
2017-10
2017-09
pm25
15
21
23
25
25
18
20
26
18
16
14
12
20
21
25
24
23
24
20
25
19
21
27
pm10
26
35
39
40
40
31
36
42
29
25
20
11
27
32
39
36
41
41
37
43
35
37
41
o3:ppm
0.03
0.03
0.03
0.03
0.03
0.02
0.03
0.04
0.04
0.03
0.02
0.02
0.03
0.03
0.03
0.02
0.02
0.03
0.02
0.03
0.03
0.04
0.04
so2:ppm
0
0
0
0
0
0
0
0
0
0
0
0
0
0
0
0
0
0
0
0
0
0
0
co:ppm
0.27
0.4
0.42
0.47
0.54
0.45
0.36
0.38
0.3
0.3
0.24
0.31
0.42
0.42
0.52
0.49
0.52
0.52
0.5
0.49
0.4
0.37
0.4
no2:ppm
0.01
0.02
0.02
0.02
0.02
0.02
0.02
0.01
0.01
0.01
0.01
0.01
0.02
0.02
0.02
0.02
0.02
0.02
0.02
0.02
0.02
0.02
0.02
* Pollution data source:
https://openaq.org
(Taiwan)
The data is licensed under CC-By 4.0
NO2 7 (Bagus)
PM10 19 (Bagus)
O3 91 (Moderat)
PM2,5 10 (Bagus)
SO2 0 (Bagus)
CO 100 (Bagus)
Data tentang polusi udara dari beberapa hari terakhir di Taichung City
| index | 2022-05-27 |
|---|---|
| no2 | 20 Good |
| pm10 | 27 Moderate |
| o3 | 39 Good |
| pm25 | 20 Moderate |
| so2 | 5 Good |
| co | 240 Good |

| index | 2020-05 | 2020-04 | 2020-03 | 2020-02 | 2020-01 | 2019-12 | 2019-11 | 2019-10 | 2019-09 | 2019-08 | 2019-07 | 2019-06 | 2019-05 | 2019-04 | 2019-03 | 2019-02 | 2019-01 | 2018-02 | 2018-01 | 2017-12 | 2017-11 | 2017-10 | 2017-09 | 2017-06 | 2017-05 | 2017-04 | 2017-03 | 2017-02 | 2017-01 | 2016-12 |
|---|---|---|---|---|---|---|---|---|---|---|---|---|---|---|---|---|---|---|---|---|---|---|---|---|---|---|---|---|---|---|
| pm25 | 14 (Moderate) | 21 (Moderate) | 22 (Moderate) | 23 (Moderate) | 23 (Moderate) | 17 (Moderate) | 18 (Moderate) | 24 (Moderate) | 16 (Moderate) | 15 (Moderate) | 11 (Good) | 10 (Good) | 17 (Moderate) | 21 (Moderate) | 24 (Moderate) | 22 (Moderate) | 21 (Moderate) | 22 (Moderate) | 19 (Moderate) | 22 (Moderate) | 17 (Moderate) | 20 (Moderate) | 23 (Moderate) | 13 (Good) | 20 (Moderate) | 26 (Moderate) | 27 (Moderate) | 25 (Moderate) | 23 (Moderate) | 29 (Moderate) |
| pm10 | 26 (Moderate) | 35 (Moderate) | 39 (Moderate) | 39 (Moderate) | 39 (Moderate) | 31 (Moderate) | 36 (Moderate) | 42 (Moderate) | 30 (Moderate) | 26 (Moderate) | 22 (Moderate) | 16 (Good) | 31 (Moderate) | 36 (Moderate) | 43 (Moderate) | 40 (Moderate) | 43 (Moderate) | 45 (Moderate) | 41 (Moderate) | 47 (Moderate) | 39 (Moderate) | 43 (Moderate) | 46 (Moderate) | 26 (Moderate) | 40 (Moderate) | 48 (Moderate) | 54 (Unhealthy for Sensitive Groups) | 50 (Unhealthy for Sensitive Groups) | 47 (Moderate) | 57 (Unhealthy for Sensitive Groups) |
| o3:ppm | 0.03 (Good) | 0.04 (Good) | 0.03 (Good) | 0.03 (Good) | 0.03 (Good) | 0.03 (Good) | 0.04 (Good) | 0.04 (Good) | 0.04 (Good) | 0.03 (Good) | 0.02 (Good) | 0.02 (Good) | 0.03 (Good) | 0.03 (Good) | 0.03 (Good) | 0.03 (Good) | 0.03 (Good) | 0.03 (Good) | 0.02 (Good) | 0.03 (Good) | 0.03 (Good) | 0.04 (Good) | 0.04 (Good) | 0.02 (Good) | 0.03 (Good) | 0.04 (Good) | 0.04 (Good) | 0.03 (Good) | 0.03 (Good) | 0.02 (Good) |
| so2:ppm | 0 (Good) | 0 (Good) | 0 (Good) | 0 (Good) | 0 (Good) | 0 (Good) | 0 (Good) | 0 (Good) | 0 (Good) | 0 (Good) | 0 (Good) | 0 (Good) | 0 (Good) | 0 (Good) | 0 (Good) | 0 (Good) | 0 (Good) | 0 (Good) | 0 (Good) | 0 (Good) | 0 (Good) | 0 (Good) | 0 (Good) | 0 (Good) | 0 (Good) | 0 (Good) | 0 (Good) | 0 (Good) | 0 (Good) | 0 (Good) |
| co:ppm | 0.28 (Good) | 0.39 (Good) | 0.41 (Good) | 0.43 (Good) | 0.51 (Good) | 0.41 (Good) | 0.34 (Good) | 0.37 (Good) | 0.29 (Good) | 0.29 (Good) | 0.23 (Good) | 0.29 (Good) | 0.39 (Good) | 0.42 (Good) | 0.48 (Good) | 0.46 (Good) | 0.49 (Good) | 0.46 (Good) | 0.45 (Good) | 0.44 (Good) | 0.37 (Good) | 0.34 (Good) | 0.36 (Good) | 0.3 (Good) | 0.38 (Good) | 0.42 (Good) | 0.44 (Good) | 0.4 (Good) | 0.41 (Good) | 0.46 (Good) |
| no2:ppm | 0.01 (Good) | 0.01 (Good) | 0.01 (Good) | 0.02 (Good) | 0.02 (Good) | 0.02 (Good) | 0.01 (Good) | 0.01 (Good) | 0.01 (Good) | 0.01 (Good) | 0.01 (Good) | 0.01 (Good) | 0.01 (Good) | 0.01 (Good) | 0.02 (Good) | 0.02 (Good) | 0.02 (Good) | 0.02 (Good) | 0.02 (Good) | 0.02 (Good) | 0.01 (Good) | 0.01 (Good) | 0.01 (Good) | 0.01 (Good) | 0.01 (Good) | 0.02 (Good) | 0.02 (Good) | 0.02 (Good) | 0.01 (Good) | 0.02 (Good) |
Hijau dan taman di kota
Taichung City 38%
Hong Kong: 52% Meksiko: 56% Filipina: 45% Korea Selatan: 61%partikulat Matter PM 2.5
Taichung City 32 (Moderate)
Kenikmatan menghabiskan waktu di kota
Taichung City 28%
Hong Kong: 43% Meksiko: 57% Filipina: 39% Korea Selatan: 43%partikulat Matter PM10
Taichung City 48 (Moderate)
Polusi udara
Taichung City 81%
Hong Kong: 67% Meksiko: 53% Filipina: 64% Korea Selatan: 69%Pembuangan sampah
Taichung City 48%
Hong Kong: 52% Meksiko: 52% Filipina: 35% Korea Selatan: 62%Ketersediaan dan kualitas air minum
Taichung City 33%
Hong Kong: 66% Meksiko: 57% Filipina: 54% Korea Selatan: 72%Kebersihan dan kerasnya
Taichung City 40%
Hong Kong: 54% Meksiko: 45% Filipina: 38% Korea Selatan: 63%Kebisingan dan polusi cahaya
Taichung City 71%
Hong Kong: 66% Meksiko: 48% Filipina: 60%Polusi air
Taichung City 77%
Hong Kong: 53% Meksiko: 55% Filipina: 74% Korea Selatan: 38%NO2 7.3 (Bagus)
nitrogen dioksida (NO2)PM10 19 (Bagus)
partikulat Matter (PM10) debu tersuspensiO3 91 (Moderat)
ozon (O3)PM2,5 10 (Bagus)
partikulat Matter (PM 2.5) debuSO2 0.1 (Bagus)
sulfur dioksida (SO2)CO 100 (Bagus)
karbon monoksida (CO)NO2 7.3 (Bagus)
nitrogen dioksida (NO2)PM10 19 (Bagus)
partikulat Matter (PM10) debu tersuspensiO3 91 (Moderat)
ozon (O3)PM2,5 10 (Bagus)
partikulat Matter (PM 2.5) debuSO2 0.1 (Bagus)
sulfur dioksida (SO2)CO 100 (Bagus)
karbon monoksida (CO)NO2 7.3 (Bagus)
nitrogen dioksida (NO2)PM10 19 (Bagus)
partikulat Matter (PM10) debu tersuspensiO3 91 (Moderat)
ozon (O3)PM2,5 10 (Bagus)
partikulat Matter (PM 2.5) debuSO2 0.1 (Bagus)
sulfur dioksida (SO2)CO 100 (Bagus)
karbon monoksida (CO)NO2 7.3 (Bagus)
nitrogen dioksida (NO2)PM10 19 (Bagus)
partikulat Matter (PM10) debu tersuspensiO3 91 (Moderat)
ozon (O3)PM2,5 10 (Bagus)
partikulat Matter (PM 2.5) debuSO2 0.1 (Bagus)
sulfur dioksida (SO2)CO 100 (Bagus)
karbon monoksida (CO)NO2 7.3 (Bagus)
nitrogen dioksida (NO2)PM10 19 (Bagus)
partikulat Matter (PM10) debu tersuspensiO3 91 (Moderat)
ozon (O3)PM2,5 10 (Bagus)
partikulat Matter (PM 2.5) debuSO2 0.1 (Bagus)
sulfur dioksida (SO2)CO 100 (Bagus)
karbon monoksida (CO)Dali
| index | 2022-05-27 |
|---|---|
| no2 | 20 |
| pm10 | 27 |
| o3 | 39 |
| pm25 | 20 |
| so2 | 4.9 |
| co | 240 |
Fengyuan
| index | 2022-05-27 |
|---|---|
| no2 | 20 |
| pm10 | 27 |
| o3 | 39 |
| pm25 | 20 |
| so2 | 4.9 |
| co | 240 |
Shalu
| index | 2022-05-27 |
|---|---|
| no2 | 20 |
| pm10 | 27 |
| o3 | 39 |
| pm25 | 20 |
| so2 | 4.9 |
| co | 240 |
Xitun
| index | 2022-05-27 |
|---|---|
| no2 | 20 |
| pm10 | 27 |
| o3 | 39 |
| pm25 | 20 |
| so2 | 4.9 |
| co | 240 |
Zhongming
| index | 2022-05-27 |
|---|---|
| no2 | 20 |
| pm10 | 27 |
| o3 | 39 |
| pm25 | 20 |
| so2 | 4.9 |
| co | 240 |
Dali
| index | 2020-05 | 2020-04 | 2020-03 | 2020-02 | 2020-01 | 2019-12 | 2019-11 | 2019-10 | 2019-09 | 2019-08 | 2019-07 | 2019-06 | 2019-05 | 2019-04 | 2019-03 | 2019-02 | 2019-01 | 2018-02 | 2018-01 | 2017-12 | 2017-11 | 2017-10 | 2017-09 | 2017-06 | 2017-05 | 2017-04 | 2017-03 | 2017-02 | 2017-01 | 2016-12 |
|---|---|---|---|---|---|---|---|---|---|---|---|---|---|---|---|---|---|---|---|---|---|---|---|---|---|---|---|---|---|---|
| pm10 | 28 | 38 | 44 | 45 | 43 | 34 | 39 | 44 | 32 | 27 | 21 | 21 | 35 | 38 | 46 | 44 | 46 | 50 | 48 | 53 | 46 | 51 | 54 | 29 | 47 | 56 | 61 | 58 | 53 | 66 |
| pm25 | 15 | 22 | 23 | 24 | 24 | 18 | 19 | 25 | 15 | 13 | 11 | 10 | 15 | 19 | 21 | 19 | 19 | 19 | 18 | 22 | 16 | 23 | 22 | 12 | 17 | 25 | 30 | 28 | 27 | 30 |
| o3:ppm | 0.03 | 0.03 | 0.03 | 0.03 | 0.02 | 0.02 | 0.03 | 0.04 | 0.04 | 0.03 | 0.02 | 0.02 | 0.02 | 0.03 | 0.03 | 0.02 | 0.02 | 0.02 | 0.02 | 0.02 | 0.02 | 0.03 | 0.04 | 0.02 | 0.03 | 0.03 | 0.03 | 0.03 | 0.02 | 0.02 |
| so2:ppm | 0 | 0 | 0 | 0 | 0 | 0 | 0 | 0 | 0 | 0 | 0 | 0 | 0 | 0 | 0 | 0 | 0 | 0 | 0 | 0 | 0 | 0 | 0 | 0 | 0 | 0 | 0 | 0 | 0 | 0 |
| co:ppm | 0.31 | 0.48 | 0.5 | 0.53 | 0.64 | 0.55 | 0.47 | 0.48 | 0.39 | 0.36 | 0.29 | 0.34 | 0.51 | 0.48 | 0.62 | 0.57 | 0.63 | 0.6 | 0.57 | 0.56 | 0.5 | 0.46 | 0.45 | 0.31 | 0.45 | 0.5 | 0.54 | 0.53 | 0.57 | 0.6 |
| no2:ppm | 0.01 | 0.02 | 0.02 | 0.02 | 0.02 | 0.02 | 0.02 | 0.02 | 0.01 | 0.01 | 0.01 | 0.01 | 0.02 | 0.02 | 0.02 | 0.02 | 0.02 | 0.02 | 0.02 | 0.02 | 0.02 | 0.01 | 0.02 | 0.01 | 0.02 | 0.02 | 0.02 | 0.02 | 0.02 | 0.02 |
Fengyuan
| index | 2020-05 | 2020-04 | 2020-03 | 2020-02 | 2020-01 | 2019-12 | 2019-11 | 2019-10 | 2019-09 | 2019-08 | 2019-07 | 2019-06 | 2019-05 | 2019-04 | 2019-03 | 2019-02 | 2019-01 | 2018-02 | 2018-01 | 2017-12 | 2017-11 | 2017-10 | 2017-09 | 2017-06 | 2017-05 | 2017-04 | 2017-03 | 2017-02 | 2017-01 | 2016-12 |
|---|---|---|---|---|---|---|---|---|---|---|---|---|---|---|---|---|---|---|---|---|---|---|---|---|---|---|---|---|---|---|
| so2:ppm | 0 | 0 | 0 | 0 | 0 | 0 | 0 | 0 | 0 | 0 | 0 | 0 | 0 | 0 | 0 | 0 | 0 | 0 | 0 | 0 | 0 | 0 | 0 | 0 | 0 | 0 | 0 | 0 | 0 | 0 |
| pm25 | 14 | 20 | 22 | 20 | 21 | 14 | 17 | 23 | 16 | 16 | 15 | 12 | 17 | 24 | 25 | 22 | 20 | 17 | 17 | 18 | 15 | 18 | 22 | 13 | 18 | 22 | 21 | 22 | 20 | 28 |
| pm10 | 26 | 32 | 36 | 33 | 32 | 24 | 33 | 39 | 30 | 25 | 23 | 17 | 27 | 36 | 39 | 37 | 39 | 32 | 36 | 40 | 33 | 37 | 41 | 21 | 33 | 39 | 46 | 40 | 37 | 45 |
| o3:ppm | 0.03 | 0.04 | 0.03 | 0.03 | 0.03 | 0.03 | 0.04 | 0.04 | 0.04 | 0.03 | 0.03 | 0.03 | 0.03 | 0.03 | 0.03 | 0.03 | 0.03 | 0.03 | 0.02 | 0.03 | 0.03 | 0.04 | 0.04 | 0.03 | 0.04 | 0.04 | 0.04 | 0.03 | 0.03 | 0.03 |
| co:ppm | 0.33 | 0.35 | 0.4 | 0.37 | 0.43 | 0.34 | 0.28 | 0.32 | 0.26 | 0.24 | 0.23 | 0.29 | 0.34 | 0.48 | 0.44 | 0.41 | 0.45 | 0.39 | 0.38 | 0.36 | 0.32 | 0.29 | 0.33 | 0.35 | 0.4 | 0.44 | 0.43 | 0.35 | 0.38 | 0.43 |
| no2:ppm | 0.01 | 0.01 | 0.01 | 0.01 | 0.01 | 0.01 | 0.01 | 0.01 | 0.01 | 0.01 | 0.01 | 0.01 | 0.01 | 0.01 | 0.01 | 0.01 | 0.01 | 0.01 | 0.01 | 0.01 | 0.01 | 0.01 | 0.01 | 0.01 | 0.01 | 0.01 | 0.01 | 0.01 | 0.01 | 0.01 |
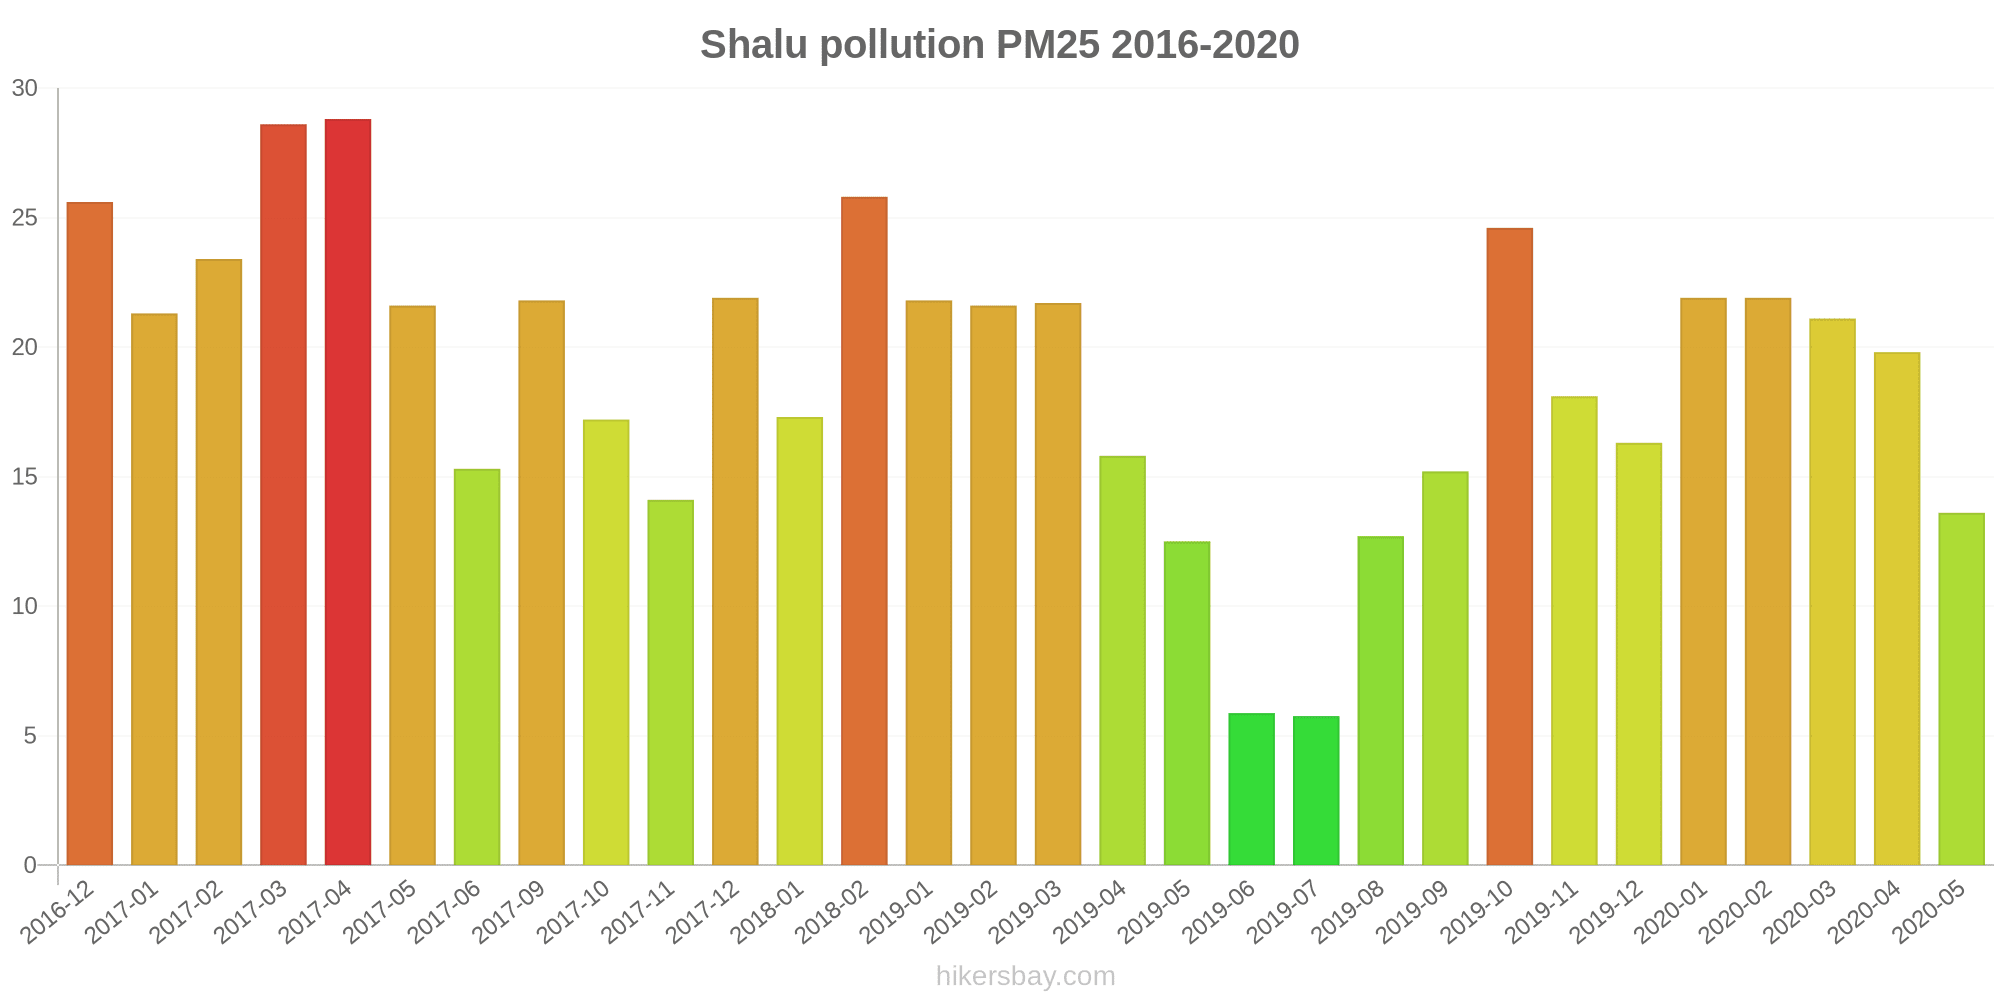
Shalu
| index | 2020-05 | 2020-04 | 2020-03 | 2020-02 | 2020-01 | 2019-12 | 2019-11 | 2019-10 | 2019-09 | 2019-08 | 2019-07 | 2019-06 | 2019-05 | 2019-04 | 2019-03 | 2019-02 | 2019-01 | 2018-02 | 2018-01 | 2017-12 | 2017-11 | 2017-10 | 2017-09 | 2017-06 | 2017-05 | 2017-04 | 2017-03 | 2017-02 | 2017-01 | 2016-12 |
|---|---|---|---|---|---|---|---|---|---|---|---|---|---|---|---|---|---|---|---|---|---|---|---|---|---|---|---|---|---|---|
| o3:ppm | 0.03 | 0.04 | 0.04 | 0.03 | 0.03 | 0.03 | 0.04 | 0.04 | 0.04 | 0.03 | 0.02 | 0.02 | 0.04 | 0.03 | 0.04 | 0.03 | 0.03 | 0.03 | 0.03 | 0.03 | 0.03 | 0.04 | 0.03 | 0.02 | 0.04 | 0.04 | 0.04 | 0.04 | 0.03 | 0.03 |
| pm10 | 24 | 34 | 38 | 39 | 37 | 30 | 38 | 43 | 29 | 26 | 22 | 13 | 30 | 32 | 41 | 38 | 43 | 50 | 39 | 48 | 39 | 42 | 44 | 22 | 37 | 47 | 54 | 47 | 49 | 58 |
| so2:ppm | 0 | 0 | 0 | 0 | 0 | 0 | 0 | 0 | 0 | 0 | 0 | 0 | 0 | 0 | 0 | 0 | 0 | 0 | 0 | 0 | 0 | 0 | 0 | 0 | 0 | 0 | 0 | 0 | 0 | 0 |
| no2:ppm | 0.01 | 0.01 | 0.01 | 0.02 | 0.01 | 0.01 | 0.01 | 0.01 | 0.01 | 0.01 | 0.01 | 0.01 | 0.01 | 0.01 | 0.02 | 0.01 | 0.01 | 0.01 | 0.01 | 0.01 | 0.01 | 0.01 | 0.01 | 0.01 | 0.02 | 0.02 | 0.02 | 0.01 | 0.01 | 0.02 |
| co:ppm | 0.24 | 0.35 | 0.36 | 0.38 | 0.44 | 0.33 | 0.29 | 0.32 | 0.23 | 0.25 | 0.2 | 0.25 | 0.34 | 0.36 | 0.42 | 0.4 | 0.42 | 0.39 | 0.39 | 0.37 | 0.31 | 0.29 | 0.32 | 0.31 | 0.35 | 0.39 | 0.4 | 0.36 | 0.36 | 0.41 |
| pm25 | 14 | 20 | 21 | 22 | 22 | 16 | 18 | 25 | 15 | 13 | 5.8 | 5.9 | 13 | 16 | 22 | 22 | 22 | 26 | 17 | 22 | 14 | 17 | 22 | 15 | 22 | 29 | 29 | 23 | 21 | 26 |
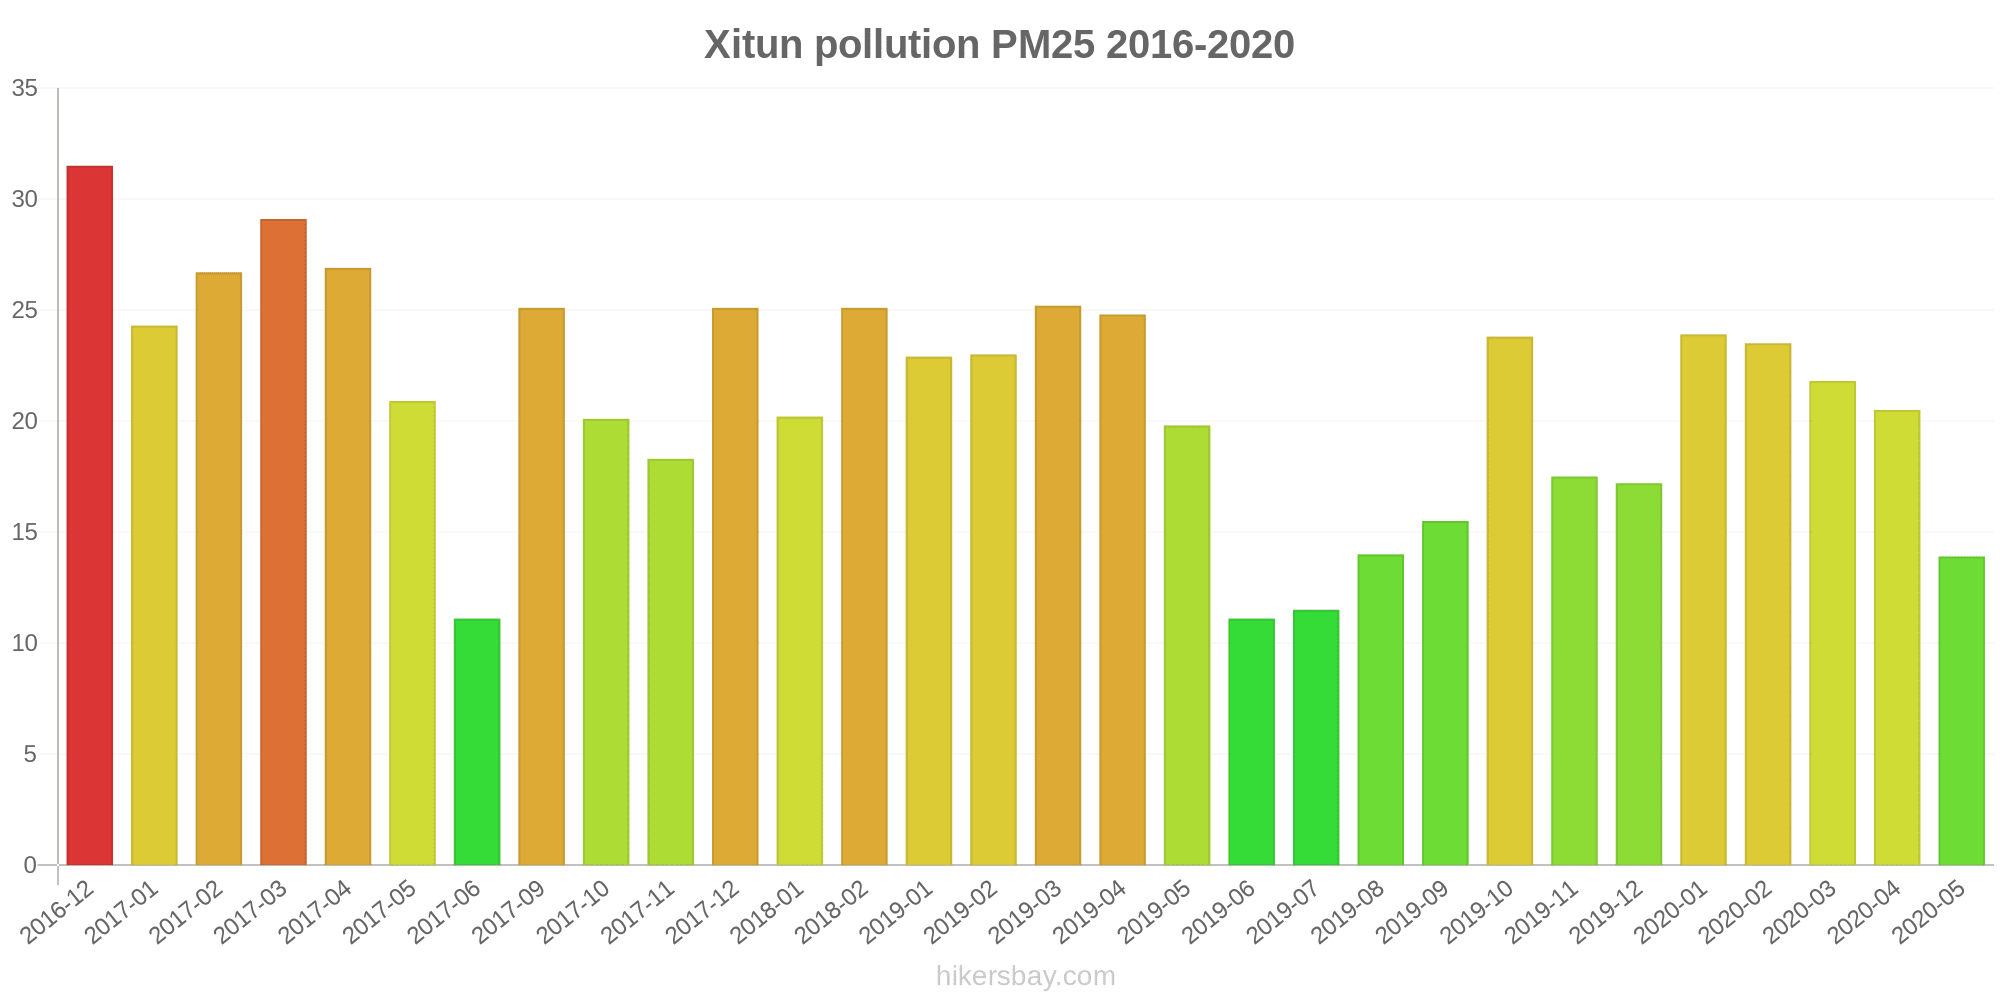
Xitun
| index | 2020-05 | 2020-04 | 2020-03 | 2020-02 | 2020-01 | 2019-12 | 2019-11 | 2019-10 | 2019-09 | 2019-08 | 2019-07 | 2019-06 | 2019-05 | 2019-04 | 2019-03 | 2019-02 | 2019-01 | 2018-02 | 2018-01 | 2017-12 | 2017-11 | 2017-10 | 2017-09 | 2017-06 | 2017-05 | 2017-04 | 2017-03 | 2017-02 | 2017-01 | 2016-12 |
|---|---|---|---|---|---|---|---|---|---|---|---|---|---|---|---|---|---|---|---|---|---|---|---|---|---|---|---|---|---|---|
| so2:ppm | 0 | 0 | 0 | 0 | 0 | 0 | 0 | 0 | 0 | 0 | 0 | 0 | 0 | 0 | 0 | 0 | 0 | 0 | 0 | 0 | 0 | 0 | 0 | 0 | 0 | 0 | 0 | 0 | 0 | 0 |
| no2:ppm | 0.01 | 0.01 | 0.02 | 0.02 | 0.02 | 0.02 | 0.01 | 0.01 | 0.01 | 0.01 | 0.01 | 0.01 | 0.01 | 0.01 | 0.02 | 0.01 | 0.02 | 0.02 | 0.02 | 0.02 | 0.01 | 0.01 | 0.02 | 0.01 | 0.02 | 0.02 | 0.02 | 0.02 | 0.01 | 0.02 |
| co:ppm | 0.23 | 0.36 | 0.38 | 0.41 | 0.48 | 0.38 | 0.3 | 0.34 | 0.27 | 0.27 | 0.21 | 0.26 | 0.36 | 0.37 | 0.43 | 0.42 | 0.44 | 0.42 | 0.42 | 0.41 | 0.33 | 0.31 | 0.33 | 0.25 | 0.33 | 0.36 | 0.41 | 0.36 | 0.36 | 0.41 |
| pm25 | 14 | 21 | 22 | 24 | 24 | 17 | 18 | 24 | 16 | 14 | 12 | 11 | 20 | 25 | 25 | 23 | 23 | 25 | 20 | 25 | 18 | 20 | 25 | 11 | 21 | 27 | 29 | 27 | 24 | 32 |
| pm10 | 27 | 36 | 40 | 40 | 43 | 37 | 36 | 42 | 30 | 26 | 24 | 21 | 38 | 42 | 50 | 47 | 49 | 50 | 44 | 52 | 44 | 49 | 52 | 32 | 45 | 50 | 56 | 57 | 49 | 61 |
| o3:ppm | 0.03 | 0.04 | 0.04 | 0.03 | 0.03 | 0.03 | 0.04 | 0.04 | 0.04 | 0.03 | 0.02 | 0.02 | 0.03 | 0.03 | 0.03 | 0.03 | 0.03 | 0.03 | 0.03 | 0.03 | 0.03 | 0.04 | 0.03 | 0.02 | 0.03 | 0.04 | 0.04 | 0.03 | 0.03 | 0.03 |
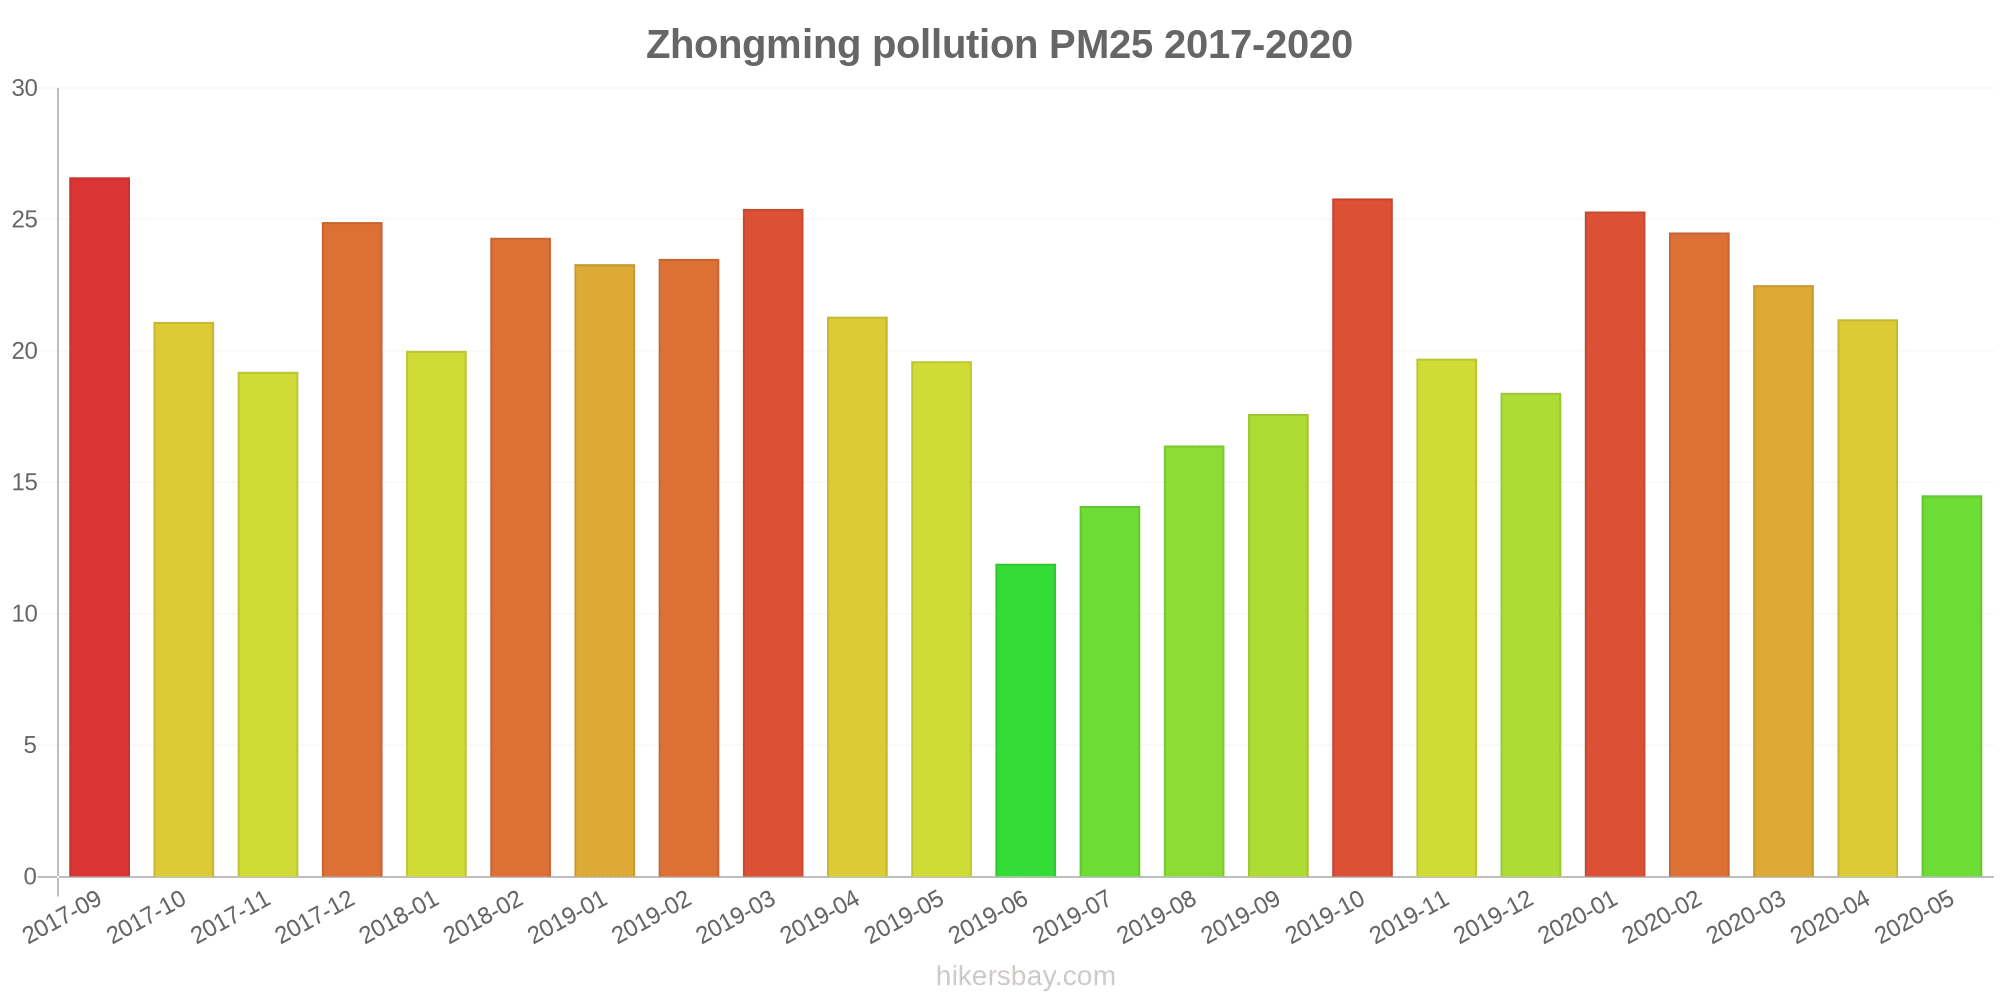
Zhongming
| index | 2020-05 | 2020-04 | 2020-03 | 2020-02 | 2020-01 | 2019-12 | 2019-11 | 2019-10 | 2019-09 | 2019-08 | 2019-07 | 2019-06 | 2019-05 | 2019-04 | 2019-03 | 2019-02 | 2019-01 | 2018-02 | 2018-01 | 2017-12 | 2017-11 | 2017-10 | 2017-09 |
|---|---|---|---|---|---|---|---|---|---|---|---|---|---|---|---|---|---|---|---|---|---|---|---|
| pm25 | 15 | 21 | 23 | 25 | 25 | 18 | 20 | 26 | 18 | 16 | 14 | 12 | 20 | 21 | 25 | 24 | 23 | 24 | 20 | 25 | 19 | 21 | 27 |
| pm10 | 26 | 35 | 39 | 40 | 40 | 31 | 36 | 42 | 29 | 25 | 20 | 11 | 27 | 32 | 39 | 36 | 41 | 41 | 37 | 43 | 35 | 37 | 41 |
| o3:ppm | 0.03 | 0.03 | 0.03 | 0.03 | 0.03 | 0.02 | 0.03 | 0.04 | 0.04 | 0.03 | 0.02 | 0.02 | 0.03 | 0.03 | 0.03 | 0.02 | 0.02 | 0.03 | 0.02 | 0.03 | 0.03 | 0.04 | 0.04 |
| so2:ppm | 0 | 0 | 0 | 0 | 0 | 0 | 0 | 0 | 0 | 0 | 0 | 0 | 0 | 0 | 0 | 0 | 0 | 0 | 0 | 0 | 0 | 0 | 0 |
| co:ppm | 0.27 | 0.4 | 0.42 | 0.47 | 0.54 | 0.45 | 0.36 | 0.38 | 0.3 | 0.3 | 0.24 | 0.31 | 0.42 | 0.42 | 0.52 | 0.49 | 0.52 | 0.52 | 0.5 | 0.49 | 0.4 | 0.37 | 0.4 |
| no2:ppm | 0.01 | 0.02 | 0.02 | 0.02 | 0.02 | 0.02 | 0.02 | 0.01 | 0.01 | 0.01 | 0.01 | 0.01 | 0.02 | 0.02 | 0.02 | 0.02 | 0.02 | 0.02 | 0.02 | 0.02 | 0.02 | 0.02 | 0.02 |