Polusi udara di Tianzhong: indeks kualitas udara real-time dan siaga asap.
Perkiraan kualitas polusi dan udara untuk Tianzhong. Hari ini Minggu, 10 Mei 2026. Nilai polusi udara berikut telah tercatat untuk Tianzhong:- nitrogen dioksida (NO2) - 7 (Bagus)
- partikulat Matter (PM10) debu tersuspensi - 19 (Bagus)
- ozon (O3) - 91 (Moderat)
- partikulat Matter (PM 2.5) debu - 10 (Bagus)
- sulfur dioksida (SO2) - 0 (Bagus)
- karbon monoksida (CO) - 100 (Bagus)

Apa kualitas udara di Tianzhong hari ini? Apakah udara tercemar di Tianzhong?. Apakah ada Smog?
Seberapa tinggi tingkat NO2? (nitrogen dioksida (NO2))
7 (Bagus)
Apa tingkat PM10 hari ini di Tianzhong? (partikulat Matter (PM10) debu tersuspensi)
Level saat ini dari partikulat Matter PM10 di Tianzhong adalah:
19 (Bagus)
Nilai PM10 tertinggi biasanya terjadi di bulan: 64 (April 2017).
Nilai terendah dari partikulat PM10 pencemaran Tianzhong biasanya dicatat di: Agustus (18).
Bagaimana tingkat O3 hari ini di Tianzhong? (ozon (O3))
91 (Moderat)
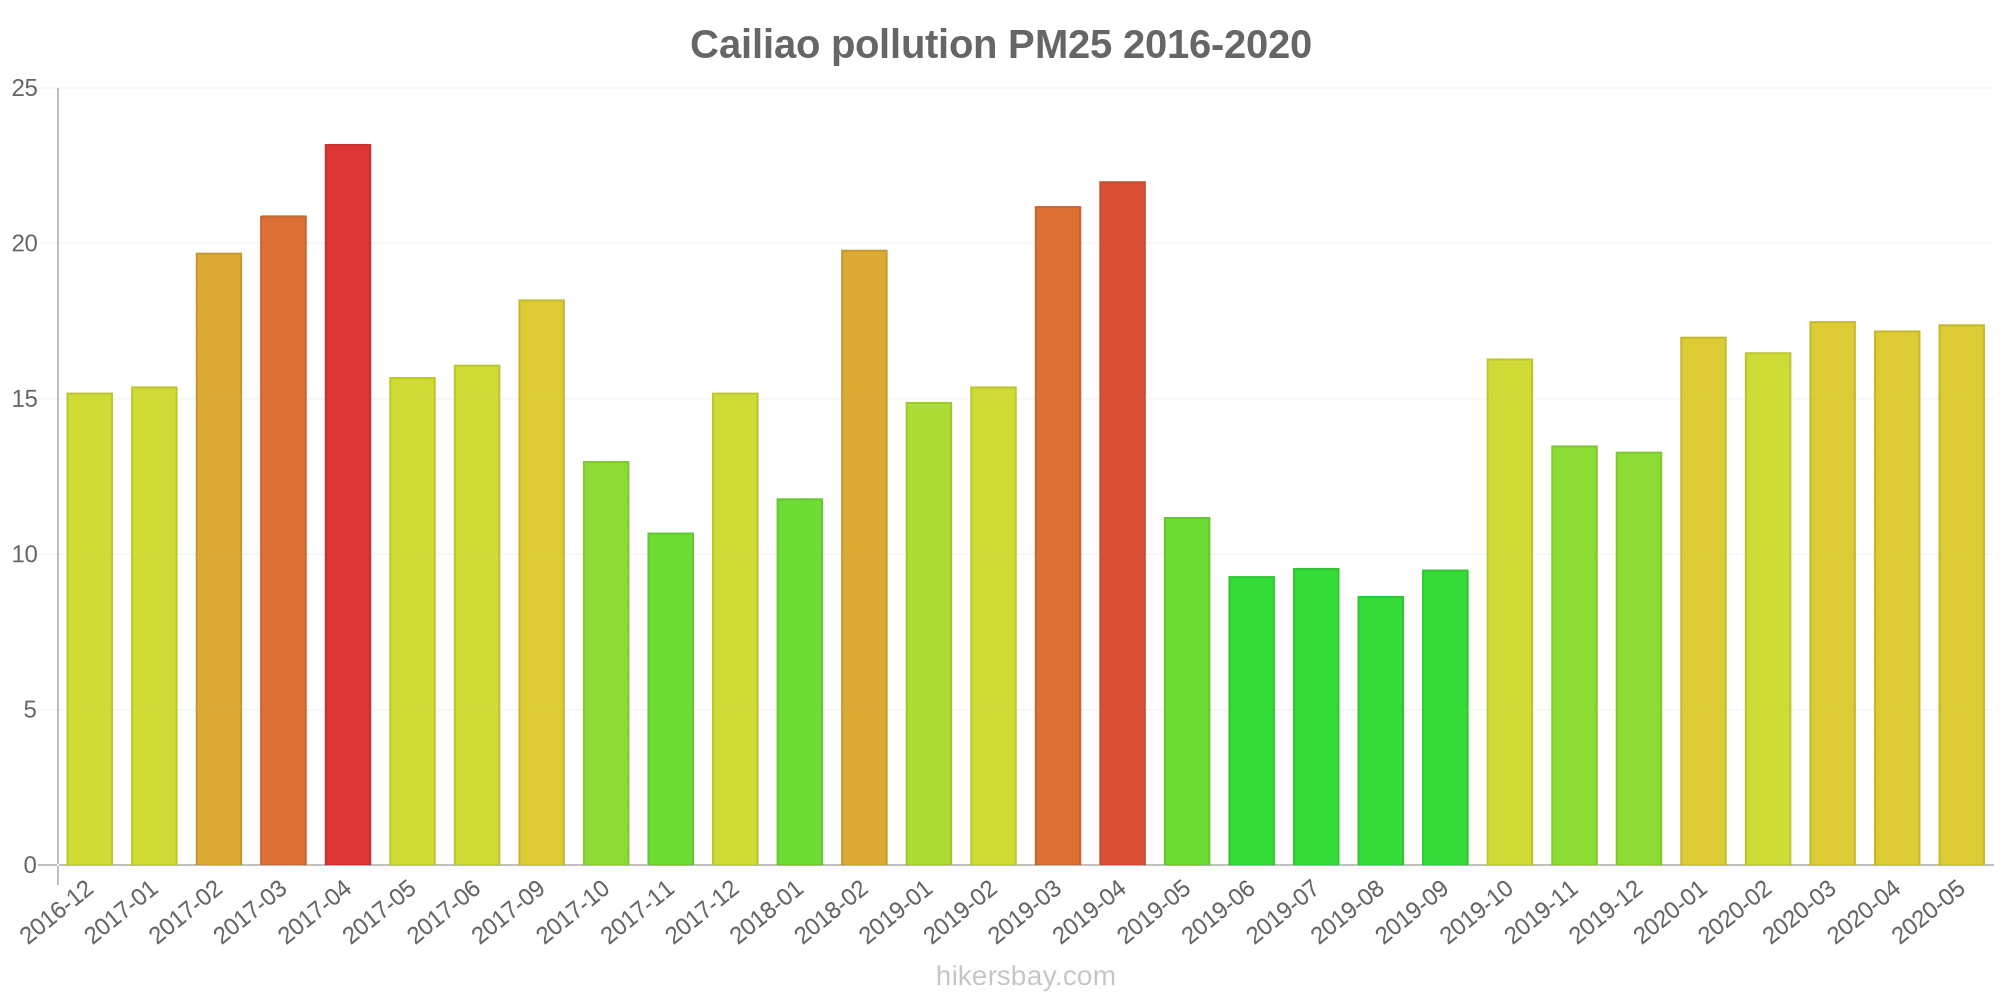
Apa tingkat saat PM 2,5 in Tianzhong? (partikulat Matter (PM 2.5) debu)
Hari ini PM 2.5 tingkat:
10 (Bagus)
Sebagai perbandingan, tingkat tertinggi PM 2,5 in Tianzhong dalam 7 hari terakhir adalah: 20 (Jumat, 27 Mei 2022) dan Terendah: 20 (Jumat, 27 Mei 2022).
Nilai tertinggi PM 2.5 direkam: 23 (April 2017).
Tingkat terendah dari partikulat Matter PM 2.5 polusi terjadi di bulan: Agustus (8.7).
Apa tingkat polusi SO2? (sulfur dioksida (SO2))
0 (Bagus)
Seberapa tinggi tingkat CO? (karbon monoksida (CO))
100 (Bagus)
Data saat ini Jumat, 27 Mei 2022 12.00
NO2 7 (Bagus)
PM10 19 (Bagus)
O3 91 (Moderat)
PM2,5 10 (Bagus)
SO2 0 (Bagus)
CO 100 (Bagus)
Data tentang polusi udara dari beberapa hari terakhir di Tianzhong
index
2022-05-27
no2
20
Good
pm10
27
Moderate
o3
39
Good
pm25
20
Moderate
so2
5
Good
co
240
Good
data source »
Polusi udara di Tianzhong dari Desember 2016 ke Mei 2020

index
2020-05
2020-04
2020-03
2020-02
2020-01
2019-12
2019-11
2019-10
2019-09
2019-08
2019-07
2019-06
2019-05
2019-04
2019-03
2019-02
2019-01
2018-02
2018-01
2017-12
2017-11
2017-10
2017-09
2017-06
2017-05
2017-04
2017-03
2017-02
2017-01
2016-12
pm25
17 (Moderate)
17 (Moderate)
18 (Moderate)
17 (Moderate)
17 (Moderate)
13 (Moderate)
14 (Moderate)
16 (Moderate)
9.5 (Good)
8.7 (Good)
9.6 (Good)
9.3 (Good)
11 (Good)
22 (Moderate)
21 (Moderate)
15 (Moderate)
15 (Moderate)
20 (Moderate)
12 (Good)
15 (Moderate)
11 (Good)
13 (Moderate)
18 (Moderate)
16 (Moderate)
16 (Moderate)
23 (Moderate)
21 (Moderate)
20 (Moderate)
15 (Moderate)
15 (Moderate)
pm10
29 (Moderate)
30 (Moderate)
31 (Moderate)
28 (Moderate)
27 (Moderate)
23 (Moderate)
28 (Moderate)
31 (Moderate)
20 (Moderate)
18 (Good)
21 (Moderate)
26 (Moderate)
32 (Moderate)
37 (Moderate)
38 (Moderate)
30 (Moderate)
32 (Moderate)
43 (Moderate)
27 (Moderate)
32 (Moderate)
29 (Moderate)
34 (Moderate)
42 (Moderate)
51 (Unhealthy for Sensitive Groups)
52 (Unhealthy for Sensitive Groups)
64 (Unhealthy for Sensitive Groups)
61 (Unhealthy for Sensitive Groups)
56 (Unhealthy for Sensitive Groups)
51 (Unhealthy for Sensitive Groups)
55 (Unhealthy for Sensitive Groups)
o3:ppm
0.02 (Good)
0.03 (Good)
0.03 (Good)
0.03 (Good)
0.03 (Good)
0.02 (Good)
0.03 (Good)
0.04 (Good)
0.02 (Good)
0.02 (Good)
0.02 (Good)
0.02 (Good)
0.04 (Good)
0.03 (Good)
0.04 (Good)
0.03 (Good)
0.02 (Good)
0.03 (Good)
0.03 (Good)
0.03 (Good)
0.03 (Good)
0.03 (Good)
0.03 (Good)
- (Good)
- (Good)
- (Good)
- (Good)
- (Good)
- (Good)
- (Good)
so2:ppm
0 (Good)
0 (Good)
0 (Good)
0 (Good)
0 (Good)
0 (Good)
0 (Good)
0 (Good)
0 (Good)
0 (Good)
0 (Good)
0 (Good)
0 (Good)
0 (Good)
0 (Good)
0 (Good)
0 (Good)
0 (Good)
0 (Good)
0 (Good)
0 (Good)
0 (Good)
0 (Good)
0 (Good)
0 (Good)
0 (Good)
0 (Good)
0 (Good)
0 (Good)
0 (Good)
co:ppm
0.46 (Good)
0.51 (Good)
0.53 (Good)
0.56 (Good)
0.59 (Good)
0.53 (Good)
0.39 (Good)
0.41 (Good)
0.38 (Good)
0.32 (Good)
0.39 (Good)
0.48 (Good)
0.45 (Good)
0.56 (Good)
0.56 (Good)
0.54 (Good)
0.59 (Good)
0.62 (Good)
0.47 (Good)
0.47 (Good)
0.44 (Good)
0.4 (Good)
0.43 (Good)
1.4 (Good)
1.3 (Good)
1.4 (Good)
1.5 (Good)
1.4 (Good)
1.4 (Good)
1.4 (Good)
no2:ppm
0.02 (Good)
0.02 (Good)
0.02 (Good)
0.02 (Good)
0.02 (Good)
0.02 (Good)
0.01 (Good)
0.01 (Good)
0.01 (Good)
0.01 (Good)
0.01 (Good)
0.02 (Good)
0.02 (Good)
0.02 (Good)
0.02 (Good)
0.02 (Good)
0.02 (Good)
0.02 (Good)
0.02 (Good)
0.02 (Good)
0.02 (Good)
0.01 (Good)
0.02 (Good)
0.03 (Good)
0.04 (Good)
0.04 (Good)
0.05 (Good)
0.04 (Good)
0.04 (Good)
0.04 (Good)
data source »
Cailiao
Jumat, 27 Mei 2022 12.00
NO2 7.3 (Bagus)
nitrogen dioksida (NO2)
PM10 19 (Bagus)
partikulat Matter (PM10) debu tersuspensi
O3 91 (Moderat)
ozon (O3)
PM2,5 10 (Bagus)
partikulat Matter (PM 2.5) debu
SO2 0.1 (Bagus)
sulfur dioksida (SO2)
CO 100 (Bagus)
karbon monoksida (CO)
Cailiao
index
2022-05-27
no2
20
pm10
27
o3
39
pm25
20
so2
4.9
co
240
Cailiao
2016-12 2020-05

index
2020-05
2020-04
2020-03
2020-02
2020-01
2019-12
2019-11
2019-10
2019-09
2019-08
2019-07
2019-06
2019-05
2019-04
2019-03
2019-02
2019-01
2018-02
2018-01
2017-12
2017-11
2017-10
2017-09
2017-06
2017-05
2017-04
2017-03
2017-02
2017-01
2016-12
pm25
17
17
18
17
17
13
14
16
9.5
8.7
9.6
9.3
11
22
21
15
15
20
12
15
11
13
18
16
16
23
21
20
15
15
no2:ppm
0.02
0.02
0.02
0.02
0.02
0.02
0.01
0.01
0.01
0.01
0.01
0.02
0.02
0.02
0.02
0.02
0.02
0.02
0.02
0.02
0.02
0.01
0.02
0.03
0.04
0.04
0.05
0.04
0.04
0.04
so2:ppm
0
0
0
0
0
0
0
0
0
0
0
0
0
0
0
0
0
0
0
0
0
0
0
0
0
0
0
0
0
0
co:ppm
0.46
0.51
0.53
0.56
0.59
0.53
0.39
0.41
0.38
0.32
0.39
0.48
0.45
0.56
0.56
0.54
0.59
0.62
0.47
0.47
0.44
0.4
0.43
1.4
1.3
1.4
1.5
1.4
1.4
1.4
pm10
29
30
31
28
27
23
28
31
20
18
21
26
32
37
38
30
32
43
27
32
29
34
42
51
52
64
61
56
51
55
o3:ppm
0.02
0.03
0.03
0.03
0.03
0.02
0.03
0.04
0.02
0.02
0.02
0.02
0.04
0.03
0.04
0.03
0.02
0.03
0.03
0.03
0.03
0.03
0.03
-
-
-
-
-
-
-
* Pollution data source:
https://openaq.org
(Taiwan)
The data is licensed under CC-By 4.0
NO2 7 (Bagus)
PM10 19 (Bagus)
O3 91 (Moderat)
PM2,5 10 (Bagus)
SO2 0 (Bagus)
CO 100 (Bagus)
Data tentang polusi udara dari beberapa hari terakhir di Tianzhong
| index | 2022-05-27 |
|---|---|
| no2 | 20 Good |
| pm10 | 27 Moderate |
| o3 | 39 Good |
| pm25 | 20 Moderate |
| so2 | 5 Good |
| co | 240 Good |

| index | 2020-05 | 2020-04 | 2020-03 | 2020-02 | 2020-01 | 2019-12 | 2019-11 | 2019-10 | 2019-09 | 2019-08 | 2019-07 | 2019-06 | 2019-05 | 2019-04 | 2019-03 | 2019-02 | 2019-01 | 2018-02 | 2018-01 | 2017-12 | 2017-11 | 2017-10 | 2017-09 | 2017-06 | 2017-05 | 2017-04 | 2017-03 | 2017-02 | 2017-01 | 2016-12 |
|---|---|---|---|---|---|---|---|---|---|---|---|---|---|---|---|---|---|---|---|---|---|---|---|---|---|---|---|---|---|---|
| pm25 | 17 (Moderate) | 17 (Moderate) | 18 (Moderate) | 17 (Moderate) | 17 (Moderate) | 13 (Moderate) | 14 (Moderate) | 16 (Moderate) | 9.5 (Good) | 8.7 (Good) | 9.6 (Good) | 9.3 (Good) | 11 (Good) | 22 (Moderate) | 21 (Moderate) | 15 (Moderate) | 15 (Moderate) | 20 (Moderate) | 12 (Good) | 15 (Moderate) | 11 (Good) | 13 (Moderate) | 18 (Moderate) | 16 (Moderate) | 16 (Moderate) | 23 (Moderate) | 21 (Moderate) | 20 (Moderate) | 15 (Moderate) | 15 (Moderate) |
| pm10 | 29 (Moderate) | 30 (Moderate) | 31 (Moderate) | 28 (Moderate) | 27 (Moderate) | 23 (Moderate) | 28 (Moderate) | 31 (Moderate) | 20 (Moderate) | 18 (Good) | 21 (Moderate) | 26 (Moderate) | 32 (Moderate) | 37 (Moderate) | 38 (Moderate) | 30 (Moderate) | 32 (Moderate) | 43 (Moderate) | 27 (Moderate) | 32 (Moderate) | 29 (Moderate) | 34 (Moderate) | 42 (Moderate) | 51 (Unhealthy for Sensitive Groups) | 52 (Unhealthy for Sensitive Groups) | 64 (Unhealthy for Sensitive Groups) | 61 (Unhealthy for Sensitive Groups) | 56 (Unhealthy for Sensitive Groups) | 51 (Unhealthy for Sensitive Groups) | 55 (Unhealthy for Sensitive Groups) |
| o3:ppm | 0.02 (Good) | 0.03 (Good) | 0.03 (Good) | 0.03 (Good) | 0.03 (Good) | 0.02 (Good) | 0.03 (Good) | 0.04 (Good) | 0.02 (Good) | 0.02 (Good) | 0.02 (Good) | 0.02 (Good) | 0.04 (Good) | 0.03 (Good) | 0.04 (Good) | 0.03 (Good) | 0.02 (Good) | 0.03 (Good) | 0.03 (Good) | 0.03 (Good) | 0.03 (Good) | 0.03 (Good) | 0.03 (Good) | - (Good) | - (Good) | - (Good) | - (Good) | - (Good) | - (Good) | - (Good) |
| so2:ppm | 0 (Good) | 0 (Good) | 0 (Good) | 0 (Good) | 0 (Good) | 0 (Good) | 0 (Good) | 0 (Good) | 0 (Good) | 0 (Good) | 0 (Good) | 0 (Good) | 0 (Good) | 0 (Good) | 0 (Good) | 0 (Good) | 0 (Good) | 0 (Good) | 0 (Good) | 0 (Good) | 0 (Good) | 0 (Good) | 0 (Good) | 0 (Good) | 0 (Good) | 0 (Good) | 0 (Good) | 0 (Good) | 0 (Good) | 0 (Good) |
| co:ppm | 0.46 (Good) | 0.51 (Good) | 0.53 (Good) | 0.56 (Good) | 0.59 (Good) | 0.53 (Good) | 0.39 (Good) | 0.41 (Good) | 0.38 (Good) | 0.32 (Good) | 0.39 (Good) | 0.48 (Good) | 0.45 (Good) | 0.56 (Good) | 0.56 (Good) | 0.54 (Good) | 0.59 (Good) | 0.62 (Good) | 0.47 (Good) | 0.47 (Good) | 0.44 (Good) | 0.4 (Good) | 0.43 (Good) | 1.4 (Good) | 1.3 (Good) | 1.4 (Good) | 1.5 (Good) | 1.4 (Good) | 1.4 (Good) | 1.4 (Good) |
| no2:ppm | 0.02 (Good) | 0.02 (Good) | 0.02 (Good) | 0.02 (Good) | 0.02 (Good) | 0.02 (Good) | 0.01 (Good) | 0.01 (Good) | 0.01 (Good) | 0.01 (Good) | 0.01 (Good) | 0.02 (Good) | 0.02 (Good) | 0.02 (Good) | 0.02 (Good) | 0.02 (Good) | 0.02 (Good) | 0.02 (Good) | 0.02 (Good) | 0.02 (Good) | 0.02 (Good) | 0.01 (Good) | 0.02 (Good) | 0.03 (Good) | 0.04 (Good) | 0.04 (Good) | 0.05 (Good) | 0.04 (Good) | 0.04 (Good) | 0.04 (Good) |
NO2 7.3 (Bagus)
nitrogen dioksida (NO2)PM10 19 (Bagus)
partikulat Matter (PM10) debu tersuspensiO3 91 (Moderat)
ozon (O3)PM2,5 10 (Bagus)
partikulat Matter (PM 2.5) debuSO2 0.1 (Bagus)
sulfur dioksida (SO2)CO 100 (Bagus)
karbon monoksida (CO)Cailiao
| index | 2022-05-27 |
|---|---|
| no2 | 20 |
| pm10 | 27 |
| o3 | 39 |
| pm25 | 20 |
| so2 | 4.9 |
| co | 240 |
Cailiao
| index | 2020-05 | 2020-04 | 2020-03 | 2020-02 | 2020-01 | 2019-12 | 2019-11 | 2019-10 | 2019-09 | 2019-08 | 2019-07 | 2019-06 | 2019-05 | 2019-04 | 2019-03 | 2019-02 | 2019-01 | 2018-02 | 2018-01 | 2017-12 | 2017-11 | 2017-10 | 2017-09 | 2017-06 | 2017-05 | 2017-04 | 2017-03 | 2017-02 | 2017-01 | 2016-12 |
|---|---|---|---|---|---|---|---|---|---|---|---|---|---|---|---|---|---|---|---|---|---|---|---|---|---|---|---|---|---|---|
| pm25 | 17 | 17 | 18 | 17 | 17 | 13 | 14 | 16 | 9.5 | 8.7 | 9.6 | 9.3 | 11 | 22 | 21 | 15 | 15 | 20 | 12 | 15 | 11 | 13 | 18 | 16 | 16 | 23 | 21 | 20 | 15 | 15 |
| no2:ppm | 0.02 | 0.02 | 0.02 | 0.02 | 0.02 | 0.02 | 0.01 | 0.01 | 0.01 | 0.01 | 0.01 | 0.02 | 0.02 | 0.02 | 0.02 | 0.02 | 0.02 | 0.02 | 0.02 | 0.02 | 0.02 | 0.01 | 0.02 | 0.03 | 0.04 | 0.04 | 0.05 | 0.04 | 0.04 | 0.04 |
| so2:ppm | 0 | 0 | 0 | 0 | 0 | 0 | 0 | 0 | 0 | 0 | 0 | 0 | 0 | 0 | 0 | 0 | 0 | 0 | 0 | 0 | 0 | 0 | 0 | 0 | 0 | 0 | 0 | 0 | 0 | 0 |
| co:ppm | 0.46 | 0.51 | 0.53 | 0.56 | 0.59 | 0.53 | 0.39 | 0.41 | 0.38 | 0.32 | 0.39 | 0.48 | 0.45 | 0.56 | 0.56 | 0.54 | 0.59 | 0.62 | 0.47 | 0.47 | 0.44 | 0.4 | 0.43 | 1.4 | 1.3 | 1.4 | 1.5 | 1.4 | 1.4 | 1.4 |
| pm10 | 29 | 30 | 31 | 28 | 27 | 23 | 28 | 31 | 20 | 18 | 21 | 26 | 32 | 37 | 38 | 30 | 32 | 43 | 27 | 32 | 29 | 34 | 42 | 51 | 52 | 64 | 61 | 56 | 51 | 55 |
| o3:ppm | 0.02 | 0.03 | 0.03 | 0.03 | 0.03 | 0.02 | 0.03 | 0.04 | 0.02 | 0.02 | 0.02 | 0.02 | 0.04 | 0.03 | 0.04 | 0.03 | 0.02 | 0.03 | 0.03 | 0.03 | 0.03 | 0.03 | 0.03 | - | - | - | - | - | - | - |