Polusi udara di Apenesfjellet: indeks kualitas udara real-time dan siaga asap.
Perkiraan kualitas polusi dan udara untuk Apenesfjellet. Hari ini Rabu, 24 Juni 2026. Nilai polusi udara berikut telah tercatat untuk Apenesfjellet:- partikulat Matter (PM 2.5) debu - 0 (Bagus)
- partikulat Matter (PM10) debu tersuspensi - 0 (Bagus)

Apa kualitas udara di Apenesfjellet hari ini? Apakah udara tercemar di Apenesfjellet?. Apakah ada Smog?
Apa tingkat saat PM 2,5 in Apenesfjellet? (partikulat Matter (PM 2.5) debu)
Hari ini PM 2.5 tingkat:
0 (Bagus)
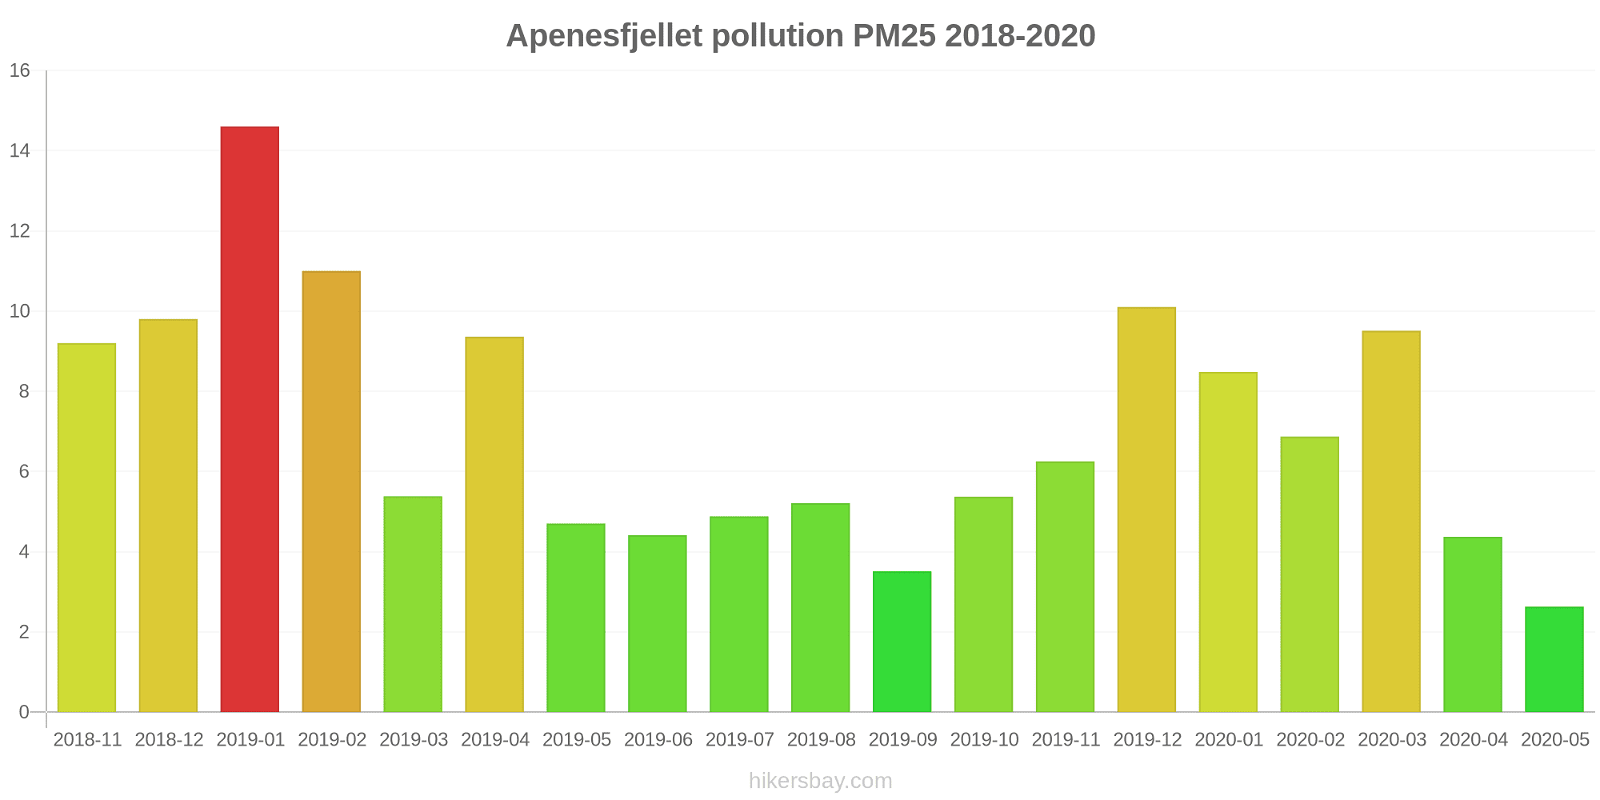
Nilai tertinggi PM 2.5 direkam: 15 (Januari 2019).
Tingkat terendah dari partikulat Matter PM 2.5 polusi terjadi di bulan: Mei (2.6).
Apa tingkat PM10 hari ini di Apenesfjellet? (partikulat Matter (PM10) debu tersuspensi)
Level saat ini dari partikulat Matter PM10 di Apenesfjellet adalah:
0 (Bagus)
Nilai PM10 tertinggi biasanya terjadi di bulan: 19 (Desember 2016).
Nilai terendah dari partikulat PM10 pencemaran Apenesfjellet biasanya dicatat di: September (0.22).
Data saat ini Selasa, 3 Oktober 2023 05.00
PM2,5 0 (Bagus)
PM10 0 (Bagus)
Data tentang polusi udara dari beberapa hari terakhir di Apenesfjellet
index
2023-09-26
2023-09-27
2023-09-28
2023-09-29
2023-09-30
2023-10-01
2023-10-02
2023-10-03
pm25
0
Good
0
Good
0
Good
0
Good
0
Good
0
Good
0
Good
0
Good
pm10
0
Good
0
Good
0
Good
-
Good
-
Good
-
Good
-
Good
-
Good
data source »
Polusi udara di Apenesfjellet dari Desember 2016 ke Mei 2020
index
2020-05
2020-04
2020-03
2020-02
2020-01
2019-12
2019-11
2019-10
2019-09
2019-08
2019-07
2019-06
2019-05
2019-04
2019-03
2019-02
2019-01
2018-12
2018-11
2018-10
2018-09
2018-08
2018-07
2018-06
2018-05
2018-04
2018-03
2018-02
2018-01
2017-12
2017-11
2017-10
2017-09
2017-08
2017-07
2017-06
2017-05
2017-04
2017-03
2017-02
2017-01
2016-12
pm10
5.1 (Good)
8.6 (Good)
15 (Good)
13 (Good)
14 (Good)
13 (Good)
7.8 (Good)
8.2 (Good)
6.7 (Good)
9.2 (Good)
8 (Good)
7.5 (Good)
8.5 (Good)
17 (Good)
9.8 (Good)
16 (Good)
18 (Good)
12 (Good)
13 (Good)
2.3 (Good)
0.22 (Good)
3.3 (Good)
11 (Good)
9.1 (Good)
16 (Good)
12 (Good)
12 (Good)
14 (Good)
12 (Good)
15 (Good)
12 (Good)
11 (Good)
12 (Good)
11 (Good)
12 (Good)
12 (Good)
12 (Good)
12 (Good)
14 (Good)
15 (Good)
16 (Good)
19 (Good)
pm25
2.6 (Good)
4.4 (Good)
9.5 (Good)
6.9 (Good)
8.5 (Good)
10 (Good)
6.3 (Good)
5.4 (Good)
3.5 (Good)
5.2 (Good)
4.9 (Good)
4.4 (Good)
4.7 (Good)
9.4 (Good)
5.4 (Good)
11 (Good)
15 (Moderate)
9.8 (Good)
9.2 (Good)
- (Good)
- (Good)
- (Good)
- (Good)
- (Good)
- (Good)
- (Good)
- (Good)
- (Good)
- (Good)
- (Good)
- (Good)
- (Good)
- (Good)
- (Good)
- (Good)
- (Good)
- (Good)
- (Good)
- (Good)
- (Good)
- (Good)
- (Good)
no2
5.3 (Good)
10 (Good)
14 (Good)
17 (Good)
15 (Good)
20 (Good)
15 (Good)
10 (Good)
10 (Good)
- (Good)
- (Good)
1.7 (Good)
11 (Good)
11 (Good)
11 (Good)
17 (Good)
21 (Good)
- (Good)
11 (Good)
8.7 (Good)
5 (Good)
4.4 (Good)
4.3 (Good)
5.1 (Good)
14 (Good)
12 (Good)
15 (Good)
16 (Good)
17 (Good)
16 (Good)
13 (Good)
10 (Good)
7.8 (Good)
5.6 (Good)
4.4 (Good)
5.5 (Good)
8.1 (Good)
7.7 (Good)
11 (Good)
14 (Good)
18 (Good)
17 (Good)
data source »
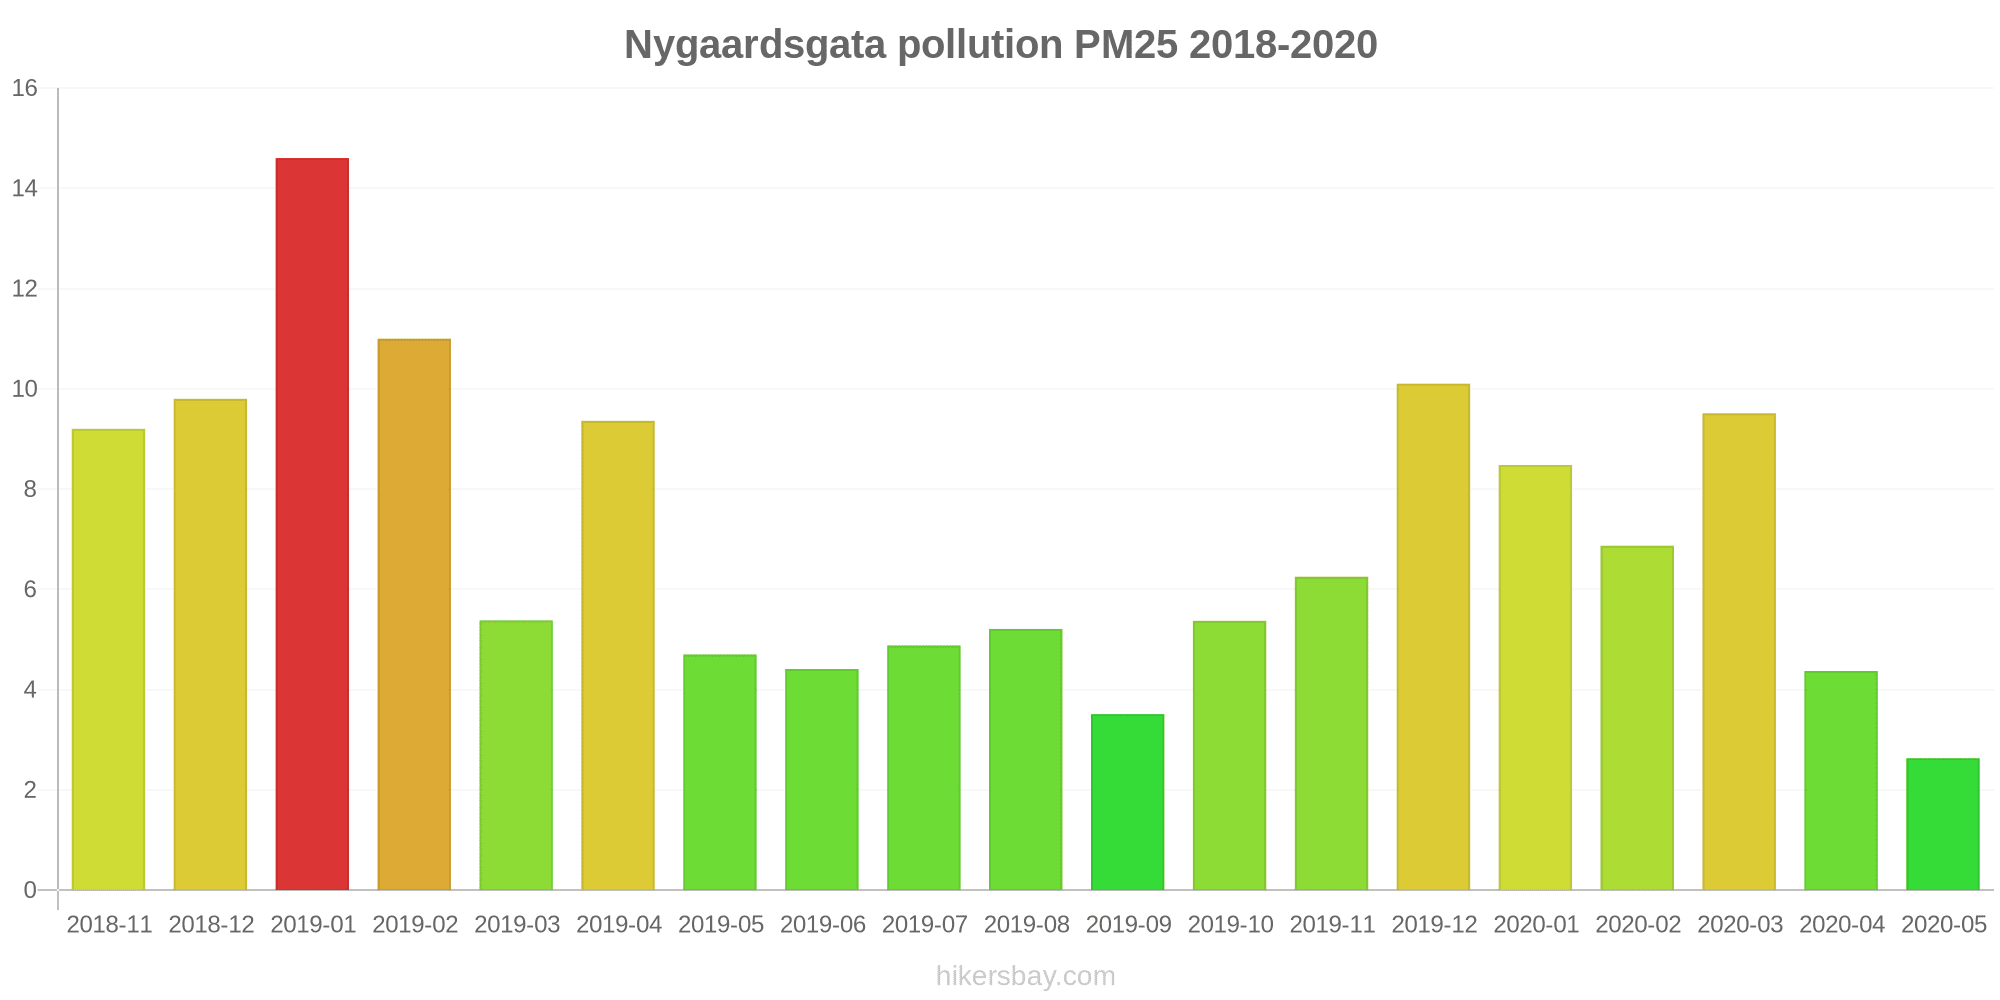
Nygaardsgata
Selasa, 3 Oktober 2023 05.00
PM2,5 0 (Bagus)
partikulat Matter (PM 2.5) debu
PM10 0 (Bagus)
partikulat Matter (PM10) debu tersuspensi
Nygaardsgata
index
2023-10-03
2023-10-02
2023-10-01
2023-09-30
2023-09-29
2023-09-28
2023-09-27
2023-09-26
pm25
0
0
0
0
0
0
0
0
pm10
-
-
-
-
-
0
0
0
Nygaardsgata
2016-12 2020-05

index
2020-05
2020-04
2020-03
2020-02
2020-01
2019-12
2019-11
2019-10
2019-09
2019-08
2019-07
2019-06
2019-05
2019-04
2019-03
2019-02
2019-01
2018-12
2018-11
2018-10
2018-09
2018-08
2018-07
2018-06
2018-05
2018-04
2018-03
2018-02
2018-01
2017-12
2017-11
2017-10
2017-09
2017-08
2017-07
2017-06
2017-05
2017-04
2017-03
2017-02
2017-01
2016-12
no2
5.3
10
14
17
15
20
15
10
10
-
-
1.7
11
11
11
17
21
-
11
8.7
5
4.4
4.3
5.1
14
12
15
16
17
16
13
10
7.8
5.6
4.4
5.5
8.1
7.7
11
14
18
17
pm10
5.1
8.6
15
13
14
13
7.8
8.2
6.7
9.2
8
7.5
8.5
17
9.8
16
18
12
13
2.3
0.22
3.3
11
9.1
16
12
12
14
12
15
12
11
12
11
12
12
12
12
14
15
16
19
pm25
2.6
4.4
9.5
6.9
8.5
10
6.3
5.4
3.5
5.2
4.9
4.4
4.7
9.4
5.4
11
15
9.8
9.2
-
-
-
-
-
-
-
-
-
-
-
-
-
-
-
-
-
-
-
-
-
-
-
* Pollution data source:
https://openaq.org
(Norway)
The data is licensed under CC-By 4.0
PM2,5 0 (Bagus)
PM10 0 (Bagus)
Data tentang polusi udara dari beberapa hari terakhir di Apenesfjellet
| index | 2023-09-26 | 2023-09-27 | 2023-09-28 | 2023-09-29 | 2023-09-30 | 2023-10-01 | 2023-10-02 | 2023-10-03 |
|---|---|---|---|---|---|---|---|---|
| pm25 | 0 Good |
0 Good |
0 Good |
0 Good |
0 Good |
0 Good |
0 Good |
0 Good |
| pm10 | 0 Good |
0 Good |
0 Good |
- Good |
- Good |
- Good |
- Good |
- Good |

| index | 2020-05 | 2020-04 | 2020-03 | 2020-02 | 2020-01 | 2019-12 | 2019-11 | 2019-10 | 2019-09 | 2019-08 | 2019-07 | 2019-06 | 2019-05 | 2019-04 | 2019-03 | 2019-02 | 2019-01 | 2018-12 | 2018-11 | 2018-10 | 2018-09 | 2018-08 | 2018-07 | 2018-06 | 2018-05 | 2018-04 | 2018-03 | 2018-02 | 2018-01 | 2017-12 | 2017-11 | 2017-10 | 2017-09 | 2017-08 | 2017-07 | 2017-06 | 2017-05 | 2017-04 | 2017-03 | 2017-02 | 2017-01 | 2016-12 |
|---|---|---|---|---|---|---|---|---|---|---|---|---|---|---|---|---|---|---|---|---|---|---|---|---|---|---|---|---|---|---|---|---|---|---|---|---|---|---|---|---|---|---|
| pm10 | 5.1 (Good) | 8.6 (Good) | 15 (Good) | 13 (Good) | 14 (Good) | 13 (Good) | 7.8 (Good) | 8.2 (Good) | 6.7 (Good) | 9.2 (Good) | 8 (Good) | 7.5 (Good) | 8.5 (Good) | 17 (Good) | 9.8 (Good) | 16 (Good) | 18 (Good) | 12 (Good) | 13 (Good) | 2.3 (Good) | 0.22 (Good) | 3.3 (Good) | 11 (Good) | 9.1 (Good) | 16 (Good) | 12 (Good) | 12 (Good) | 14 (Good) | 12 (Good) | 15 (Good) | 12 (Good) | 11 (Good) | 12 (Good) | 11 (Good) | 12 (Good) | 12 (Good) | 12 (Good) | 12 (Good) | 14 (Good) | 15 (Good) | 16 (Good) | 19 (Good) |
| pm25 | 2.6 (Good) | 4.4 (Good) | 9.5 (Good) | 6.9 (Good) | 8.5 (Good) | 10 (Good) | 6.3 (Good) | 5.4 (Good) | 3.5 (Good) | 5.2 (Good) | 4.9 (Good) | 4.4 (Good) | 4.7 (Good) | 9.4 (Good) | 5.4 (Good) | 11 (Good) | 15 (Moderate) | 9.8 (Good) | 9.2 (Good) | - (Good) | - (Good) | - (Good) | - (Good) | - (Good) | - (Good) | - (Good) | - (Good) | - (Good) | - (Good) | - (Good) | - (Good) | - (Good) | - (Good) | - (Good) | - (Good) | - (Good) | - (Good) | - (Good) | - (Good) | - (Good) | - (Good) | - (Good) |
| no2 | 5.3 (Good) | 10 (Good) | 14 (Good) | 17 (Good) | 15 (Good) | 20 (Good) | 15 (Good) | 10 (Good) | 10 (Good) | - (Good) | - (Good) | 1.7 (Good) | 11 (Good) | 11 (Good) | 11 (Good) | 17 (Good) | 21 (Good) | - (Good) | 11 (Good) | 8.7 (Good) | 5 (Good) | 4.4 (Good) | 4.3 (Good) | 5.1 (Good) | 14 (Good) | 12 (Good) | 15 (Good) | 16 (Good) | 17 (Good) | 16 (Good) | 13 (Good) | 10 (Good) | 7.8 (Good) | 5.6 (Good) | 4.4 (Good) | 5.5 (Good) | 8.1 (Good) | 7.7 (Good) | 11 (Good) | 14 (Good) | 18 (Good) | 17 (Good) |
PM2,5 0 (Bagus)
partikulat Matter (PM 2.5) debuPM10 0 (Bagus)
partikulat Matter (PM10) debu tersuspensiNygaardsgata
| index | 2023-10-03 | 2023-10-02 | 2023-10-01 | 2023-09-30 | 2023-09-29 | 2023-09-28 | 2023-09-27 | 2023-09-26 |
|---|---|---|---|---|---|---|---|---|
| pm25 | 0 | 0 | 0 | 0 | 0 | 0 | 0 | 0 |
| pm10 | - | - | - | - | - | 0 | 0 | 0 |
Nygaardsgata
| index | 2020-05 | 2020-04 | 2020-03 | 2020-02 | 2020-01 | 2019-12 | 2019-11 | 2019-10 | 2019-09 | 2019-08 | 2019-07 | 2019-06 | 2019-05 | 2019-04 | 2019-03 | 2019-02 | 2019-01 | 2018-12 | 2018-11 | 2018-10 | 2018-09 | 2018-08 | 2018-07 | 2018-06 | 2018-05 | 2018-04 | 2018-03 | 2018-02 | 2018-01 | 2017-12 | 2017-11 | 2017-10 | 2017-09 | 2017-08 | 2017-07 | 2017-06 | 2017-05 | 2017-04 | 2017-03 | 2017-02 | 2017-01 | 2016-12 |
|---|---|---|---|---|---|---|---|---|---|---|---|---|---|---|---|---|---|---|---|---|---|---|---|---|---|---|---|---|---|---|---|---|---|---|---|---|---|---|---|---|---|---|
| no2 | 5.3 | 10 | 14 | 17 | 15 | 20 | 15 | 10 | 10 | - | - | 1.7 | 11 | 11 | 11 | 17 | 21 | - | 11 | 8.7 | 5 | 4.4 | 4.3 | 5.1 | 14 | 12 | 15 | 16 | 17 | 16 | 13 | 10 | 7.8 | 5.6 | 4.4 | 5.5 | 8.1 | 7.7 | 11 | 14 | 18 | 17 |
| pm10 | 5.1 | 8.6 | 15 | 13 | 14 | 13 | 7.8 | 8.2 | 6.7 | 9.2 | 8 | 7.5 | 8.5 | 17 | 9.8 | 16 | 18 | 12 | 13 | 2.3 | 0.22 | 3.3 | 11 | 9.1 | 16 | 12 | 12 | 14 | 12 | 15 | 12 | 11 | 12 | 11 | 12 | 12 | 12 | 12 | 14 | 15 | 16 | 19 |
| pm25 | 2.6 | 4.4 | 9.5 | 6.9 | 8.5 | 10 | 6.3 | 5.4 | 3.5 | 5.2 | 4.9 | 4.4 | 4.7 | 9.4 | 5.4 | 11 | 15 | 9.8 | 9.2 | - | - | - | - | - | - | - | - | - | - | - | - | - | - | - | - | - | - | - | - | - | - | - |