Polusi udara di Hamar: indeks kualitas udara real-time dan siaga asap.
Perkiraan kualitas polusi dan udara untuk Hamar. Hari ini Selasa, 23 Juni 2026. Nilai polusi udara berikut telah tercatat untuk Hamar:- partikulat Matter (PM10) debu tersuspensi - 10 (Bagus)
- partikulat Matter (PM 2.5) debu - 3 (Bagus)
- nitrogen dioksida (NO2) - 13 (Bagus)

Apa kualitas udara di Hamar hari ini? Apakah udara tercemar di Hamar?. Apakah ada Smog?
Apa tingkat PM10 hari ini di Hamar? (partikulat Matter (PM10) debu tersuspensi)
Level saat ini dari partikulat Matter PM10 di Hamar adalah:
10 (Bagus)
Nilai PM10 tertinggi biasanya terjadi di bulan: 63 (Maret 2017).
Nilai terendah dari partikulat PM10 pencemaran Hamar biasanya dicatat di: Agustus (5.5).
Apa tingkat saat PM 2,5 in Hamar? (partikulat Matter (PM 2.5) debu)
Hari ini PM 2.5 tingkat:
3 (Bagus)
Sebagai perbandingan, tingkat tertinggi PM 2,5 in Hamar dalam 7 hari terakhir adalah: 6 (Kamis, 28 September 2023) dan Terendah: 0 (Minggu, 1 Oktober 2023).
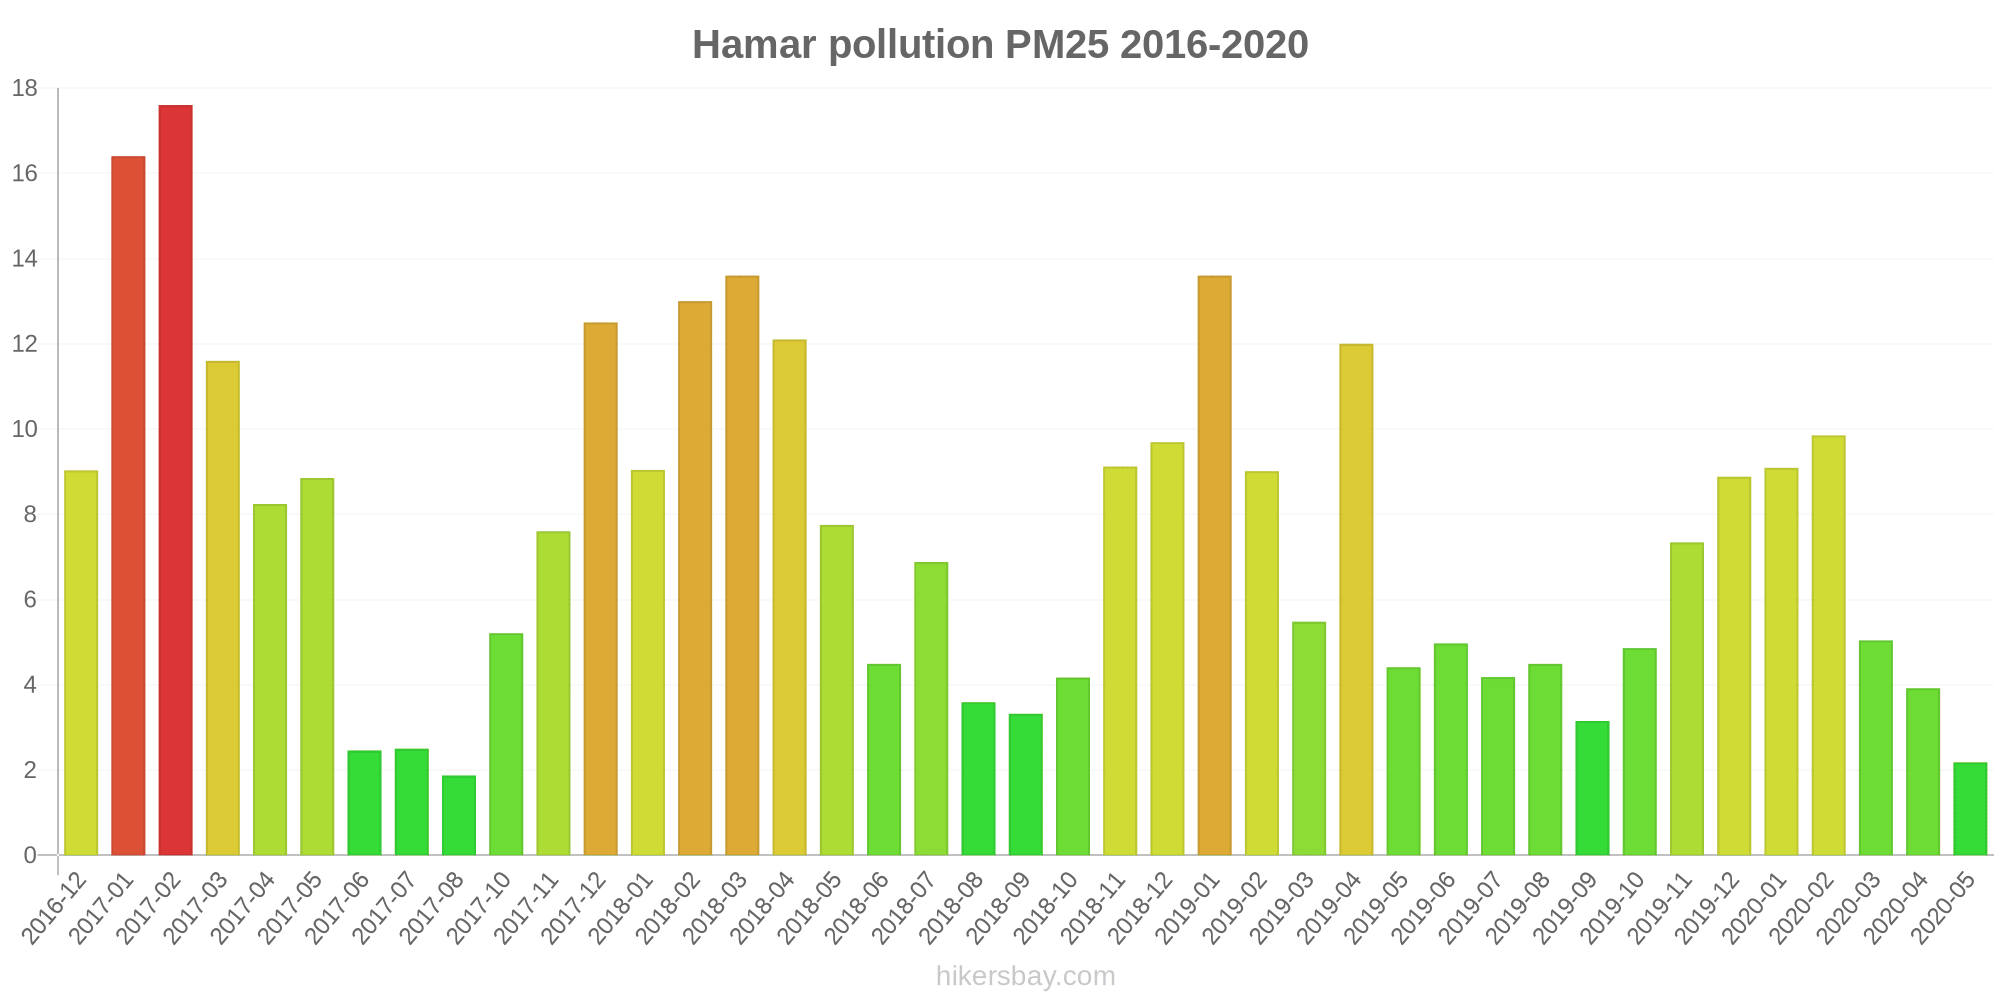
Nilai tertinggi PM 2.5 direkam: 18 (Februari 2017).
Tingkat terendah dari partikulat Matter PM 2.5 polusi terjadi di bulan: Agustus (1.9).
Seberapa tinggi tingkat NO2? (nitrogen dioksida (NO2))
13 (Bagus)
Data saat ini Selasa, 3 Oktober 2023 05.00
PM10 10 (Bagus)
PM2,5 3 (Bagus)
NO2 13 (Bagus)
Data tentang polusi udara dari beberapa hari terakhir di Hamar
index
2023-09-26
2023-09-27
2023-09-28
2023-09-29
2023-09-30
2023-10-01
2023-10-02
2023-10-03
no2
14
Good
11
Good
11
Good
12
Good
28
Good
25
Good
17
Good
8
Good
pm25
2
Good
5
Good
6
Good
3
Good
3
Good
0
Good
3
Good
2
Good
pm10
10
Good
10
Good
10
Good
8
Good
12
Good
4
Good
12
Good
7
Good
data source »
Polusi udara di Hamar dari Desember 2016 ke Mei 2020

index
2020-05
2020-04
2020-03
2020-02
2020-01
2019-12
2019-11
2019-10
2019-09
2019-08
2019-07
2019-06
2019-05
2019-04
2019-03
2019-02
2019-01
2018-12
2018-11
2018-10
2018-09
2018-08
2018-07
2018-06
2018-05
2018-04
2018-03
2018-02
2018-01
2017-12
2017-11
2017-10
2017-09
2017-08
2017-07
2017-06
2017-05
2017-04
2017-03
2017-02
2017-01
2016-12
pm10
11 (Good)
23 (Moderate)
18 (Good)
29 (Moderate)
16 (Good)
11 (Good)
13 (Good)
19 (Good)
13 (Good)
17 (Good)
9.6 (Good)
11 (Good)
16 (Good)
52 (Unhealthy for Sensitive Groups)
32 (Moderate)
15 (Good)
19 (Good)
17 (Good)
31 (Moderate)
20 (Good)
8.4 (Good)
10 (Good)
13 (Good)
17 (Good)
26 (Moderate)
59 (Unhealthy for Sensitive Groups)
35 (Moderate)
17 (Good)
15 (Good)
19 (Good)
22 (Moderate)
24 (Moderate)
- (Good)
5.5 (Good)
6.5 (Good)
8.5 (Good)
20 (Good)
29 (Moderate)
63 (Unhealthy for Sensitive Groups)
26 (Moderate)
18 (Good)
11 (Good)
pm25
2.2 (Good)
3.9 (Good)
5 (Good)
9.8 (Good)
9.1 (Good)
8.9 (Good)
7.3 (Good)
4.9 (Good)
3.1 (Good)
4.5 (Good)
4.2 (Good)
5 (Good)
4.4 (Good)
12 (Good)
5.5 (Good)
9 (Good)
14 (Moderate)
9.7 (Good)
9.1 (Good)
4.2 (Good)
3.3 (Good)
3.6 (Good)
6.9 (Good)
4.5 (Good)
7.8 (Good)
12 (Good)
14 (Moderate)
13 (Moderate)
9 (Good)
13 (Good)
7.6 (Good)
5.2 (Good)
- (Good)
1.9 (Good)
2.5 (Good)
2.5 (Good)
8.8 (Good)
8.2 (Good)
12 (Good)
18 (Moderate)
16 (Moderate)
9 (Good)
no2
8.8 (Good)
12 (Good)
15 (Good)
27 (Good)
119 (Unhealthy for Sensitive Groups)
23 (Good)
26 (Good)
21 (Good)
14 (Good)
11 (Good)
8.5 (Good)
10 (Good)
12 (Good)
21 (Good)
29 (Good)
43 (Moderate)
43 (Moderate)
30 (Good)
22 (Good)
20 (Good)
12 (Good)
18 (Good)
19 (Good)
20 (Good)
24 (Good)
37 (Good)
49 (Moderate)
40 (Moderate)
42 (Moderate)
51 (Moderate)
29 (Good)
24 (Good)
15 (Good)
11 (Good)
9.5 (Good)
11 (Good)
14 (Good)
15 (Good)
28 (Good)
35 (Good)
35 (Good)
33 (Good)
data source »
Kualitas hidup di Hamar
Hijau dan taman di kota
Hamar
75%
Denmark: 78%
Swedia: 84%
Kepulauan Åland: 75%
Kepulauan Faroe: 87%
Britania Raya: 75%
partikulat Matter PM 2.5
Hamar
7 (Good)
Kenikmatan menghabiskan waktu di kota
Hamar
100%
Denmark: 86%
Swedia: 88%
Kepulauan Åland: 92%
Kepulauan Faroe: 100%
Britania Raya: 70%
partikulat Matter PM10
Hamar
16 (Good)
Polusi udara
Hamar
5%
Denmark: 18%
Swedia: 15%
Kepulauan Åland: 17%
Kepulauan Faroe: 0%
Britania Raya: 37%
Pembuangan sampah
Hamar
100%
Denmark: 80%
Swedia: 83%
Kepulauan Åland: 88%
Kepulauan Faroe: 88%
Britania Raya: 60%
Ketersediaan dan kualitas air minum
Hamar
100%
Denmark: 87%
Swedia: 92%
Kepulauan Åland: 96%
Kepulauan Faroe: 98%
Britania Raya: 75%
Kebersihan dan kerasnya
Hamar
75%
Denmark: 75%
Swedia: 76%
Kepulauan Åland: 83%
Kepulauan Faroe: 94%
Britania Raya: 53%
Kebisingan dan polusi cahaya
Hamar
0%
Denmark: 32%
Swedia: 26%
Kepulauan Åland: 46%
Kepulauan Faroe: 21%
Britania Raya: 47%
Polusi air
Hamar
0%
Denmark: 19%
Swedia: 15%
Kepulauan Åland: 10%
Kepulauan Faroe: 7,7%
Britania Raya: 31%
Source: Numbeo
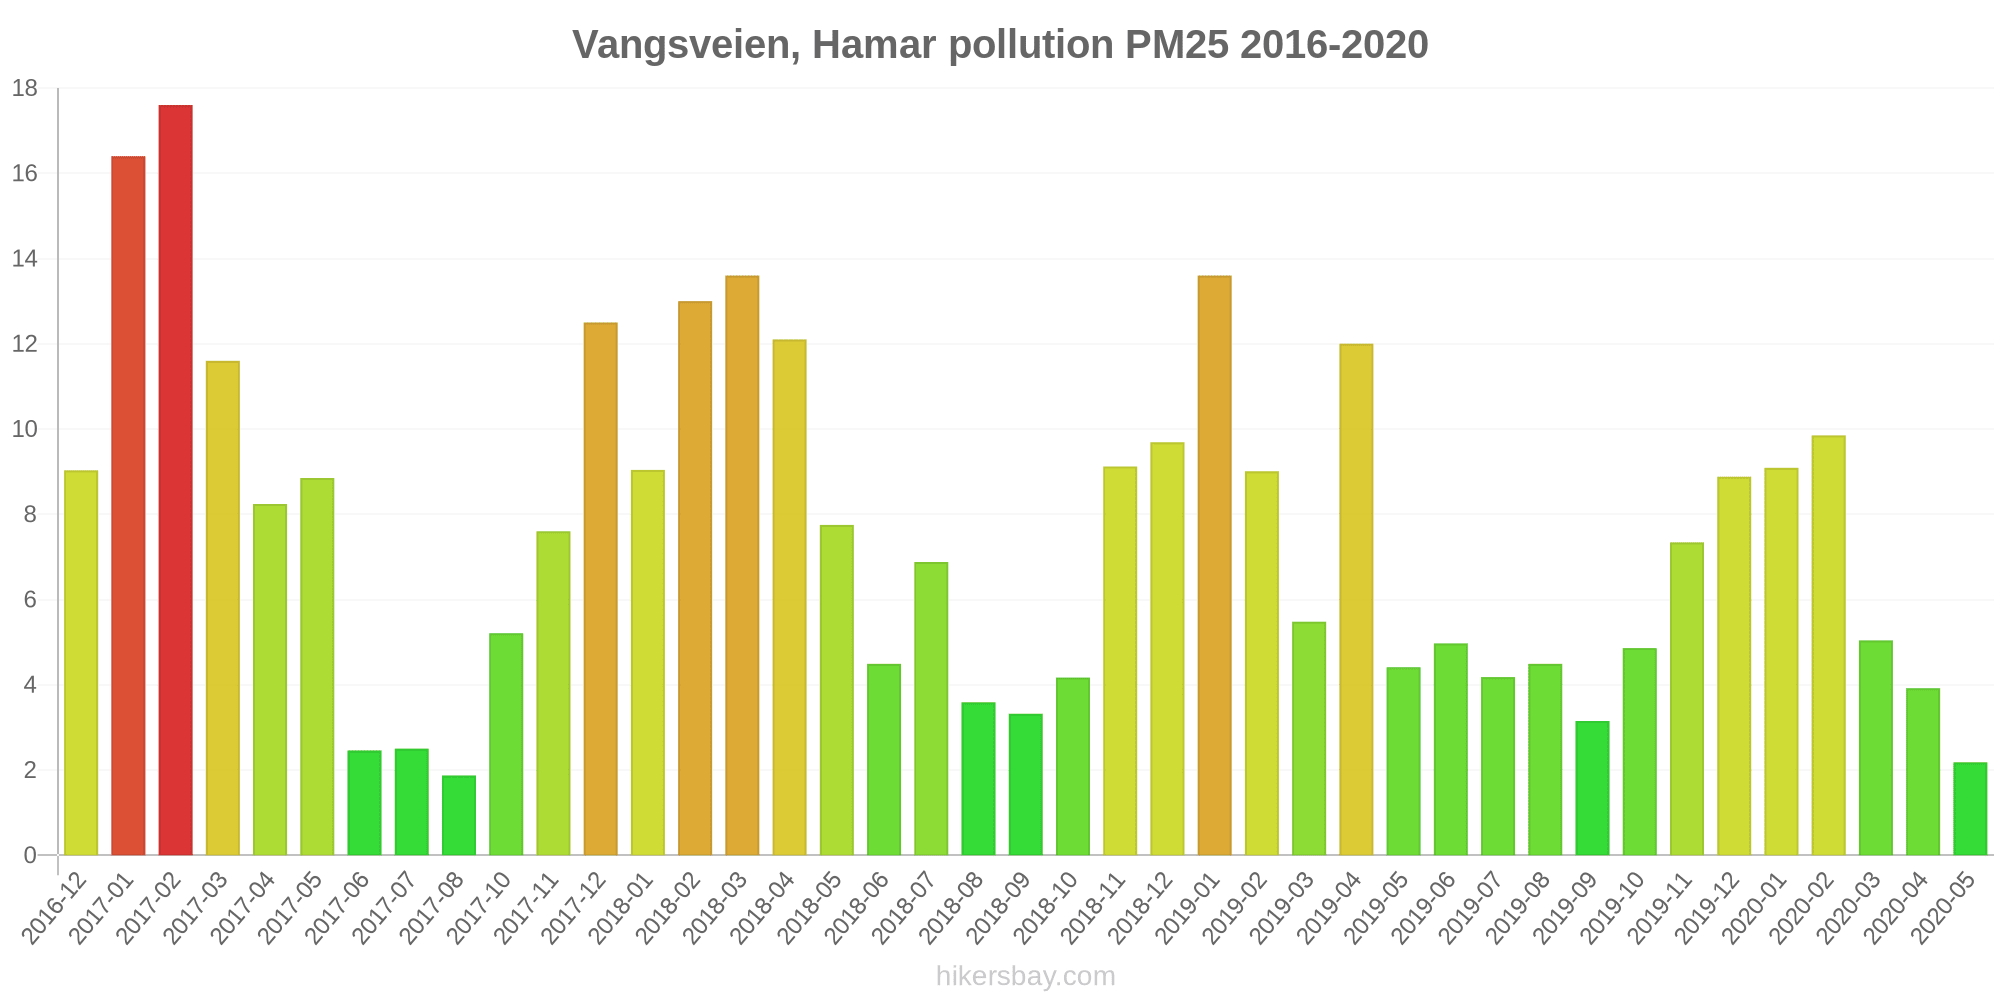
Vangsveien, Hamar
Selasa, 3 Oktober 2023 05.00
PM10 9.6 (Bagus)
partikulat Matter (PM10) debu tersuspensi
PM2,5 2.7 (Bagus)
partikulat Matter (PM 2.5) debu
NO2 13 (Bagus)
nitrogen dioksida (NO2)
Vangsveien, Hamar
index
2023-10-03
2023-10-02
2023-10-01
2023-09-30
2023-09-29
2023-09-28
2023-09-27
2023-09-26
no2
7.8
17
25
28
12
11
11
14
pm25
2
3.4
0.16
3.2
2.6
5.6
5.5
1.7
pm10
7.1
12
3.8
12
8.1
10
10
10
Vangsveien, Hamar
2016-12 2020-05

index
2020-05
2020-04
2020-03
2020-02
2020-01
2019-12
2019-11
2019-10
2019-09
2019-08
2019-07
2019-06
2019-05
2019-04
2019-03
2019-02
2019-01
2018-12
2018-11
2018-10
2018-09
2018-08
2018-07
2018-06
2018-05
2018-04
2018-03
2018-02
2018-01
2017-12
2017-11
2017-10
2017-09
2017-08
2017-07
2017-06
2017-05
2017-04
2017-03
2017-02
2017-01
2016-12
no2
8.8
12
15
27
119
23
26
21
14
11
8.5
10
12
21
29
43
43
30
22
20
12
18
19
20
24
37
49
40
42
51
29
24
15
11
9.5
11
14
15
28
35
35
33
pm10
11
23
18
29
16
11
13
19
13
17
9.6
11
16
52
32
15
19
17
31
20
8.4
10
13
17
26
59
35
17
15
19
22
24
-
5.5
6.5
8.5
20
29
63
26
18
11
pm25
2.2
3.9
5
9.8
9.1
8.9
7.3
4.9
3.1
4.5
4.2
5
4.4
12
5.5
9
14
9.7
9.1
4.2
3.3
3.6
6.9
4.5
7.8
12
14
13
9
13
7.6
5.2
-
1.9
2.5
2.5
8.8
8.2
12
18
16
9
* Pollution data source:
https://openaq.org
(Norway)
The data is licensed under CC-By 4.0
PM10 10 (Bagus)
PM2,5 3 (Bagus)
NO2 13 (Bagus)
Data tentang polusi udara dari beberapa hari terakhir di Hamar
| index | 2023-09-26 | 2023-09-27 | 2023-09-28 | 2023-09-29 | 2023-09-30 | 2023-10-01 | 2023-10-02 | 2023-10-03 |
|---|---|---|---|---|---|---|---|---|
| no2 | 14 Good |
11 Good |
11 Good |
12 Good |
28 Good |
25 Good |
17 Good |
8 Good |
| pm25 | 2 Good |
5 Good |
6 Good |
3 Good |
3 Good |
0 Good |
3 Good |
2 Good |
| pm10 | 10 Good |
10 Good |
10 Good |
8 Good |
12 Good |
4 Good |
12 Good |
7 Good |
| index | 2020-05 | 2020-04 | 2020-03 | 2020-02 | 2020-01 | 2019-12 | 2019-11 | 2019-10 | 2019-09 | 2019-08 | 2019-07 | 2019-06 | 2019-05 | 2019-04 | 2019-03 | 2019-02 | 2019-01 | 2018-12 | 2018-11 | 2018-10 | 2018-09 | 2018-08 | 2018-07 | 2018-06 | 2018-05 | 2018-04 | 2018-03 | 2018-02 | 2018-01 | 2017-12 | 2017-11 | 2017-10 | 2017-09 | 2017-08 | 2017-07 | 2017-06 | 2017-05 | 2017-04 | 2017-03 | 2017-02 | 2017-01 | 2016-12 |
|---|---|---|---|---|---|---|---|---|---|---|---|---|---|---|---|---|---|---|---|---|---|---|---|---|---|---|---|---|---|---|---|---|---|---|---|---|---|---|---|---|---|---|
| pm10 | 11 (Good) | 23 (Moderate) | 18 (Good) | 29 (Moderate) | 16 (Good) | 11 (Good) | 13 (Good) | 19 (Good) | 13 (Good) | 17 (Good) | 9.6 (Good) | 11 (Good) | 16 (Good) | 52 (Unhealthy for Sensitive Groups) | 32 (Moderate) | 15 (Good) | 19 (Good) | 17 (Good) | 31 (Moderate) | 20 (Good) | 8.4 (Good) | 10 (Good) | 13 (Good) | 17 (Good) | 26 (Moderate) | 59 (Unhealthy for Sensitive Groups) | 35 (Moderate) | 17 (Good) | 15 (Good) | 19 (Good) | 22 (Moderate) | 24 (Moderate) | - (Good) | 5.5 (Good) | 6.5 (Good) | 8.5 (Good) | 20 (Good) | 29 (Moderate) | 63 (Unhealthy for Sensitive Groups) | 26 (Moderate) | 18 (Good) | 11 (Good) |
| pm25 | 2.2 (Good) | 3.9 (Good) | 5 (Good) | 9.8 (Good) | 9.1 (Good) | 8.9 (Good) | 7.3 (Good) | 4.9 (Good) | 3.1 (Good) | 4.5 (Good) | 4.2 (Good) | 5 (Good) | 4.4 (Good) | 12 (Good) | 5.5 (Good) | 9 (Good) | 14 (Moderate) | 9.7 (Good) | 9.1 (Good) | 4.2 (Good) | 3.3 (Good) | 3.6 (Good) | 6.9 (Good) | 4.5 (Good) | 7.8 (Good) | 12 (Good) | 14 (Moderate) | 13 (Moderate) | 9 (Good) | 13 (Good) | 7.6 (Good) | 5.2 (Good) | - (Good) | 1.9 (Good) | 2.5 (Good) | 2.5 (Good) | 8.8 (Good) | 8.2 (Good) | 12 (Good) | 18 (Moderate) | 16 (Moderate) | 9 (Good) |
| no2 | 8.8 (Good) | 12 (Good) | 15 (Good) | 27 (Good) | 119 (Unhealthy for Sensitive Groups) | 23 (Good) | 26 (Good) | 21 (Good) | 14 (Good) | 11 (Good) | 8.5 (Good) | 10 (Good) | 12 (Good) | 21 (Good) | 29 (Good) | 43 (Moderate) | 43 (Moderate) | 30 (Good) | 22 (Good) | 20 (Good) | 12 (Good) | 18 (Good) | 19 (Good) | 20 (Good) | 24 (Good) | 37 (Good) | 49 (Moderate) | 40 (Moderate) | 42 (Moderate) | 51 (Moderate) | 29 (Good) | 24 (Good) | 15 (Good) | 11 (Good) | 9.5 (Good) | 11 (Good) | 14 (Good) | 15 (Good) | 28 (Good) | 35 (Good) | 35 (Good) | 33 (Good) |
Hijau dan taman di kota
Hamar 75%
Denmark: 78% Swedia: 84% Kepulauan Åland: 75% Kepulauan Faroe: 87% Britania Raya: 75%partikulat Matter PM 2.5
Hamar 7 (Good)
Kenikmatan menghabiskan waktu di kota
Hamar 100%
Denmark: 86% Swedia: 88% Kepulauan Åland: 92% Kepulauan Faroe: 100% Britania Raya: 70%partikulat Matter PM10
Hamar 16 (Good)
Polusi udara
Hamar 5%
Denmark: 18% Swedia: 15% Kepulauan Åland: 17% Kepulauan Faroe: 0% Britania Raya: 37%Pembuangan sampah
Hamar 100%
Denmark: 80% Swedia: 83% Kepulauan Åland: 88% Kepulauan Faroe: 88% Britania Raya: 60%Ketersediaan dan kualitas air minum
Hamar 100%
Denmark: 87% Swedia: 92% Kepulauan Åland: 96% Kepulauan Faroe: 98% Britania Raya: 75%Kebersihan dan kerasnya
Hamar 75%
Denmark: 75% Swedia: 76% Kepulauan Åland: 83% Kepulauan Faroe: 94% Britania Raya: 53%Kebisingan dan polusi cahaya
Hamar 0%
Denmark: 32% Swedia: 26% Kepulauan Åland: 46% Kepulauan Faroe: 21% Britania Raya: 47%Polusi air
Hamar 0%
Denmark: 19% Swedia: 15% Kepulauan Åland: 10% Kepulauan Faroe: 7,7% Britania Raya: 31%PM10 9.6 (Bagus)
partikulat Matter (PM10) debu tersuspensiPM2,5 2.7 (Bagus)
partikulat Matter (PM 2.5) debuNO2 13 (Bagus)
nitrogen dioksida (NO2)Vangsveien, Hamar
| index | 2023-10-03 | 2023-10-02 | 2023-10-01 | 2023-09-30 | 2023-09-29 | 2023-09-28 | 2023-09-27 | 2023-09-26 |
|---|---|---|---|---|---|---|---|---|
| no2 | 7.8 | 17 | 25 | 28 | 12 | 11 | 11 | 14 |
| pm25 | 2 | 3.4 | 0.16 | 3.2 | 2.6 | 5.6 | 5.5 | 1.7 |
| pm10 | 7.1 | 12 | 3.8 | 12 | 8.1 | 10 | 10 | 10 |
Vangsveien, Hamar
| index | 2020-05 | 2020-04 | 2020-03 | 2020-02 | 2020-01 | 2019-12 | 2019-11 | 2019-10 | 2019-09 | 2019-08 | 2019-07 | 2019-06 | 2019-05 | 2019-04 | 2019-03 | 2019-02 | 2019-01 | 2018-12 | 2018-11 | 2018-10 | 2018-09 | 2018-08 | 2018-07 | 2018-06 | 2018-05 | 2018-04 | 2018-03 | 2018-02 | 2018-01 | 2017-12 | 2017-11 | 2017-10 | 2017-09 | 2017-08 | 2017-07 | 2017-06 | 2017-05 | 2017-04 | 2017-03 | 2017-02 | 2017-01 | 2016-12 |
|---|---|---|---|---|---|---|---|---|---|---|---|---|---|---|---|---|---|---|---|---|---|---|---|---|---|---|---|---|---|---|---|---|---|---|---|---|---|---|---|---|---|---|
| no2 | 8.8 | 12 | 15 | 27 | 119 | 23 | 26 | 21 | 14 | 11 | 8.5 | 10 | 12 | 21 | 29 | 43 | 43 | 30 | 22 | 20 | 12 | 18 | 19 | 20 | 24 | 37 | 49 | 40 | 42 | 51 | 29 | 24 | 15 | 11 | 9.5 | 11 | 14 | 15 | 28 | 35 | 35 | 33 |
| pm10 | 11 | 23 | 18 | 29 | 16 | 11 | 13 | 19 | 13 | 17 | 9.6 | 11 | 16 | 52 | 32 | 15 | 19 | 17 | 31 | 20 | 8.4 | 10 | 13 | 17 | 26 | 59 | 35 | 17 | 15 | 19 | 22 | 24 | - | 5.5 | 6.5 | 8.5 | 20 | 29 | 63 | 26 | 18 | 11 |
| pm25 | 2.2 | 3.9 | 5 | 9.8 | 9.1 | 8.9 | 7.3 | 4.9 | 3.1 | 4.5 | 4.2 | 5 | 4.4 | 12 | 5.5 | 9 | 14 | 9.7 | 9.1 | 4.2 | 3.3 | 3.6 | 6.9 | 4.5 | 7.8 | 12 | 14 | 13 | 9 | 13 | 7.6 | 5.2 | - | 1.9 | 2.5 | 2.5 | 8.8 | 8.2 | 12 | 18 | 16 | 9 |