Polusi udara di Tromsø: indeks kualitas udara real-time dan siaga asap.
Perkiraan kualitas polusi dan udara untuk Tromsø. Hari ini Selasa, 23 Juni 2026. Nilai polusi udara berikut telah tercatat untuk Tromsø:- nitrogen dioksida (NO2) - 35 (Bagus)
- partikulat Matter (PM10) debu tersuspensi - 7 (Bagus)
- partikulat Matter (PM 2.5) debu - 8 (Bagus)

Apa kualitas udara di Tromsø hari ini? Apakah udara tercemar di Tromsø?. Apakah ada Smog?
Seberapa tinggi tingkat NO2? (nitrogen dioksida (NO2))
35 (Bagus)
Apa tingkat PM10 hari ini di Tromsø? (partikulat Matter (PM10) debu tersuspensi)
Level saat ini dari partikulat Matter PM10 di Tromsø adalah:
7 (Bagus)
Nilai PM10 tertinggi biasanya terjadi di bulan: 31 (April 2017).
Nilai terendah dari partikulat PM10 pencemaran Tromsø biasanya dicatat di: Desember (6.9).
Apa tingkat saat PM 2,5 in Tromsø? (partikulat Matter (PM 2.5) debu)
Hari ini PM 2.5 tingkat:
8 (Bagus)
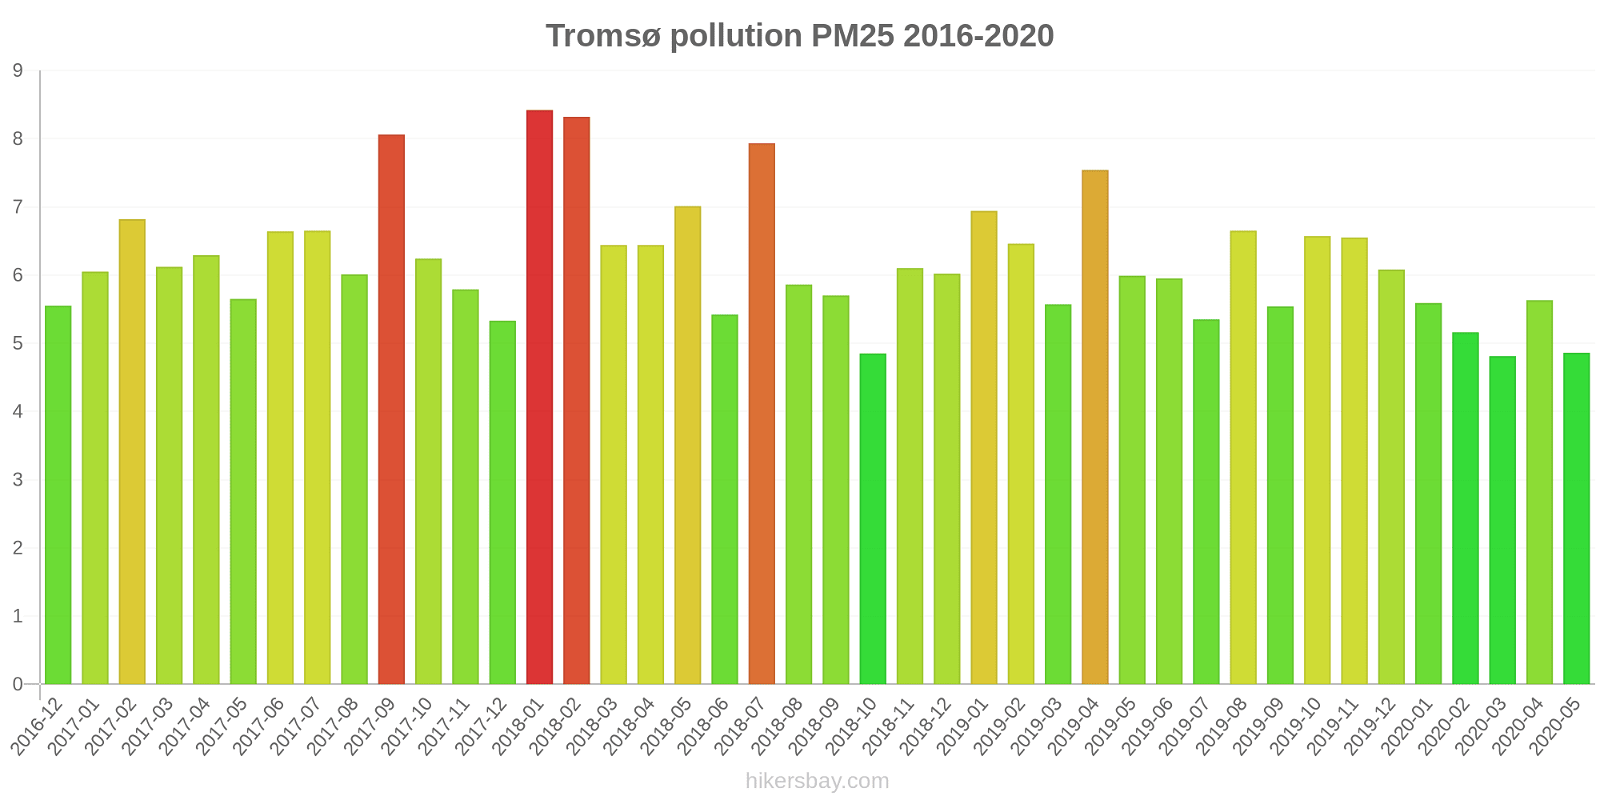
Sebagai perbandingan, tingkat tertinggi PM 2,5 in Tromsø dalam 7 hari terakhir adalah: 8 (Jumat, 12 April 2024) dan Terendah: 3 (Sabtu, 13 April 2024).
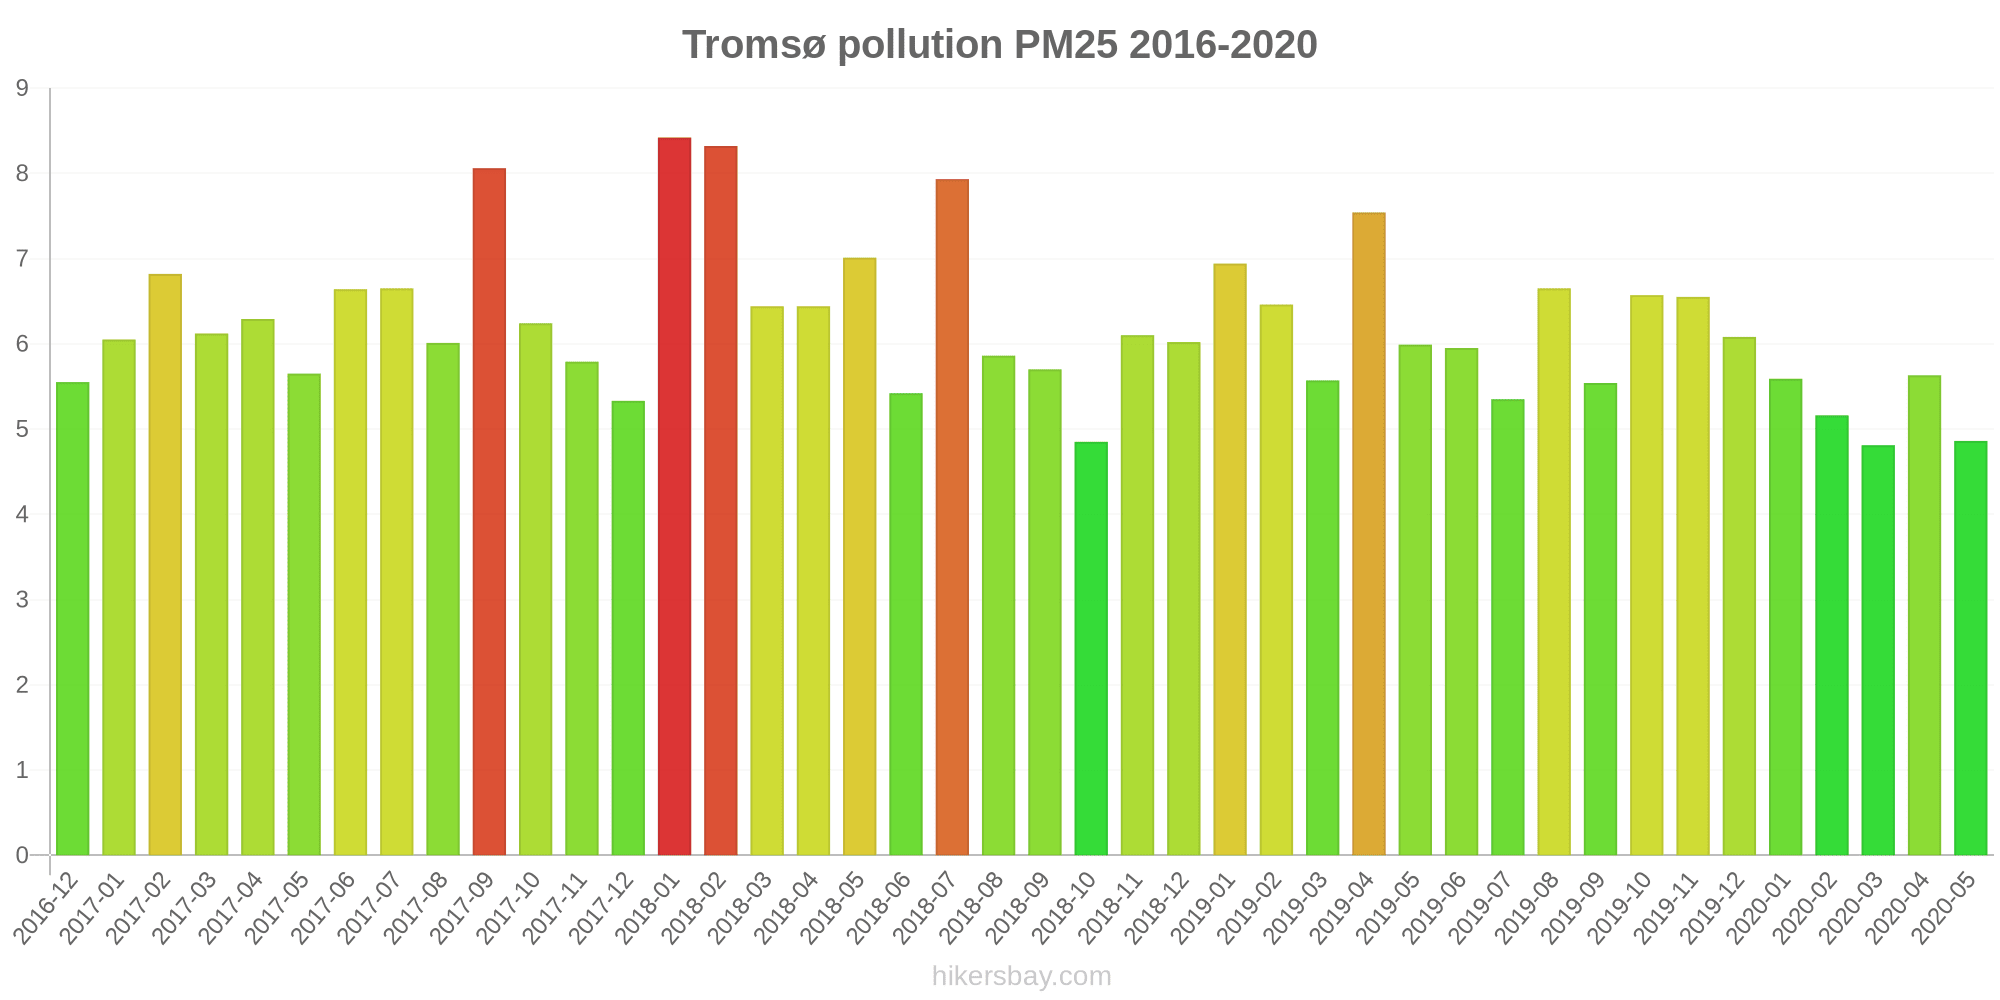
Nilai tertinggi PM 2.5 direkam: 8.4 (Januari 2018).
Tingkat terendah dari partikulat Matter PM 2.5 polusi terjadi di bulan: Maret (4.8).
Data saat ini Jumat, 12 April 2024 23.00
NO2 35 (Bagus)
PM10 7 (Bagus)
PM2,5 8 (Bagus)
Data tentang polusi udara dari beberapa hari terakhir di Tromsø
index
2024-04-08
2024-04-09
2024-04-10
2024-04-11
2024-04-12
2024-04-13
2024-04-14
2024-04-15
pm10
6
Good
4
Good
6
Good
8
Good
21
Moderate
4
Good
10
Good
9
Good
no2
22
Good
26
Good
49
Moderate
32
Good
15
Good
18
Good
10
Good
15
Good
pm25
4
Good
4
Good
4
Good
6
Good
8
Good
3
Good
6
Good
6
Good
data source »
Polusi udara di Tromsø dari Desember 2016 ke Mei 2020
index
2020-05
2020-04
2020-03
2020-02
2020-01
2019-12
2019-11
2019-10
2019-09
2019-08
2019-07
2019-06
2019-05
2019-04
2019-03
2019-02
2019-01
2018-12
2018-11
2018-10
2018-09
2018-08
2018-07
2018-06
2018-05
2018-04
2018-03
2018-02
2018-01
2017-12
2017-11
2017-10
2017-09
2017-08
2017-07
2017-06
2017-05
2017-04
2017-03
2017-02
2017-01
2016-12
pm10
20 (Good)
18 (Good)
8.8 (Good)
8.3 (Good)
9.7 (Good)
9.7 (Good)
8.7 (Good)
21 (Moderate)
13 (Good)
18 (Good)
16 (Good)
16 (Good)
23 (Moderate)
31 (Moderate)
9.6 (Good)
10 (Good)
12 (Good)
15 (Good)
12 (Good)
16 (Good)
13 (Good)
14 (Good)
19 (Good)
13 (Good)
29 (Moderate)
19 (Good)
9.6 (Good)
14 (Good)
14 (Good)
6.9 (Good)
14 (Good)
20 (Moderate)
23 (Moderate)
15 (Good)
14 (Good)
20 (Good)
22 (Moderate)
31 (Moderate)
10 (Good)
13 (Good)
11 (Good)
11 (Good)
pm25
4.9 (Good)
5.6 (Good)
4.8 (Good)
5.2 (Good)
5.6 (Good)
6.1 (Good)
6.5 (Good)
6.6 (Good)
5.5 (Good)
6.7 (Good)
5.3 (Good)
6 (Good)
6 (Good)
7.5 (Good)
5.6 (Good)
6.5 (Good)
6.9 (Good)
6 (Good)
6.1 (Good)
4.8 (Good)
5.7 (Good)
5.9 (Good)
7.9 (Good)
5.4 (Good)
7 (Good)
6.4 (Good)
6.4 (Good)
8.3 (Good)
8.4 (Good)
5.3 (Good)
5.8 (Good)
6.2 (Good)
8.1 (Good)
6 (Good)
6.7 (Good)
6.6 (Good)
5.7 (Good)
6.3 (Good)
6.1 (Good)
6.8 (Good)
6 (Good)
5.5 (Good)
no2
15 (Good)
18 (Good)
20 (Good)
31 (Good)
31 (Good)
34 (Good)
43 (Moderate)
36 (Good)
29 (Good)
50 (Moderate)
20 (Good)
23 (Good)
20 (Good)
29 (Good)
32 (Good)
38 (Good)
39 (Good)
34 (Good)
34 (Good)
26 (Good)
28 (Good)
25 (Good)
24 (Good)
20 (Good)
27 (Good)
38 (Good)
40 (Good)
39 (Good)
44 (Moderate)
35 (Good)
35 (Good)
34 (Good)
35 (Good)
27 (Good)
23 (Good)
18 (Good)
22 (Good)
29 (Good)
41 (Moderate)
48 (Moderate)
38 (Good)
31 (Good)
data source »
Kualitas hidup di Tromsø
Hijau dan taman di kota
Tromsø
75%
Denmark: 78%
Swedia: 84%
Kepulauan Åland: 75%
Kepulauan Faroe: 87%
Britania Raya: 75%
partikulat Matter PM 2.5
Tromsø
7 (Good)
Kenikmatan menghabiskan waktu di kota
Tromsø
96%
Denmark: 86%
Swedia: 88%
Kepulauan Åland: 92%
Kepulauan Faroe: 100%
Britania Raya: 70%
partikulat Matter PM10
Tromsø
20 (Moderate)
Polusi udara
Tromsø
15%
Denmark: 18%
Swedia: 15%
Kepulauan Åland: 17%
Kepulauan Faroe: 0%
Britania Raya: 37%
Pembuangan sampah
Tromsø
89%
Denmark: 80%
Swedia: 83%
Kepulauan Åland: 88%
Kepulauan Faroe: 88%
Britania Raya: 60%
Ketersediaan dan kualitas air minum
Tromsø
98%
Denmark: 87%
Swedia: 92%
Kepulauan Åland: 96%
Kepulauan Faroe: 98%
Britania Raya: 75%
Kebersihan dan kerasnya
Tromsø
75%
Denmark: 75%
Swedia: 76%
Kepulauan Åland: 83%
Kepulauan Faroe: 94%
Britania Raya: 53%
Kebisingan dan polusi cahaya
Tromsø
39%
Denmark: 32%
Swedia: 26%
Kepulauan Åland: 46%
Kepulauan Faroe: 21%
Britania Raya: 47%
Polusi air
Tromsø
18%
Denmark: 19%
Swedia: 15%
Kepulauan Åland: 10%
Kepulauan Faroe: 7,7%
Britania Raya: 31%
Source: Numbeo
Hansjordnesbukta
Senin, 15 April 2024 08.00
NO2 35 (Bagus)
nitrogen dioksida (NO2)
PM10 12 (Bagus)
partikulat Matter (PM10) debu tersuspensi
PM2,5 8.2 (Bagus)
partikulat Matter (PM 2.5) debu
Rambergan
Jumat, 12 April 2024 23.00
PM10 2.4 (Bagus)
partikulat Matter (PM10) debu tersuspensi
Hansjordnesbukta
index
2024-04-15
2024-04-14
2024-04-13
2024-04-12
2024-04-11
2024-04-10
2024-04-09
2024-04-08
pm10
9.2
9.7
4
30
9.5
7.6
5.2
6.4
no2
15
10
18
15
32
49
26
22
pm25
6.4
5.9
3.3
8
6.3
4.3
4
4.3
Rambergan
index
2024-04-12
2024-04-11
2024-04-10
2024-04-09
2024-04-08
pm10
13
7.3
5.2
3.5
4.7
Hansjordnesbukta
2016-12 2020-05

index
2020-05
2020-04
2020-03
2020-02
2020-01
2019-12
2019-11
2019-10
2019-09
2019-08
2019-07
2019-06
2019-05
2019-04
2019-03
2019-02
2019-01
2018-12
2018-11
2018-10
2018-09
2018-08
2018-07
2018-06
2018-05
2018-04
2018-03
2018-02
2018-01
2017-12
2017-11
2017-10
2017-09
2017-08
2017-07
2017-06
2017-05
2017-04
2017-03
2017-02
2017-01
2016-12
pm25
4.9
5.6
4.8
5.2
5.6
6.1
6.5
6.6
5.5
6.7
5.3
6
6
7.5
5.6
6.5
6.9
6
6.1
4.8
5.7
5.9
7.9
5.4
7
6.4
6.4
8.3
8.4
5.3
5.8
6.2
8.1
6
6.7
6.6
5.7
6.3
6.1
6.8
6
5.5
pm10
26
22
9.7
9.4
11
11
10
30
17
21
18
19
29
38
11
12
16
19
14
22
15
17
22
16
36
24
11
18
16
9.6
15
23
30
19
17
25
26
37
11
13
12
13
no2
15
18
20
31
31
34
43
36
29
50
20
23
20
29
32
38
39
34
34
26
28
25
24
20
27
38
40
39
44
35
35
34
35
27
23
18
22
29
41
48
38
31
Rambergan
index
2020-05
2020-04
2020-03
2020-02
2020-01
2019-12
2019-11
2019-10
2019-09
2019-08
2019-07
2019-06
2019-05
2019-04
2019-03
2019-02
2019-01
2018-12
2018-11
2018-10
2018-09
2018-08
2018-07
2018-06
2018-05
2018-04
2018-03
2018-02
2018-01
2017-12
pm10
13
14
7.8
7.1
8.5
7.9
7.3
13
9.6
15
14
14
17
23
8.4
8.8
8.8
12
8.8
9.7
9.8
11
16
9.4
22
14
8
11
11
4.5
Tverrforbindelsen
index
2017-12
2017-11
2017-10
2017-09
2017-08
2017-07
2017-06
2017-05
2017-04
2017-03
2017-01
2016-12
pm10
6.6
13
18
17
10
10
14
17
26
8.9
10
9.3
* Pollution data source:
https://openaq.org
(Norway)
The data is licensed under CC-By 4.0
NO2 35 (Bagus)
PM10 7 (Bagus)
PM2,5 8 (Bagus)
Data tentang polusi udara dari beberapa hari terakhir di Tromsø
| index | 2024-04-08 | 2024-04-09 | 2024-04-10 | 2024-04-11 | 2024-04-12 | 2024-04-13 | 2024-04-14 | 2024-04-15 |
|---|---|---|---|---|---|---|---|---|
| pm10 | 6 Good |
4 Good |
6 Good |
8 Good |
21 Moderate |
4 Good |
10 Good |
9 Good |
| no2 | 22 Good |
26 Good |
49 Moderate |
32 Good |
15 Good |
18 Good |
10 Good |
15 Good |
| pm25 | 4 Good |
4 Good |
4 Good |
6 Good |
8 Good |
3 Good |
6 Good |
6 Good |
| index | 2020-05 | 2020-04 | 2020-03 | 2020-02 | 2020-01 | 2019-12 | 2019-11 | 2019-10 | 2019-09 | 2019-08 | 2019-07 | 2019-06 | 2019-05 | 2019-04 | 2019-03 | 2019-02 | 2019-01 | 2018-12 | 2018-11 | 2018-10 | 2018-09 | 2018-08 | 2018-07 | 2018-06 | 2018-05 | 2018-04 | 2018-03 | 2018-02 | 2018-01 | 2017-12 | 2017-11 | 2017-10 | 2017-09 | 2017-08 | 2017-07 | 2017-06 | 2017-05 | 2017-04 | 2017-03 | 2017-02 | 2017-01 | 2016-12 |
|---|---|---|---|---|---|---|---|---|---|---|---|---|---|---|---|---|---|---|---|---|---|---|---|---|---|---|---|---|---|---|---|---|---|---|---|---|---|---|---|---|---|---|
| pm10 | 20 (Good) | 18 (Good) | 8.8 (Good) | 8.3 (Good) | 9.7 (Good) | 9.7 (Good) | 8.7 (Good) | 21 (Moderate) | 13 (Good) | 18 (Good) | 16 (Good) | 16 (Good) | 23 (Moderate) | 31 (Moderate) | 9.6 (Good) | 10 (Good) | 12 (Good) | 15 (Good) | 12 (Good) | 16 (Good) | 13 (Good) | 14 (Good) | 19 (Good) | 13 (Good) | 29 (Moderate) | 19 (Good) | 9.6 (Good) | 14 (Good) | 14 (Good) | 6.9 (Good) | 14 (Good) | 20 (Moderate) | 23 (Moderate) | 15 (Good) | 14 (Good) | 20 (Good) | 22 (Moderate) | 31 (Moderate) | 10 (Good) | 13 (Good) | 11 (Good) | 11 (Good) |
| pm25 | 4.9 (Good) | 5.6 (Good) | 4.8 (Good) | 5.2 (Good) | 5.6 (Good) | 6.1 (Good) | 6.5 (Good) | 6.6 (Good) | 5.5 (Good) | 6.7 (Good) | 5.3 (Good) | 6 (Good) | 6 (Good) | 7.5 (Good) | 5.6 (Good) | 6.5 (Good) | 6.9 (Good) | 6 (Good) | 6.1 (Good) | 4.8 (Good) | 5.7 (Good) | 5.9 (Good) | 7.9 (Good) | 5.4 (Good) | 7 (Good) | 6.4 (Good) | 6.4 (Good) | 8.3 (Good) | 8.4 (Good) | 5.3 (Good) | 5.8 (Good) | 6.2 (Good) | 8.1 (Good) | 6 (Good) | 6.7 (Good) | 6.6 (Good) | 5.7 (Good) | 6.3 (Good) | 6.1 (Good) | 6.8 (Good) | 6 (Good) | 5.5 (Good) |
| no2 | 15 (Good) | 18 (Good) | 20 (Good) | 31 (Good) | 31 (Good) | 34 (Good) | 43 (Moderate) | 36 (Good) | 29 (Good) | 50 (Moderate) | 20 (Good) | 23 (Good) | 20 (Good) | 29 (Good) | 32 (Good) | 38 (Good) | 39 (Good) | 34 (Good) | 34 (Good) | 26 (Good) | 28 (Good) | 25 (Good) | 24 (Good) | 20 (Good) | 27 (Good) | 38 (Good) | 40 (Good) | 39 (Good) | 44 (Moderate) | 35 (Good) | 35 (Good) | 34 (Good) | 35 (Good) | 27 (Good) | 23 (Good) | 18 (Good) | 22 (Good) | 29 (Good) | 41 (Moderate) | 48 (Moderate) | 38 (Good) | 31 (Good) |
Hijau dan taman di kota
Tromsø 75%
Denmark: 78% Swedia: 84% Kepulauan Åland: 75% Kepulauan Faroe: 87% Britania Raya: 75%partikulat Matter PM 2.5
Tromsø 7 (Good)
Kenikmatan menghabiskan waktu di kota
Tromsø 96%
Denmark: 86% Swedia: 88% Kepulauan Åland: 92% Kepulauan Faroe: 100% Britania Raya: 70%partikulat Matter PM10
Tromsø 20 (Moderate)
Polusi udara
Tromsø 15%
Denmark: 18% Swedia: 15% Kepulauan Åland: 17% Kepulauan Faroe: 0% Britania Raya: 37%Pembuangan sampah
Tromsø 89%
Denmark: 80% Swedia: 83% Kepulauan Åland: 88% Kepulauan Faroe: 88% Britania Raya: 60%Ketersediaan dan kualitas air minum
Tromsø 98%
Denmark: 87% Swedia: 92% Kepulauan Åland: 96% Kepulauan Faroe: 98% Britania Raya: 75%Kebersihan dan kerasnya
Tromsø 75%
Denmark: 75% Swedia: 76% Kepulauan Åland: 83% Kepulauan Faroe: 94% Britania Raya: 53%Kebisingan dan polusi cahaya
Tromsø 39%
Denmark: 32% Swedia: 26% Kepulauan Åland: 46% Kepulauan Faroe: 21% Britania Raya: 47%Polusi air
Tromsø 18%
Denmark: 19% Swedia: 15% Kepulauan Åland: 10% Kepulauan Faroe: 7,7% Britania Raya: 31%NO2 35 (Bagus)
nitrogen dioksida (NO2)PM10 12 (Bagus)
partikulat Matter (PM10) debu tersuspensiPM2,5 8.2 (Bagus)
partikulat Matter (PM 2.5) debuPM10 2.4 (Bagus)
partikulat Matter (PM10) debu tersuspensiHansjordnesbukta
| index | 2024-04-15 | 2024-04-14 | 2024-04-13 | 2024-04-12 | 2024-04-11 | 2024-04-10 | 2024-04-09 | 2024-04-08 |
|---|---|---|---|---|---|---|---|---|
| pm10 | 9.2 | 9.7 | 4 | 30 | 9.5 | 7.6 | 5.2 | 6.4 |
| no2 | 15 | 10 | 18 | 15 | 32 | 49 | 26 | 22 |
| pm25 | 6.4 | 5.9 | 3.3 | 8 | 6.3 | 4.3 | 4 | 4.3 |
Rambergan
| index | 2024-04-12 | 2024-04-11 | 2024-04-10 | 2024-04-09 | 2024-04-08 |
|---|---|---|---|---|---|
| pm10 | 13 | 7.3 | 5.2 | 3.5 | 4.7 |
Hansjordnesbukta

| index | 2020-05 | 2020-04 | 2020-03 | 2020-02 | 2020-01 | 2019-12 | 2019-11 | 2019-10 | 2019-09 | 2019-08 | 2019-07 | 2019-06 | 2019-05 | 2019-04 | 2019-03 | 2019-02 | 2019-01 | 2018-12 | 2018-11 | 2018-10 | 2018-09 | 2018-08 | 2018-07 | 2018-06 | 2018-05 | 2018-04 | 2018-03 | 2018-02 | 2018-01 | 2017-12 | 2017-11 | 2017-10 | 2017-09 | 2017-08 | 2017-07 | 2017-06 | 2017-05 | 2017-04 | 2017-03 | 2017-02 | 2017-01 | 2016-12 |
|---|---|---|---|---|---|---|---|---|---|---|---|---|---|---|---|---|---|---|---|---|---|---|---|---|---|---|---|---|---|---|---|---|---|---|---|---|---|---|---|---|---|---|
| pm25 | 4.9 | 5.6 | 4.8 | 5.2 | 5.6 | 6.1 | 6.5 | 6.6 | 5.5 | 6.7 | 5.3 | 6 | 6 | 7.5 | 5.6 | 6.5 | 6.9 | 6 | 6.1 | 4.8 | 5.7 | 5.9 | 7.9 | 5.4 | 7 | 6.4 | 6.4 | 8.3 | 8.4 | 5.3 | 5.8 | 6.2 | 8.1 | 6 | 6.7 | 6.6 | 5.7 | 6.3 | 6.1 | 6.8 | 6 | 5.5 |
| pm10 | 26 | 22 | 9.7 | 9.4 | 11 | 11 | 10 | 30 | 17 | 21 | 18 | 19 | 29 | 38 | 11 | 12 | 16 | 19 | 14 | 22 | 15 | 17 | 22 | 16 | 36 | 24 | 11 | 18 | 16 | 9.6 | 15 | 23 | 30 | 19 | 17 | 25 | 26 | 37 | 11 | 13 | 12 | 13 |
| no2 | 15 | 18 | 20 | 31 | 31 | 34 | 43 | 36 | 29 | 50 | 20 | 23 | 20 | 29 | 32 | 38 | 39 | 34 | 34 | 26 | 28 | 25 | 24 | 20 | 27 | 38 | 40 | 39 | 44 | 35 | 35 | 34 | 35 | 27 | 23 | 18 | 22 | 29 | 41 | 48 | 38 | 31 |
Rambergan
| index | 2020-05 | 2020-04 | 2020-03 | 2020-02 | 2020-01 | 2019-12 | 2019-11 | 2019-10 | 2019-09 | 2019-08 | 2019-07 | 2019-06 | 2019-05 | 2019-04 | 2019-03 | 2019-02 | 2019-01 | 2018-12 | 2018-11 | 2018-10 | 2018-09 | 2018-08 | 2018-07 | 2018-06 | 2018-05 | 2018-04 | 2018-03 | 2018-02 | 2018-01 | 2017-12 |
|---|---|---|---|---|---|---|---|---|---|---|---|---|---|---|---|---|---|---|---|---|---|---|---|---|---|---|---|---|---|---|
| pm10 | 13 | 14 | 7.8 | 7.1 | 8.5 | 7.9 | 7.3 | 13 | 9.6 | 15 | 14 | 14 | 17 | 23 | 8.4 | 8.8 | 8.8 | 12 | 8.8 | 9.7 | 9.8 | 11 | 16 | 9.4 | 22 | 14 | 8 | 11 | 11 | 4.5 |
Tverrforbindelsen
| index | 2017-12 | 2017-11 | 2017-10 | 2017-09 | 2017-08 | 2017-07 | 2017-06 | 2017-05 | 2017-04 | 2017-03 | 2017-01 | 2016-12 |
|---|---|---|---|---|---|---|---|---|---|---|---|---|
| pm10 | 6.6 | 13 | 18 | 17 | 10 | 10 | 14 | 17 | 26 | 8.9 | 10 | 9.3 |