Polusi udara di Šiauliai: indeks kualitas udara real-time dan siaga asap.
Perkiraan kualitas polusi dan udara untuk Šiauliai. Hari ini Rabu, 24 Juni 2026. Nilai polusi udara berikut telah tercatat untuk Šiauliai:- sulfur dioksida (SO2) - 8 (Bagus)
- partikulat Matter (PM 2.5) debu - 6 (Bagus)
- partikulat Matter (PM10) debu tersuspensi - 6 (Bagus)
- karbon monoksida (CO) - 268 (Bagus)
- nitrogen dioksida (NO2) - 19 (Bagus)
- ozon (O3) - 52 (Bagus)

Apa kualitas udara di Šiauliai hari ini? Apakah udara tercemar di Šiauliai?. Apakah ada Smog?
Apa tingkat polusi SO2? (sulfur dioksida (SO2))
8 (Bagus)
Apa tingkat saat PM 2,5 in Šiauliai? (partikulat Matter (PM 2.5) debu)
Hari ini PM 2.5 tingkat:
6 (Bagus)
Sebagai perbandingan, tingkat tertinggi PM 2,5 in Šiauliai dalam 7 hari terakhir adalah: 10 (Minggu, 14 Januari 2024) dan Terendah: 4 (Rabu, 10 Januari 2024).
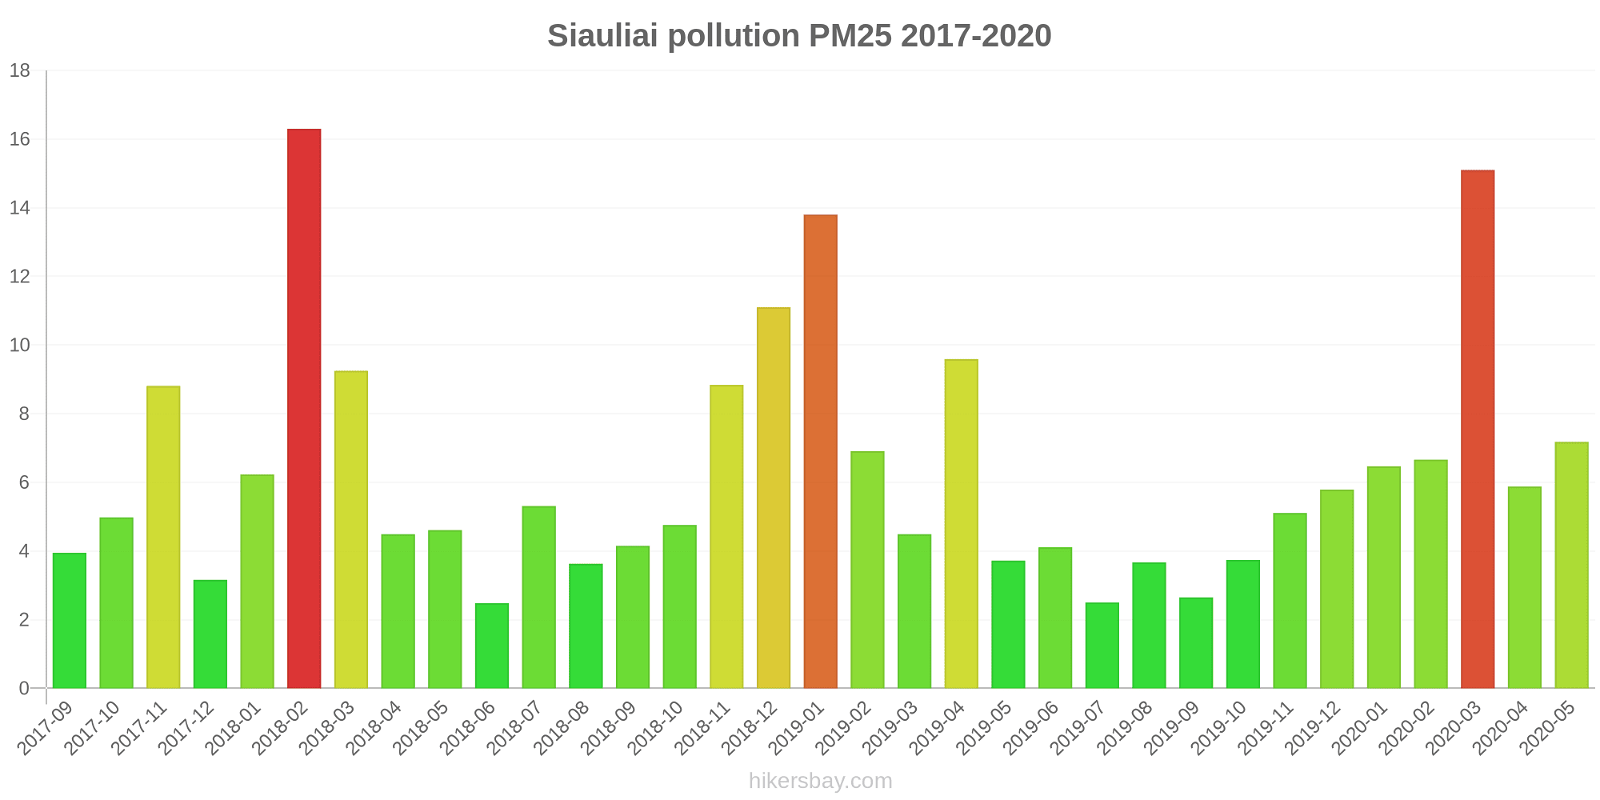
Nilai tertinggi PM 2.5 direkam: 16 (Februari 2018).
Tingkat terendah dari partikulat Matter PM 2.5 polusi terjadi di bulan: Juni (2.5).
Apa tingkat PM10 hari ini di Šiauliai? (partikulat Matter (PM10) debu tersuspensi)
Level saat ini dari partikulat Matter PM10 di Šiauliai adalah:
6 (Bagus)
Nilai PM10 tertinggi biasanya terjadi di bulan: 22 (Maret 2020).
Nilai terendah dari partikulat PM10 pencemaran Šiauliai biasanya dicatat di: September (4.3).
Seberapa tinggi tingkat CO? (karbon monoksida (CO))
268 (Bagus)
Seberapa tinggi tingkat NO2? (nitrogen dioksida (NO2))
19 (Bagus)
Bagaimana tingkat O3 hari ini di Šiauliai? (ozon (O3))
52 (Bagus)
Data saat ini Rabu, 17 Januari 2024 04.00
SO2 8 (Bagus)
PM2,5 6 (Bagus)
PM10 6 (Bagus)
CO 268 (Bagus)
NO2 19 (Bagus)
O3 52 (Bagus)
Data tentang polusi udara dari beberapa hari terakhir di Šiauliai
index
2024-01-10
2024-01-11
2024-01-12
2024-01-13
2024-01-14
2024-01-15
2024-01-16
2024-01-17
pm25
4
Good
5
Good
-
Good
-
Good
10
Good
4
Good
7
Good
8
Good
pm10
6
Good
9
Good
10
Good
10
Good
13
Good
8
Good
7
Good
9
Good
so2
8
Good
8
Good
8
Good
8
Good
8
Good
8
Good
8
Good
8
Good
o3
53
Good
60
Good
50
Good
53
Good
43
Good
42
Good
50
Good
61
Good
no2
10
Good
13
Good
17
Good
12
Good
14
Good
25
Good
21
Good
10
Good
co
239
Good
274
Good
299
Good
276
Good
330
Good
339
Good
399
Good
270
Good
data source »
Polusi udara di Šiauliai dari September 2017 ke Mei 2020
index
2020-05
2020-04
2020-03
2020-02
2020-01
2019-12
2019-11
2019-10
2019-09
2019-08
2019-07
2019-06
2019-05
2019-04
2019-03
2019-02
2019-01
2018-12
2018-11
2018-10
2018-09
2018-08
2018-07
2018-06
2018-05
2018-04
2018-03
2018-02
2018-01
2017-12
2017-11
2017-10
2017-09
pm10
21 (Moderate)
18 (Good)
22 (Moderate)
14 (Good)
15 (Good)
9.5 (Good)
7.9 (Good)
6.8 (Good)
4.3 (Good)
8.3 (Good)
8 (Good)
13 (Good)
9.9 (Good)
16 (Good)
7.5 (Good)
12 (Good)
12 (Good)
11 (Good)
13 (Good)
8 (Good)
8.2 (Good)
11 (Good)
15 (Good)
7.7 (Good)
14 (Good)
9.3 (Good)
11 (Good)
15 (Good)
9.1 (Good)
5.9 (Good)
12 (Good)
6.6 (Good)
8.1 (Good)
pm25
7.2 (Good)
5.9 (Good)
15 (Moderate)
6.7 (Good)
6.5 (Good)
5.8 (Good)
5.1 (Good)
3.7 (Good)
2.6 (Good)
3.7 (Good)
2.5 (Good)
4.1 (Good)
3.7 (Good)
9.6 (Good)
4.5 (Good)
6.9 (Good)
14 (Moderate)
11 (Good)
8.8 (Good)
4.8 (Good)
4.2 (Good)
3.6 (Good)
5.3 (Good)
2.5 (Good)
4.6 (Good)
4.5 (Good)
9.3 (Good)
16 (Moderate)
6.2 (Good)
3.2 (Good)
8.8 (Good)
5 (Good)
4 (Good)
so2
7.7 (Good)
7.8 (Good)
7.4 (Good)
7.3 (Good)
6.4 (Good)
3 (Good)
1.8 (Good)
1.8 (Good)
0.98 (Good)
1.6 (Good)
1.2 (Good)
0.9 (Good)
2.9 (Good)
5.4 (Good)
5.2 (Good)
4.3 (Good)
5.2 (Good)
4.9 (Good)
3.7 (Good)
2.7 (Good)
2.4 (Good)
2.3 (Good)
1.9 (Good)
1.2 (Good)
1.2 (Good)
1.1 (Good)
1.6 (Good)
2.4 (Good)
3.3 (Good)
3.1 (Good)
4.2 (Good)
2.8 (Good)
2.9 (Good)
co
0.19 (Good)
0.21 (Good)
0.26 (Good)
0.25 (Good)
0.25 (Good)
0.15 (Good)
0.09 (Good)
0.1 (Good)
0.05 (Good)
0.07 (Good)
0.06 (Good)
0.09 (Good)
0.08 (Good)
0.15 (Good)
0.13 (Good)
0.23 (Good)
0.26 (Good)
0.27 (Good)
0.21 (Good)
0.14 (Good)
0.11 (Good)
0.12 (Good)
0.1 (Good)
0.09 (Good)
0.11 (Good)
0.11 (Good)
0.19 (Good)
0.31 (Good)
0.19 (Good)
0.15 (Good)
0.2 (Good)
0.2 (Good)
0.2 (Good)
no2
6.6 (Good)
5.9 (Good)
7.3 (Good)
6.2 (Good)
7.2 (Good)
3.7 (Good)
3 (Good)
3.1 (Good)
2.1 (Good)
4.8 (Good)
3.1 (Good)
7.2 (Good)
3.8 (Good)
5.8 (Good)
3.7 (Good)
8 (Good)
7.5 (Good)
12 (Good)
8.3 (Good)
4.3 (Good)
6.1 (Good)
8.7 (Good)
9.4 (Good)
6.6 (Good)
5.8 (Good)
4.2 (Good)
8.5 (Good)
11 (Good)
11 (Good)
9.8 (Good)
16 (Good)
11 (Good)
14 (Good)
o3
60 (Good)
69 (Good)
62 (Good)
56 (Good)
46 (Good)
20 (Good)
9.9 (Good)
19 (Good)
11 (Good)
18 (Good)
19 (Good)
33 (Good)
28 (Good)
35 (Good)
32 (Good)
29 (Good)
24 (Good)
19 (Good)
16 (Good)
19 (Good)
24 (Good)
31 (Good)
35 (Good)
33 (Good)
39 (Good)
36 (Good)
25 (Good)
20 (Good)
19 (Good)
15 (Good)
13 (Good)
12 (Good)
13 (Good)
data source »
Kualitas hidup di Šiauliai
Hijau dan taman di kota
Šiauliai
98%
Latvia: 88%
Belarus: 66%
Estonia: 82%
Polandia: 62%
Kepulauan Åland: 75%
partikulat Matter PM 2.5
Šiauliai
24 (Moderate)
Kenikmatan menghabiskan waktu di kota
Šiauliai
70%
Latvia: 82%
Belarus: 69%
Estonia: 90%
Polandia: 48%
Kepulauan Åland: 92%
partikulat Matter PM10
Šiauliai
37 (Moderate)
Polusi udara
Šiauliai
33%
Latvia: 29%
Belarus: 42%
Estonia: 12%
Polandia: 63%
Kepulauan Åland: 17%
Pembuangan sampah
Šiauliai
73%
Latvia: 70%
Belarus: 67%
Estonia: 79%
Polandia: 60%
Kepulauan Åland: 88%
Ketersediaan dan kualitas air minum
Šiauliai
92%
Latvia: 79%
Belarus: 65%
Estonia: 90%
Polandia: 65%
Kepulauan Åland: 96%
Kebersihan dan kerasnya
Šiauliai
96%
Latvia: 72%
Belarus: 79%
Estonia: 82%
Polandia: 58%
Kepulauan Åland: 83%
Kebisingan dan polusi cahaya
Šiauliai
50%
Latvia: 37%
Belarus: 46%
Estonia: 31%
Polandia: 51%
Kepulauan Åland: 46%
Polusi air
Šiauliai
52%
Latvia: 28%
Belarus: 44%
Estonia: 16%
Polandia: 39%
Kepulauan Åland: 10%
Source: Numbeo
LT00021
Rabu, 17 Januari 2024 04.00
SO2 8.8 (Bagus)
sulfur dioksida (SO2)
PM2,5 6 (Bagus)
partikulat Matter (PM 2.5) debu
PM10 6.7 (Bagus)
partikulat Matter (PM10) debu tersuspensi
LT00022
Rabu, 17 Januari 2024 04.00
SO2 6.7 (Bagus)
sulfur dioksida (SO2)
CO 268 (Bagus)
karbon monoksida (CO)
NO2 19 (Bagus)
nitrogen dioksida (NO2)
O3 52 (Bagus)
ozon (O3)
PM10 6.2 (Bagus)
partikulat Matter (PM10) debu tersuspensi
LT00021
index
2024-01-17
2024-01-16
2024-01-15
2024-01-14
2024-01-13
2024-01-12
2024-01-11
2024-01-10
pm25
8.2
7.1
4
10
-
-
5.2
4.4
pm10
9.1
7.8
4.2
11
-
-
6.3
5.4
so2
8.8
8.9
9
8.9
8.7
8.8
9
9.5
LT00022
index
2024-01-17
2024-01-16
2024-01-15
2024-01-14
2024-01-13
2024-01-12
2024-01-11
2024-01-10
pm10
-
7
12
16
9.8
9.6
11
7
o3
61
50
42
43
53
50
60
53
so2
6.7
6.9
7.1
6.9
6.8
6.8
6.7
6.9
no2
10
21
25
14
12
17
13
9.8
co
270
399
339
330
276
299
274
239
LT00021
2017-09 2020-05
index
2020-05
2020-04
2020-03
2020-02
2020-01
2019-12
2019-11
2019-10
2019-09
2019-08
2019-07
2019-06
2019-05
2019-04
2019-03
2019-02
2019-01
2018-12
2018-11
2018-10
2018-09
2018-08
2018-07
2018-06
2018-05
2018-04
2018-03
2018-02
2018-01
2017-12
2017-11
2017-10
2017-09
pm25
7.2
5.9
15
6.7
6.5
5.8
5.1
3.7
2.6
3.7
2.5
4.1
3.7
9.6
4.5
6.9
14
11
8.8
4.8
4.2
3.6
5.3
2.5
4.6
4.5
9.3
16
6.2
3.2
8.8
5
4
pm10
21
21
25
16
17
11
9.3
7.8
5.3
9.3
8.5
13
9.9
18
7.8
13
13
10
9.2
5.5
6.8
9.3
14
7.7
14
8.1
10
17
8.5
5.1
13
8.4
8.1
so2
9.5
9.1
8.2
8.3
7
3.1
1.8
1.4
0.72
1.6
1
0.26
4.6
7.7
7.4
4.6
6.9
6.4
4.6
3.6
2.6
2.4
1.9
1.2
1.5
1.9
2.5
4.5
3.9
2.6
4
2.5
1.9
LT00022
index
2020-05
2020-04
2020-03
2020-02
2020-01
2019-12
2019-11
2019-10
2019-09
2019-08
2019-07
2019-06
2019-05
2019-04
2019-03
2019-02
2019-01
2018-12
2018-11
2018-10
2018-09
2018-08
2018-07
2018-06
2018-05
2018-04
2018-03
2018-02
2018-01
2017-12
2017-11
2017-10
2017-09
co
0.19
0.21
0.26
0.25
0.25
0.15
0.09
0.1
0.05
0.07
0.06
0.09
0.08
0.15
0.13
0.23
0.26
0.27
0.21
0.14
0.11
0.12
0.1
0.09
0.11
0.11
0.19
0.31
0.19
0.15
0.2
0.2
0.2
so2
5.9
6.6
6.6
6.3
5.8
2.9
1.9
2.2
1.2
1.7
1.3
1.5
1.1
3
3
4
3.5
3.3
2.9
1.8
2.2
2.3
1.9
1.1
0.86
0.43
0.64
0.26
2.7
3.6
4.4
3.1
3.8
no2
6.6
5.9
7.3
6.2
7.2
3.7
3
3.1
2.1
4.8
3.1
7.2
3.8
5.8
3.7
8
7.5
12
8.3
4.3
6.1
8.7
9.4
6.6
5.8
4.2
8.5
11
11
9.8
16
11
14
o3
60
69
62
56
46
20
9.9
19
11
18
19
33
28
35
32
29
24
19
16
19
24
31
35
33
39
36
25
20
19
15
13
12
13
pm10
21
16
20
12
14
8.2
6.5
5.8
3.4
7.3
7.4
12
10
14
7.2
12
12
11
17
10
9.7
12
17
7.7
13
10
13
14
9.7
6.7
12
4.7
-
* Pollution data source:
https://openaq.org
(EEA Lithuania)
The data is licensed under CC-By 4.0
SO2 8 (Bagus)
PM2,5 6 (Bagus)
PM10 6 (Bagus)
CO 268 (Bagus)
NO2 19 (Bagus)
O3 52 (Bagus)
Data tentang polusi udara dari beberapa hari terakhir di Šiauliai
| index | 2024-01-10 | 2024-01-11 | 2024-01-12 | 2024-01-13 | 2024-01-14 | 2024-01-15 | 2024-01-16 | 2024-01-17 |
|---|---|---|---|---|---|---|---|---|
| pm25 | 4 Good |
5 Good |
- Good |
- Good |
10 Good |
4 Good |
7 Good |
8 Good |
| pm10 | 6 Good |
9 Good |
10 Good |
10 Good |
13 Good |
8 Good |
7 Good |
9 Good |
| so2 | 8 Good |
8 Good |
8 Good |
8 Good |
8 Good |
8 Good |
8 Good |
8 Good |
| o3 | 53 Good |
60 Good |
50 Good |
53 Good |
43 Good |
42 Good |
50 Good |
61 Good |
| no2 | 10 Good |
13 Good |
17 Good |
12 Good |
14 Good |
25 Good |
21 Good |
10 Good |
| co | 239 Good |
274 Good |
299 Good |
276 Good |
330 Good |
339 Good |
399 Good |
270 Good |

| index | 2020-05 | 2020-04 | 2020-03 | 2020-02 | 2020-01 | 2019-12 | 2019-11 | 2019-10 | 2019-09 | 2019-08 | 2019-07 | 2019-06 | 2019-05 | 2019-04 | 2019-03 | 2019-02 | 2019-01 | 2018-12 | 2018-11 | 2018-10 | 2018-09 | 2018-08 | 2018-07 | 2018-06 | 2018-05 | 2018-04 | 2018-03 | 2018-02 | 2018-01 | 2017-12 | 2017-11 | 2017-10 | 2017-09 |
|---|---|---|---|---|---|---|---|---|---|---|---|---|---|---|---|---|---|---|---|---|---|---|---|---|---|---|---|---|---|---|---|---|---|
| pm10 | 21 (Moderate) | 18 (Good) | 22 (Moderate) | 14 (Good) | 15 (Good) | 9.5 (Good) | 7.9 (Good) | 6.8 (Good) | 4.3 (Good) | 8.3 (Good) | 8 (Good) | 13 (Good) | 9.9 (Good) | 16 (Good) | 7.5 (Good) | 12 (Good) | 12 (Good) | 11 (Good) | 13 (Good) | 8 (Good) | 8.2 (Good) | 11 (Good) | 15 (Good) | 7.7 (Good) | 14 (Good) | 9.3 (Good) | 11 (Good) | 15 (Good) | 9.1 (Good) | 5.9 (Good) | 12 (Good) | 6.6 (Good) | 8.1 (Good) |
| pm25 | 7.2 (Good) | 5.9 (Good) | 15 (Moderate) | 6.7 (Good) | 6.5 (Good) | 5.8 (Good) | 5.1 (Good) | 3.7 (Good) | 2.6 (Good) | 3.7 (Good) | 2.5 (Good) | 4.1 (Good) | 3.7 (Good) | 9.6 (Good) | 4.5 (Good) | 6.9 (Good) | 14 (Moderate) | 11 (Good) | 8.8 (Good) | 4.8 (Good) | 4.2 (Good) | 3.6 (Good) | 5.3 (Good) | 2.5 (Good) | 4.6 (Good) | 4.5 (Good) | 9.3 (Good) | 16 (Moderate) | 6.2 (Good) | 3.2 (Good) | 8.8 (Good) | 5 (Good) | 4 (Good) |
| so2 | 7.7 (Good) | 7.8 (Good) | 7.4 (Good) | 7.3 (Good) | 6.4 (Good) | 3 (Good) | 1.8 (Good) | 1.8 (Good) | 0.98 (Good) | 1.6 (Good) | 1.2 (Good) | 0.9 (Good) | 2.9 (Good) | 5.4 (Good) | 5.2 (Good) | 4.3 (Good) | 5.2 (Good) | 4.9 (Good) | 3.7 (Good) | 2.7 (Good) | 2.4 (Good) | 2.3 (Good) | 1.9 (Good) | 1.2 (Good) | 1.2 (Good) | 1.1 (Good) | 1.6 (Good) | 2.4 (Good) | 3.3 (Good) | 3.1 (Good) | 4.2 (Good) | 2.8 (Good) | 2.9 (Good) |
| co | 0.19 (Good) | 0.21 (Good) | 0.26 (Good) | 0.25 (Good) | 0.25 (Good) | 0.15 (Good) | 0.09 (Good) | 0.1 (Good) | 0.05 (Good) | 0.07 (Good) | 0.06 (Good) | 0.09 (Good) | 0.08 (Good) | 0.15 (Good) | 0.13 (Good) | 0.23 (Good) | 0.26 (Good) | 0.27 (Good) | 0.21 (Good) | 0.14 (Good) | 0.11 (Good) | 0.12 (Good) | 0.1 (Good) | 0.09 (Good) | 0.11 (Good) | 0.11 (Good) | 0.19 (Good) | 0.31 (Good) | 0.19 (Good) | 0.15 (Good) | 0.2 (Good) | 0.2 (Good) | 0.2 (Good) |
| no2 | 6.6 (Good) | 5.9 (Good) | 7.3 (Good) | 6.2 (Good) | 7.2 (Good) | 3.7 (Good) | 3 (Good) | 3.1 (Good) | 2.1 (Good) | 4.8 (Good) | 3.1 (Good) | 7.2 (Good) | 3.8 (Good) | 5.8 (Good) | 3.7 (Good) | 8 (Good) | 7.5 (Good) | 12 (Good) | 8.3 (Good) | 4.3 (Good) | 6.1 (Good) | 8.7 (Good) | 9.4 (Good) | 6.6 (Good) | 5.8 (Good) | 4.2 (Good) | 8.5 (Good) | 11 (Good) | 11 (Good) | 9.8 (Good) | 16 (Good) | 11 (Good) | 14 (Good) |
| o3 | 60 (Good) | 69 (Good) | 62 (Good) | 56 (Good) | 46 (Good) | 20 (Good) | 9.9 (Good) | 19 (Good) | 11 (Good) | 18 (Good) | 19 (Good) | 33 (Good) | 28 (Good) | 35 (Good) | 32 (Good) | 29 (Good) | 24 (Good) | 19 (Good) | 16 (Good) | 19 (Good) | 24 (Good) | 31 (Good) | 35 (Good) | 33 (Good) | 39 (Good) | 36 (Good) | 25 (Good) | 20 (Good) | 19 (Good) | 15 (Good) | 13 (Good) | 12 (Good) | 13 (Good) |
Hijau dan taman di kota
Šiauliai 98%
Latvia: 88% Belarus: 66% Estonia: 82% Polandia: 62% Kepulauan Åland: 75%partikulat Matter PM 2.5
Šiauliai 24 (Moderate)
Kenikmatan menghabiskan waktu di kota
Šiauliai 70%
Latvia: 82% Belarus: 69% Estonia: 90% Polandia: 48% Kepulauan Åland: 92%partikulat Matter PM10
Šiauliai 37 (Moderate)
Polusi udara
Šiauliai 33%
Latvia: 29% Belarus: 42% Estonia: 12% Polandia: 63% Kepulauan Åland: 17%Pembuangan sampah
Šiauliai 73%
Latvia: 70% Belarus: 67% Estonia: 79% Polandia: 60% Kepulauan Åland: 88%Ketersediaan dan kualitas air minum
Šiauliai 92%
Latvia: 79% Belarus: 65% Estonia: 90% Polandia: 65% Kepulauan Åland: 96%Kebersihan dan kerasnya
Šiauliai 96%
Latvia: 72% Belarus: 79% Estonia: 82% Polandia: 58% Kepulauan Åland: 83%Kebisingan dan polusi cahaya
Šiauliai 50%
Latvia: 37% Belarus: 46% Estonia: 31% Polandia: 51% Kepulauan Åland: 46%Polusi air
Šiauliai 52%
Latvia: 28% Belarus: 44% Estonia: 16% Polandia: 39% Kepulauan Åland: 10%SO2 8.8 (Bagus)
sulfur dioksida (SO2)PM2,5 6 (Bagus)
partikulat Matter (PM 2.5) debuPM10 6.7 (Bagus)
partikulat Matter (PM10) debu tersuspensiSO2 6.7 (Bagus)
sulfur dioksida (SO2)CO 268 (Bagus)
karbon monoksida (CO)NO2 19 (Bagus)
nitrogen dioksida (NO2)O3 52 (Bagus)
ozon (O3)PM10 6.2 (Bagus)
partikulat Matter (PM10) debu tersuspensiLT00021
| index | 2024-01-17 | 2024-01-16 | 2024-01-15 | 2024-01-14 | 2024-01-13 | 2024-01-12 | 2024-01-11 | 2024-01-10 |
|---|---|---|---|---|---|---|---|---|
| pm25 | 8.2 | 7.1 | 4 | 10 | - | - | 5.2 | 4.4 |
| pm10 | 9.1 | 7.8 | 4.2 | 11 | - | - | 6.3 | 5.4 |
| so2 | 8.8 | 8.9 | 9 | 8.9 | 8.7 | 8.8 | 9 | 9.5 |
LT00022
| index | 2024-01-17 | 2024-01-16 | 2024-01-15 | 2024-01-14 | 2024-01-13 | 2024-01-12 | 2024-01-11 | 2024-01-10 |
|---|---|---|---|---|---|---|---|---|
| pm10 | - | 7 | 12 | 16 | 9.8 | 9.6 | 11 | 7 |
| o3 | 61 | 50 | 42 | 43 | 53 | 50 | 60 | 53 |
| so2 | 6.7 | 6.9 | 7.1 | 6.9 | 6.8 | 6.8 | 6.7 | 6.9 |
| no2 | 10 | 21 | 25 | 14 | 12 | 17 | 13 | 9.8 |
| co | 270 | 399 | 339 | 330 | 276 | 299 | 274 | 239 |
LT00021

| index | 2020-05 | 2020-04 | 2020-03 | 2020-02 | 2020-01 | 2019-12 | 2019-11 | 2019-10 | 2019-09 | 2019-08 | 2019-07 | 2019-06 | 2019-05 | 2019-04 | 2019-03 | 2019-02 | 2019-01 | 2018-12 | 2018-11 | 2018-10 | 2018-09 | 2018-08 | 2018-07 | 2018-06 | 2018-05 | 2018-04 | 2018-03 | 2018-02 | 2018-01 | 2017-12 | 2017-11 | 2017-10 | 2017-09 |
|---|---|---|---|---|---|---|---|---|---|---|---|---|---|---|---|---|---|---|---|---|---|---|---|---|---|---|---|---|---|---|---|---|---|
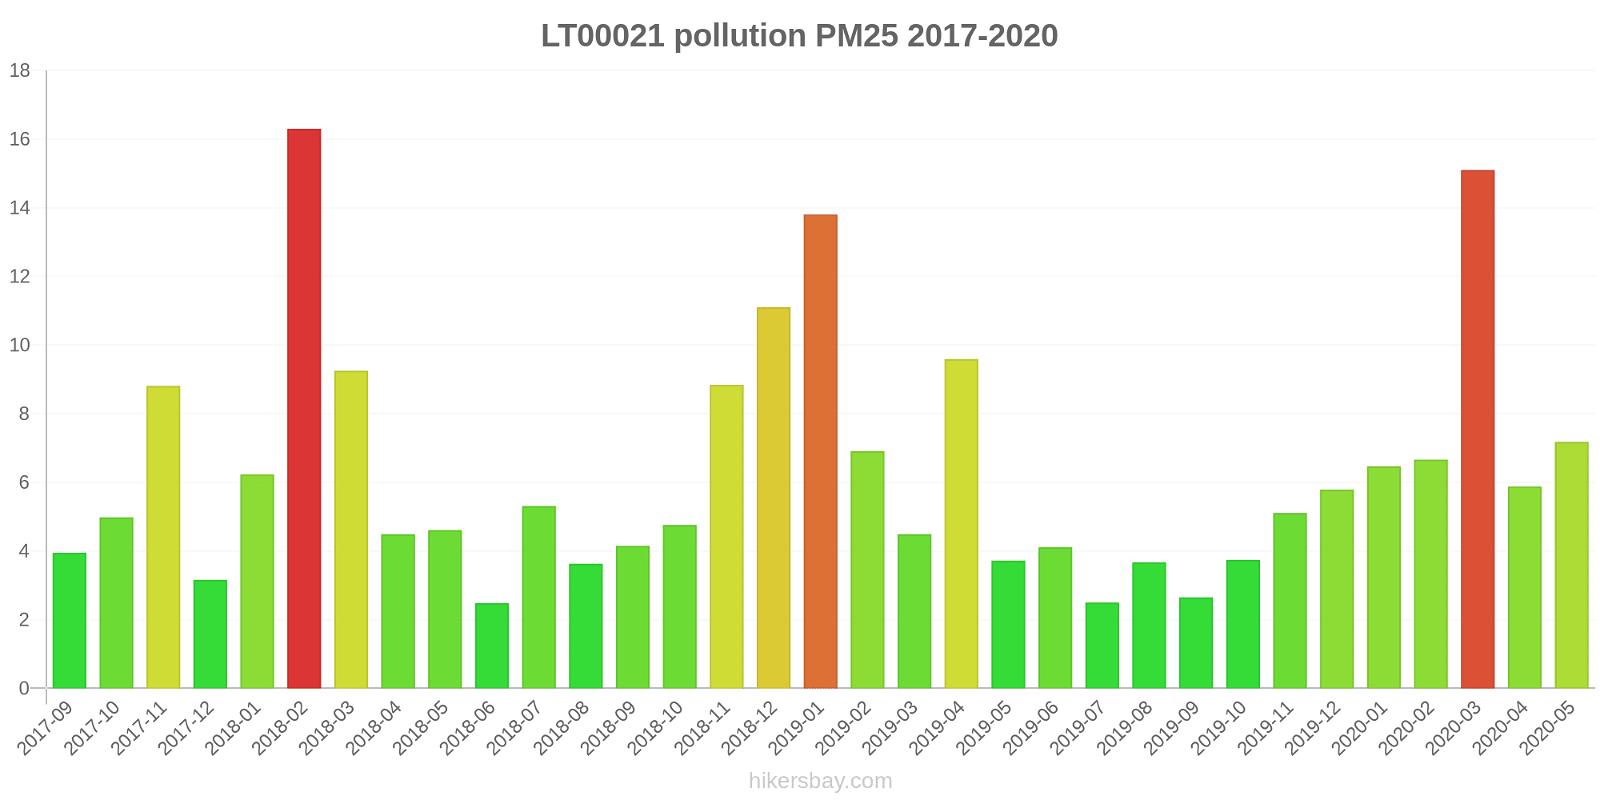
| pm25 | 7.2 | 5.9 | 15 | 6.7 | 6.5 | 5.8 | 5.1 | 3.7 | 2.6 | 3.7 | 2.5 | 4.1 | 3.7 | 9.6 | 4.5 | 6.9 | 14 | 11 | 8.8 | 4.8 | 4.2 | 3.6 | 5.3 | 2.5 | 4.6 | 4.5 | 9.3 | 16 | 6.2 | 3.2 | 8.8 | 5 | 4 |
| pm10 | 21 | 21 | 25 | 16 | 17 | 11 | 9.3 | 7.8 | 5.3 | 9.3 | 8.5 | 13 | 9.9 | 18 | 7.8 | 13 | 13 | 10 | 9.2 | 5.5 | 6.8 | 9.3 | 14 | 7.7 | 14 | 8.1 | 10 | 17 | 8.5 | 5.1 | 13 | 8.4 | 8.1 |
| so2 | 9.5 | 9.1 | 8.2 | 8.3 | 7 | 3.1 | 1.8 | 1.4 | 0.72 | 1.6 | 1 | 0.26 | 4.6 | 7.7 | 7.4 | 4.6 | 6.9 | 6.4 | 4.6 | 3.6 | 2.6 | 2.4 | 1.9 | 1.2 | 1.5 | 1.9 | 2.5 | 4.5 | 3.9 | 2.6 | 4 | 2.5 | 1.9 |
LT00022
| index | 2020-05 | 2020-04 | 2020-03 | 2020-02 | 2020-01 | 2019-12 | 2019-11 | 2019-10 | 2019-09 | 2019-08 | 2019-07 | 2019-06 | 2019-05 | 2019-04 | 2019-03 | 2019-02 | 2019-01 | 2018-12 | 2018-11 | 2018-10 | 2018-09 | 2018-08 | 2018-07 | 2018-06 | 2018-05 | 2018-04 | 2018-03 | 2018-02 | 2018-01 | 2017-12 | 2017-11 | 2017-10 | 2017-09 |
|---|---|---|---|---|---|---|---|---|---|---|---|---|---|---|---|---|---|---|---|---|---|---|---|---|---|---|---|---|---|---|---|---|---|
| co | 0.19 | 0.21 | 0.26 | 0.25 | 0.25 | 0.15 | 0.09 | 0.1 | 0.05 | 0.07 | 0.06 | 0.09 | 0.08 | 0.15 | 0.13 | 0.23 | 0.26 | 0.27 | 0.21 | 0.14 | 0.11 | 0.12 | 0.1 | 0.09 | 0.11 | 0.11 | 0.19 | 0.31 | 0.19 | 0.15 | 0.2 | 0.2 | 0.2 |
| so2 | 5.9 | 6.6 | 6.6 | 6.3 | 5.8 | 2.9 | 1.9 | 2.2 | 1.2 | 1.7 | 1.3 | 1.5 | 1.1 | 3 | 3 | 4 | 3.5 | 3.3 | 2.9 | 1.8 | 2.2 | 2.3 | 1.9 | 1.1 | 0.86 | 0.43 | 0.64 | 0.26 | 2.7 | 3.6 | 4.4 | 3.1 | 3.8 |
| no2 | 6.6 | 5.9 | 7.3 | 6.2 | 7.2 | 3.7 | 3 | 3.1 | 2.1 | 4.8 | 3.1 | 7.2 | 3.8 | 5.8 | 3.7 | 8 | 7.5 | 12 | 8.3 | 4.3 | 6.1 | 8.7 | 9.4 | 6.6 | 5.8 | 4.2 | 8.5 | 11 | 11 | 9.8 | 16 | 11 | 14 |
| o3 | 60 | 69 | 62 | 56 | 46 | 20 | 9.9 | 19 | 11 | 18 | 19 | 33 | 28 | 35 | 32 | 29 | 24 | 19 | 16 | 19 | 24 | 31 | 35 | 33 | 39 | 36 | 25 | 20 | 19 | 15 | 13 | 12 | 13 |
| pm10 | 21 | 16 | 20 | 12 | 14 | 8.2 | 6.5 | 5.8 | 3.4 | 7.3 | 7.4 | 12 | 10 | 14 | 7.2 | 12 | 12 | 11 | 17 | 10 | 9.7 | 12 | 17 | 7.7 | 13 | 10 | 13 | 14 | 9.7 | 6.7 | 12 | 4.7 | - |