Polusi udara di Dublin City: indeks kualitas udara real-time dan siaga asap.
Perkiraan kualitas polusi dan udara untuk Dublin City. Hari ini Minggu, 21 Juni 2026. Nilai polusi udara berikut telah tercatat untuk Dublin City:- nitrogen dioksida (NO2) - 66 (Moderat)
- partikulat Matter (PM10) debu tersuspensi - 14 (Bagus)
- partikulat Matter (PM 2.5) debu - 9 (Bagus)
- sulfur dioksida (SO2) - 5 (Bagus)
- ozon (O3) - 1 (Bagus)
- karbon monoksida (CO) - 200 (Bagus)

Apa kualitas udara di Dublin City hari ini? Apakah udara tercemar di Dublin City?. Apakah ada Smog?
Seberapa tinggi tingkat NO2? (nitrogen dioksida (NO2))
66 (Moderat)
Apa tingkat PM10 hari ini di Dublin City? (partikulat Matter (PM10) debu tersuspensi)
Level saat ini dari partikulat Matter PM10 di Dublin City adalah:
14 (Bagus)
Nilai PM10 tertinggi biasanya terjadi di bulan: 27 (April 2019).
Nilai terendah dari partikulat PM10 pencemaran Dublin City biasanya dicatat di: Agustus (2.4).
Apa tingkat saat PM 2,5 in Dublin City? (partikulat Matter (PM 2.5) debu)
Hari ini PM 2.5 tingkat:
9 (Bagus)
Sebagai perbandingan, tingkat tertinggi PM 2,5 in Dublin City dalam 7 hari terakhir adalah: 18 (Sabtu, 13 Januari 2024) dan Terendah: 4 (Rabu, 10 Januari 2024).
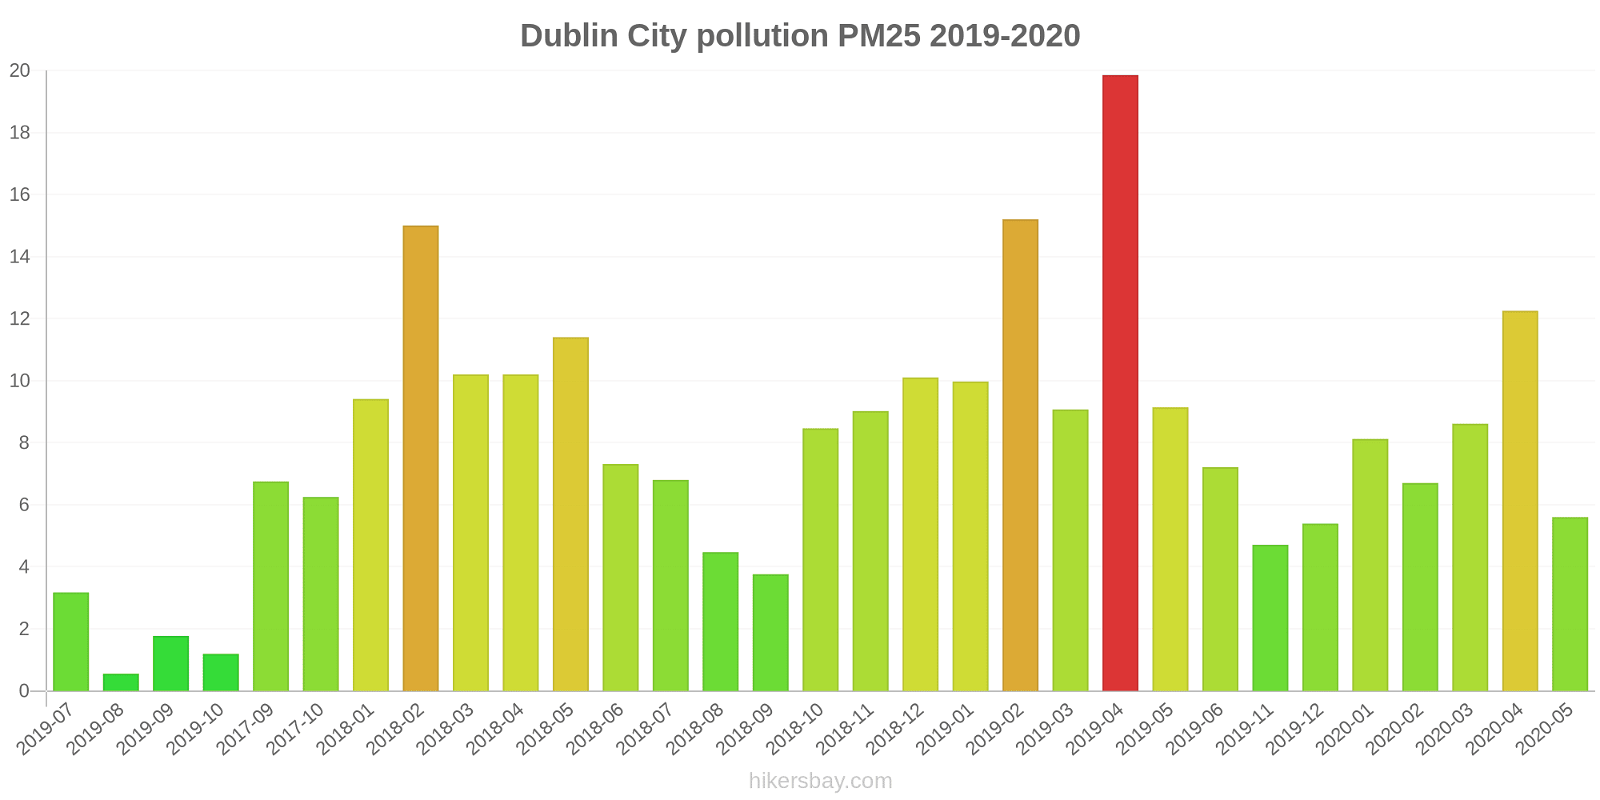
Nilai tertinggi PM 2.5 direkam: 20 (April 2019).
Tingkat terendah dari partikulat Matter PM 2.5 polusi terjadi di bulan: Agustus (0.55).
Apa tingkat polusi SO2? (sulfur dioksida (SO2))
5 (Bagus)
Bagaimana tingkat O3 hari ini di Dublin City? (ozon (O3))
1 (Bagus)
Seberapa tinggi tingkat CO? (karbon monoksida (CO))
200 (Bagus)
Data saat ini Rabu, 17 Januari 2024 11.00
NO2 66 (Moderat)
PM10 14 (Bagus)
PM2,5 9 (Bagus)
SO2 5 (Bagus)
O3 1 (Bagus)
CO 200 (Bagus)
Data tentang polusi udara dari beberapa hari terakhir di Dublin City
index
2024-01-10
2024-01-11
2024-01-12
2024-01-13
2024-01-14
2024-01-15
2024-01-16
2024-01-17
pm25
4
Good
4
Good
10
Good
18
Moderate
9
Good
10
Good
6
Good
9
Good
pm10
10
Good
9
Good
13
Good
20
Moderate
11
Good
15
Good
10
Good
12
Good
no2
21
Good
22
Good
21
Good
21
Good
19
Good
32
Good
17
Good
34
Good
so2
1
Good
1
Good
1
Good
2
Good
3
Good
4
Good
2
Good
4
Good
o3
49
Good
51
Good
33
Good
20
Good
35
Good
26
Good
54
Good
21
Good
co
170
Good
164
Good
130
Good
175
Good
146
Good
158
Good
105
Good
159
Good
data source »
Polusi udara di Dublin City dari Desember 2017 ke Mei 2020
index
2020-05
2020-04
2020-03
2020-02
2020-01
2019-12
2019-11
2019-09
2019-08
2019-07
2019-06
2019-05
2019-04
2019-03
2019-02
2019-01
2019-10
2018-12
2018-11
2018-10
2018-09
2018-08
2018-07
2018-06
2018-05
2018-04
2018-03
2018-02
2018-01
2017-10
2017-09
2017-12
pm10
9.6 (Good)
18 (Good)
15 (Good)
11 (Good)
13 (Good)
10 (Good)
10 (Good)
3.9 (Good)
2.4 (Good)
5.6 (Good)
9.8 (Good)
12 (Good)
27 (Moderate)
16 (Good)
25 (Moderate)
14 (Good)
4.4 (Good)
13 (Good)
11 (Good)
10 (Good)
6.2 (Good)
6.2 (Good)
8.7 (Good)
10 (Good)
14 (Good)
12 (Good)
13 (Good)
18 (Good)
12 (Good)
9 (Good)
9.5 (Good)
- (Good)
no2
9.8 (Good)
16 (Good)
17 (Good)
16 (Good)
19 (Good)
20 (Good)
24 (Good)
10 (Good)
5.1 (Good)
12 (Good)
19 (Good)
17 (Good)
30 (Good)
23 (Good)
33 (Good)
29 (Good)
6.5 (Good)
29 (Good)
27 (Good)
25 (Good)
19 (Good)
15 (Good)
17 (Good)
23 (Good)
31 (Good)
23 (Good)
27 (Good)
27 (Good)
- (Good)
13 (Good)
17 (Good)
- (Good)
o3
64 (Good)
61 (Good)
55 (Good)
57 (Good)
51 (Good)
26 (Good)
17 (Good)
- (Good)
- (Good)
28 (Good)
48 (Good)
54 (Good)
63 (Good)
56 (Good)
48 (Good)
36 (Good)
4.8 (Good)
44 (Good)
40 (Good)
41 (Good)
37 (Good)
36 (Good)
39 (Good)
51 (Good)
51 (Good)
61 (Good)
51 (Good)
47 (Good)
- (Good)
47 (Good)
40 (Good)
- (Good)
pm25
5.6 (Good)
12 (Good)
8.6 (Good)
6.7 (Good)
8.1 (Good)
5.4 (Good)
4.7 (Good)
1.8 (Good)
0.55 (Good)
3.2 (Good)
7.2 (Good)
9.1 (Good)
20 (Moderate)
9.1 (Good)
15 (Moderate)
10 (Good)
1.2 (Good)
10 (Good)
9 (Good)
8.5 (Good)
3.8 (Good)
4.5 (Good)
6.8 (Good)
7.3 (Good)
11 (Good)
10 (Good)
10 (Good)
15 (Moderate)
9.4 (Good)
6.3 (Good)
6.8 (Good)
- (Good)
so2
1.8 (Good)
2.4 (Good)
3.7 (Good)
4.9 (Good)
2.4 (Good)
1.2 (Good)
0.83 (Good)
0.29 (Good)
0.17 (Good)
0.73 (Good)
0.72 (Good)
0.89 (Good)
7 (Good)
10 (Good)
5.5 (Good)
2.6 (Good)
0.09 (Good)
1.6 (Good)
0.65 (Good)
1.3 (Good)
0.47 (Good)
1.1 (Good)
5.1 (Good)
6.1 (Good)
12 (Good)
1.5 (Good)
2.5 (Good)
2.6 (Good)
- (Good)
1.3 (Good)
1.1 (Good)
- (Good)
co
0.26 (Good)
0.34 (Good)
0.32 (Good)
0.29 (Good)
0.32 (Good)
0.34 (Good)
0.34 (Good)
0.14 (Good)
0.03 (Good)
0.15 (Good)
0.23 (Good)
0.28 (Good)
0.46 (Good)
0.35 (Good)
0.47 (Good)
0.4 (Good)
0.03 (Good)
0.4 (Good)
0.32 (Good)
0.33 (Good)
0.3 (Good)
0.24 (Good)
0.34 (Good)
0.34 (Good)
0.32 (Good)
0.43 (Good)
0.48 (Good)
0.42 (Good)
0.39 (Good)
0.38 (Good)
0.41 (Good)
0.34 (Good)
data source »
Kualitas hidup di Dublin City
Hijau dan taman di kota
Dublin City
76%
Pulau Man: 78%
Britania Raya: 75%
Belanda: 82%
Belgia: 64%
Kepulauan Faroe: 87%
partikulat Matter PM 2.5
Dublin City
11 (Good)
Kenikmatan menghabiskan waktu di kota
Dublin City
72%
Pulau Man: 83%
Britania Raya: 70%
Belanda: 88%
Belgia: 64%
Kepulauan Faroe: 100%
partikulat Matter PM10
Dublin City
16 (Good)
Polusi udara
Dublin City
33%
Pulau Man: 13%
Britania Raya: 37%
Belanda: 21%
Belgia: 45%
Kepulauan Faroe: 0%
Pembuangan sampah
Dublin City
57%
Pulau Man: 78%
Britania Raya: 60%
Belanda: 79%
Belgia: 54%
Kepulauan Faroe: 88%
Ketersediaan dan kualitas air minum
Dublin City
70%
Pulau Man: 88%
Britania Raya: 75%
Belanda: 92%
Belgia: 70%
Kepulauan Faroe: 98%
Kebersihan dan kerasnya
Dublin City
46%
Pulau Man: 69%
Britania Raya: 53%
Belanda: 77%
Belgia: 46%
Kepulauan Faroe: 94%
Kebisingan dan polusi cahaya
Dublin City
44%
Pulau Man: 12%
Britania Raya: 47%
Belanda: 31%
Belgia: 54%
Kepulauan Faroe: 21%
Polusi air
Dublin City
40%
Pulau Man: 13%
Britania Raya: 31%
Belanda: 17%
Belgia: 42%
Kepulauan Faroe: 7,7%
Source: Numbeo
IE001AP
Rabu, 17 Januari 2024 09.00
NO2 63 (Moderat)
nitrogen dioksida (NO2)
PM10 20 (Bagus)
partikulat Matter (PM10) debu tersuspensi
PM2,5 11 (Bagus)
partikulat Matter (PM 2.5) debu
Dublin Rathmines Wynnefield Road
Rabu, 17 Januari 2024 11.00
NO2 82 (Moderat)
nitrogen dioksida (NO2)
PM10 22 (Moderat)
partikulat Matter (PM10) debu tersuspensi
PM2,5 13 (Moderat)
partikulat Matter (PM 2.5) debu
SO2 6 (Bagus)
sulfur dioksida (SO2)
O3 0.72 (Bagus)
ozon (O3)
IE002AP
Rabu, 17 Januari 2024 08.00
PM2,5 4.9 (Bagus)
partikulat Matter (PM 2.5) debu
PM10 7.5 (Bagus)
partikulat Matter (PM10) debu tersuspensi
IE0036A
Rabu, 17 Januari 2024 09.00
PM2,5 8.5 (Bagus)
partikulat Matter (PM 2.5) debu
NO2 63 (Moderat)
nitrogen dioksida (NO2)
PM10 13 (Bagus)
partikulat Matter (PM10) debu tersuspensi
IE003AP
Rabu, 17 Januari 2024 11.00
PM10 8.8 (Bagus)
partikulat Matter (PM10) debu tersuspensi
PM2,5 5.3 (Bagus)
partikulat Matter (PM 2.5) debu
Dublin Winetavern Street
Rabu, 17 Januari 2024 11.00
CO 200 (Bagus)
karbon monoksida (CO)
NO2 57 (Moderat)
nitrogen dioksida (NO2)
SO2 4.7 (Bagus)
sulfur dioksida (SO2)
IE001AP
index
2024-01-17
2024-01-16
2024-01-15
2024-01-14
2024-01-13
2024-01-12
2024-01-11
2024-01-10
pm25
10
6.5
9.5
8.9
17
10
4.6
4.7
pm10
14
11
16
11
20
16
10
11
no2
38
25
36
19
24
23
26
26
Dublin Rathmines Wynnefield Road
index
2024-01-17
2024-01-16
2024-01-15
2024-01-14
2024-01-13
2024-01-12
2024-01-11
2024-01-10
so2
3.9
2.8
3.1
2.7
2
1.5
1.7
1.9
pm25
12
6.5
12
12
19
11
6.7
6.5
pm10
14
9.5
17
14
21
15
14
15
no2
35
13
32
17
23
25
23
19
o3
21
54
26
35
20
33
51
49
IE002AP
index
2024-01-17
2024-01-16
2024-01-15
2024-01-14
2024-01-13
2024-01-12
2024-01-11
2024-01-10
pm10
9.5
12
13
8.9
19
11
6.6
7.2
pm25
7.7
6.7
9.2
7
17
8.1
3.3
3
IE0036A
index
2024-01-17
2024-01-16
2024-01-15
2024-01-14
2024-01-13
2024-01-12
2024-01-11
2024-01-10
pm10
13
9.1
15
12
21
13
8.4
9.4
pm25
10
5.7
10
9.9
20
10
4
4.5
no2
28
13
27
14
17
16
15
15
IE003AP
index
2024-01-17
2024-01-16
2024-01-15
2024-01-14
2024-01-13
2024-01-12
2024-01-11
2024-01-10
pm10
9.3
8.7
14
9
19
12
6.9
7.6
pm25
7.2
5.9
10
7.2
18
8.9
3.3
3.4
Dublin Winetavern Street
index
2024-01-17
2024-01-16
2024-01-15
2024-01-14
2024-01-13
2024-01-12
2024-01-11
2024-01-10
no2
36
18
33
24
22
18
24
22
so2
3.1
1.3
4.2
2.3
1.9
0.87
0.93
1
co
159
105
158
146
175
130
164
170
IE001AP
index
2020-05
2020-04
2020-03
2020-02
2020-01
2019-12
2019-11
2019-09
2019-08
2019-07
2019-06
2019-05
2019-04
2019-03
2019-02
2019-01
pm10
11
21
22
13
16
15
16
3.4
0.85
5.3
12
16
32
24
38
18
IE0028A
2017-09 2020-05

index
2020-05
2020-04
2020-03
2020-02
2020-01
2019-12
2019-11
2019-10
2019-07
2019-06
2019-05
2019-04
2019-03
2019-02
2019-01
2018-12
2018-11
2018-10
2018-09
2018-08
2018-07
2018-06
2018-05
2018-04
2018-03
2018-02
2018-01
2017-10
2017-09
pm25
4.7
12
8.2
6.7
7.2
4.5
5.6
-
-
9.2
11
18
9.6
17
10
10
9
8.5
3.8
4.5
6.8
7.3
11
10
10
15
9.4
6.3
6.8
pm10
7.7
17
12
9.7
11
6.5
7.3
-
-
11
13
21
13
21
13
13
11
10
6.2
6.2
8.7
10
14
12
13
18
12
9
9.5
so2
1.5
1.6
1.4
3.5
0.94
0.57
0.51
0.01
-
0.5
0.79
1.2
0.9
1.5
1.4
1.6
0.65
1.3
0.47
1.1
1.6
3.1
12
1.5
2.5
2.6
-
1.3
1.1
no2
9.8
17
19
18
16
13
16
2.4
17
27
22
26
24
31
28
24
23
21
15
11
6.3
16
29
21
27
27
-
13
17
o3
64
61
55
57
51
26
17
4.8
28
48
54
63
56
48
36
44
40
41
37
36
39
51
51
61
51
47
-
47
40
IE002AP
index
2020-05
2020-04
2020-03
2020-02
2020-01
2019-12
2019-11
2019-10
2019-09
2019-08
2019-07
2019-06
2019-05
2019-04
2019-03
2019-02
2019-01
pm10
9.2
17
12
9.1
11
9.1
8.2
1.6
2.1
0.75
3.1
7.9
8.5
25
13
19
11
IE0036A
index
2020-05
2020-04
2020-03
2020-02
2020-01
2019-12
2019-11
2019-10
2019-09
2019-08
2019-07
2019-06
2019-05
2019-04
2019-03
2019-02
2019-01
no2
7.8
14
14
12
17
18
23
15
9.8
8.3
7.4
11
6.2
27
15
29
24
pm10
9.6
18
15
10
13
12
13
9.7
7.4
7
6.9
8.7
11
31
16
26
14
IE003AP
2019-01 2020-05

index
2020-05
2020-04
2020-03
2020-02
2020-01
2019-12
2019-11
2019-10
2019-09
2019-08
2019-07
2019-06
2019-05
2019-04
2019-03
2019-02
2019-01
pm25
6.5
13
9
6.7
9.1
6.3
3.8
1.2
1.8
0.55
3.2
5.2
6.9
21
8.5
14
9.5
pm10
10
19
15
11
13
8.8
6.6
1.8
2.8
0.9
7.2
8.5
11
27
14
20
12
IE0098A
index
2020-05
2020-04
2020-03
2020-02
2020-01
2019-12
2019-11
2019-10
2019-09
2019-08
2019-07
2019-06
2019-05
2019-04
2019-03
2019-02
2019-01
2018-12
2018-11
2018-10
2018-09
2018-08
2018-07
2018-06
2018-05
2018-04
2018-03
2018-02
2018-01
2017-12
2017-10
2017-09
co
0.26
0.34
0.32
0.29
0.32
0.34
0.34
0.03
0.14
0.03
0.15
0.23
0.28
0.46
0.35
0.47
0.4
0.4
0.32
0.33
0.3
0.24
0.34
0.34
0.32
0.43
0.48
0.42
0.39
0.34
0.38
0.41
no2
12
17
19
19
24
28
31
2.5
10
1.9
10
19
23
36
30
39
36
34
30
29
24
19
27
30
32
26
-
-
-
-
-
-
so2
2.1
3.2
5.9
6.3
3.8
1.8
1.2
0.16
0.29
0.17
0.73
0.93
0.99
13
19
9.4
3.8
-
-
-
-
-
8.5
9.1
-
-
-
-
-
-
-
-
* Pollution data source:
https://openaq.org
(EEA Ireland)
The data is licensed under CC-By 4.0
NO2 66 (Moderat)
PM10 14 (Bagus)
PM2,5 9 (Bagus)
SO2 5 (Bagus)
O3 1 (Bagus)
CO 200 (Bagus)
Data tentang polusi udara dari beberapa hari terakhir di Dublin City
| index | 2024-01-10 | 2024-01-11 | 2024-01-12 | 2024-01-13 | 2024-01-14 | 2024-01-15 | 2024-01-16 | 2024-01-17 |
|---|---|---|---|---|---|---|---|---|
| pm25 | 4 Good |
4 Good |
10 Good |
18 Moderate |
9 Good |
10 Good |
6 Good |
9 Good |
| pm10 | 10 Good |
9 Good |
13 Good |
20 Moderate |
11 Good |
15 Good |
10 Good |
12 Good |
| no2 | 21 Good |
22 Good |
21 Good |
21 Good |
19 Good |
32 Good |
17 Good |
34 Good |
| so2 | 1 Good |
1 Good |
1 Good |
2 Good |
3 Good |
4 Good |
2 Good |
4 Good |
| o3 | 49 Good |
51 Good |
33 Good |
20 Good |
35 Good |
26 Good |
54 Good |
21 Good |
| co | 170 Good |
164 Good |
130 Good |
175 Good |
146 Good |
158 Good |
105 Good |
159 Good |

| index | 2020-05 | 2020-04 | 2020-03 | 2020-02 | 2020-01 | 2019-12 | 2019-11 | 2019-09 | 2019-08 | 2019-07 | 2019-06 | 2019-05 | 2019-04 | 2019-03 | 2019-02 | 2019-01 | 2019-10 | 2018-12 | 2018-11 | 2018-10 | 2018-09 | 2018-08 | 2018-07 | 2018-06 | 2018-05 | 2018-04 | 2018-03 | 2018-02 | 2018-01 | 2017-10 | 2017-09 | 2017-12 |
|---|---|---|---|---|---|---|---|---|---|---|---|---|---|---|---|---|---|---|---|---|---|---|---|---|---|---|---|---|---|---|---|---|
| pm10 | 9.6 (Good) | 18 (Good) | 15 (Good) | 11 (Good) | 13 (Good) | 10 (Good) | 10 (Good) | 3.9 (Good) | 2.4 (Good) | 5.6 (Good) | 9.8 (Good) | 12 (Good) | 27 (Moderate) | 16 (Good) | 25 (Moderate) | 14 (Good) | 4.4 (Good) | 13 (Good) | 11 (Good) | 10 (Good) | 6.2 (Good) | 6.2 (Good) | 8.7 (Good) | 10 (Good) | 14 (Good) | 12 (Good) | 13 (Good) | 18 (Good) | 12 (Good) | 9 (Good) | 9.5 (Good) | - (Good) |
| no2 | 9.8 (Good) | 16 (Good) | 17 (Good) | 16 (Good) | 19 (Good) | 20 (Good) | 24 (Good) | 10 (Good) | 5.1 (Good) | 12 (Good) | 19 (Good) | 17 (Good) | 30 (Good) | 23 (Good) | 33 (Good) | 29 (Good) | 6.5 (Good) | 29 (Good) | 27 (Good) | 25 (Good) | 19 (Good) | 15 (Good) | 17 (Good) | 23 (Good) | 31 (Good) | 23 (Good) | 27 (Good) | 27 (Good) | - (Good) | 13 (Good) | 17 (Good) | - (Good) |
| o3 | 64 (Good) | 61 (Good) | 55 (Good) | 57 (Good) | 51 (Good) | 26 (Good) | 17 (Good) | - (Good) | - (Good) | 28 (Good) | 48 (Good) | 54 (Good) | 63 (Good) | 56 (Good) | 48 (Good) | 36 (Good) | 4.8 (Good) | 44 (Good) | 40 (Good) | 41 (Good) | 37 (Good) | 36 (Good) | 39 (Good) | 51 (Good) | 51 (Good) | 61 (Good) | 51 (Good) | 47 (Good) | - (Good) | 47 (Good) | 40 (Good) | - (Good) |
| pm25 | 5.6 (Good) | 12 (Good) | 8.6 (Good) | 6.7 (Good) | 8.1 (Good) | 5.4 (Good) | 4.7 (Good) | 1.8 (Good) | 0.55 (Good) | 3.2 (Good) | 7.2 (Good) | 9.1 (Good) | 20 (Moderate) | 9.1 (Good) | 15 (Moderate) | 10 (Good) | 1.2 (Good) | 10 (Good) | 9 (Good) | 8.5 (Good) | 3.8 (Good) | 4.5 (Good) | 6.8 (Good) | 7.3 (Good) | 11 (Good) | 10 (Good) | 10 (Good) | 15 (Moderate) | 9.4 (Good) | 6.3 (Good) | 6.8 (Good) | - (Good) |
| so2 | 1.8 (Good) | 2.4 (Good) | 3.7 (Good) | 4.9 (Good) | 2.4 (Good) | 1.2 (Good) | 0.83 (Good) | 0.29 (Good) | 0.17 (Good) | 0.73 (Good) | 0.72 (Good) | 0.89 (Good) | 7 (Good) | 10 (Good) | 5.5 (Good) | 2.6 (Good) | 0.09 (Good) | 1.6 (Good) | 0.65 (Good) | 1.3 (Good) | 0.47 (Good) | 1.1 (Good) | 5.1 (Good) | 6.1 (Good) | 12 (Good) | 1.5 (Good) | 2.5 (Good) | 2.6 (Good) | - (Good) | 1.3 (Good) | 1.1 (Good) | - (Good) |
| co | 0.26 (Good) | 0.34 (Good) | 0.32 (Good) | 0.29 (Good) | 0.32 (Good) | 0.34 (Good) | 0.34 (Good) | 0.14 (Good) | 0.03 (Good) | 0.15 (Good) | 0.23 (Good) | 0.28 (Good) | 0.46 (Good) | 0.35 (Good) | 0.47 (Good) | 0.4 (Good) | 0.03 (Good) | 0.4 (Good) | 0.32 (Good) | 0.33 (Good) | 0.3 (Good) | 0.24 (Good) | 0.34 (Good) | 0.34 (Good) | 0.32 (Good) | 0.43 (Good) | 0.48 (Good) | 0.42 (Good) | 0.39 (Good) | 0.38 (Good) | 0.41 (Good) | 0.34 (Good) |
Hijau dan taman di kota
Dublin City 76%
Pulau Man: 78% Britania Raya: 75% Belanda: 82% Belgia: 64% Kepulauan Faroe: 87%partikulat Matter PM 2.5
Dublin City 11 (Good)
Kenikmatan menghabiskan waktu di kota
Dublin City 72%
Pulau Man: 83% Britania Raya: 70% Belanda: 88% Belgia: 64% Kepulauan Faroe: 100%partikulat Matter PM10
Dublin City 16 (Good)
Polusi udara
Dublin City 33%
Pulau Man: 13% Britania Raya: 37% Belanda: 21% Belgia: 45% Kepulauan Faroe: 0%Pembuangan sampah
Dublin City 57%
Pulau Man: 78% Britania Raya: 60% Belanda: 79% Belgia: 54% Kepulauan Faroe: 88%Ketersediaan dan kualitas air minum
Dublin City 70%
Pulau Man: 88% Britania Raya: 75% Belanda: 92% Belgia: 70% Kepulauan Faroe: 98%Kebersihan dan kerasnya
Dublin City 46%
Pulau Man: 69% Britania Raya: 53% Belanda: 77% Belgia: 46% Kepulauan Faroe: 94%Kebisingan dan polusi cahaya
Dublin City 44%
Pulau Man: 12% Britania Raya: 47% Belanda: 31% Belgia: 54% Kepulauan Faroe: 21%Polusi air
Dublin City 40%
Pulau Man: 13% Britania Raya: 31% Belanda: 17% Belgia: 42% Kepulauan Faroe: 7,7%NO2 63 (Moderat)
nitrogen dioksida (NO2)PM10 20 (Bagus)
partikulat Matter (PM10) debu tersuspensiPM2,5 11 (Bagus)
partikulat Matter (PM 2.5) debuNO2 82 (Moderat)
nitrogen dioksida (NO2)PM10 22 (Moderat)
partikulat Matter (PM10) debu tersuspensiPM2,5 13 (Moderat)
partikulat Matter (PM 2.5) debuSO2 6 (Bagus)
sulfur dioksida (SO2)O3 0.72 (Bagus)
ozon (O3)PM2,5 4.9 (Bagus)
partikulat Matter (PM 2.5) debuPM10 7.5 (Bagus)
partikulat Matter (PM10) debu tersuspensiPM2,5 8.5 (Bagus)
partikulat Matter (PM 2.5) debuNO2 63 (Moderat)
nitrogen dioksida (NO2)PM10 13 (Bagus)
partikulat Matter (PM10) debu tersuspensiPM10 8.8 (Bagus)
partikulat Matter (PM10) debu tersuspensiPM2,5 5.3 (Bagus)
partikulat Matter (PM 2.5) debuCO 200 (Bagus)
karbon monoksida (CO)NO2 57 (Moderat)
nitrogen dioksida (NO2)SO2 4.7 (Bagus)
sulfur dioksida (SO2)IE001AP
| index | 2024-01-17 | 2024-01-16 | 2024-01-15 | 2024-01-14 | 2024-01-13 | 2024-01-12 | 2024-01-11 | 2024-01-10 |
|---|---|---|---|---|---|---|---|---|
| pm25 | 10 | 6.5 | 9.5 | 8.9 | 17 | 10 | 4.6 | 4.7 |
| pm10 | 14 | 11 | 16 | 11 | 20 | 16 | 10 | 11 |
| no2 | 38 | 25 | 36 | 19 | 24 | 23 | 26 | 26 |
Dublin Rathmines Wynnefield Road
| index | 2024-01-17 | 2024-01-16 | 2024-01-15 | 2024-01-14 | 2024-01-13 | 2024-01-12 | 2024-01-11 | 2024-01-10 |
|---|---|---|---|---|---|---|---|---|
| so2 | 3.9 | 2.8 | 3.1 | 2.7 | 2 | 1.5 | 1.7 | 1.9 |
| pm25 | 12 | 6.5 | 12 | 12 | 19 | 11 | 6.7 | 6.5 |
| pm10 | 14 | 9.5 | 17 | 14 | 21 | 15 | 14 | 15 |
| no2 | 35 | 13 | 32 | 17 | 23 | 25 | 23 | 19 |
| o3 | 21 | 54 | 26 | 35 | 20 | 33 | 51 | 49 |
IE002AP
| index | 2024-01-17 | 2024-01-16 | 2024-01-15 | 2024-01-14 | 2024-01-13 | 2024-01-12 | 2024-01-11 | 2024-01-10 |
|---|---|---|---|---|---|---|---|---|
| pm10 | 9.5 | 12 | 13 | 8.9 | 19 | 11 | 6.6 | 7.2 |
| pm25 | 7.7 | 6.7 | 9.2 | 7 | 17 | 8.1 | 3.3 | 3 |
IE0036A
| index | 2024-01-17 | 2024-01-16 | 2024-01-15 | 2024-01-14 | 2024-01-13 | 2024-01-12 | 2024-01-11 | 2024-01-10 |
|---|---|---|---|---|---|---|---|---|
| pm10 | 13 | 9.1 | 15 | 12 | 21 | 13 | 8.4 | 9.4 |
| pm25 | 10 | 5.7 | 10 | 9.9 | 20 | 10 | 4 | 4.5 |
| no2 | 28 | 13 | 27 | 14 | 17 | 16 | 15 | 15 |
IE003AP
| index | 2024-01-17 | 2024-01-16 | 2024-01-15 | 2024-01-14 | 2024-01-13 | 2024-01-12 | 2024-01-11 | 2024-01-10 |
|---|---|---|---|---|---|---|---|---|
| pm10 | 9.3 | 8.7 | 14 | 9 | 19 | 12 | 6.9 | 7.6 |
| pm25 | 7.2 | 5.9 | 10 | 7.2 | 18 | 8.9 | 3.3 | 3.4 |
Dublin Winetavern Street
| index | 2024-01-17 | 2024-01-16 | 2024-01-15 | 2024-01-14 | 2024-01-13 | 2024-01-12 | 2024-01-11 | 2024-01-10 |
|---|---|---|---|---|---|---|---|---|
| no2 | 36 | 18 | 33 | 24 | 22 | 18 | 24 | 22 |
| so2 | 3.1 | 1.3 | 4.2 | 2.3 | 1.9 | 0.87 | 0.93 | 1 |
| co | 159 | 105 | 158 | 146 | 175 | 130 | 164 | 170 |
IE001AP
| index | 2020-05 | 2020-04 | 2020-03 | 2020-02 | 2020-01 | 2019-12 | 2019-11 | 2019-09 | 2019-08 | 2019-07 | 2019-06 | 2019-05 | 2019-04 | 2019-03 | 2019-02 | 2019-01 |
|---|---|---|---|---|---|---|---|---|---|---|---|---|---|---|---|---|
| pm10 | 11 | 21 | 22 | 13 | 16 | 15 | 16 | 3.4 | 0.85 | 5.3 | 12 | 16 | 32 | 24 | 38 | 18 |
IE0028A
| index | 2020-05 | 2020-04 | 2020-03 | 2020-02 | 2020-01 | 2019-12 | 2019-11 | 2019-10 | 2019-07 | 2019-06 | 2019-05 | 2019-04 | 2019-03 | 2019-02 | 2019-01 | 2018-12 | 2018-11 | 2018-10 | 2018-09 | 2018-08 | 2018-07 | 2018-06 | 2018-05 | 2018-04 | 2018-03 | 2018-02 | 2018-01 | 2017-10 | 2017-09 |
|---|---|---|---|---|---|---|---|---|---|---|---|---|---|---|---|---|---|---|---|---|---|---|---|---|---|---|---|---|---|
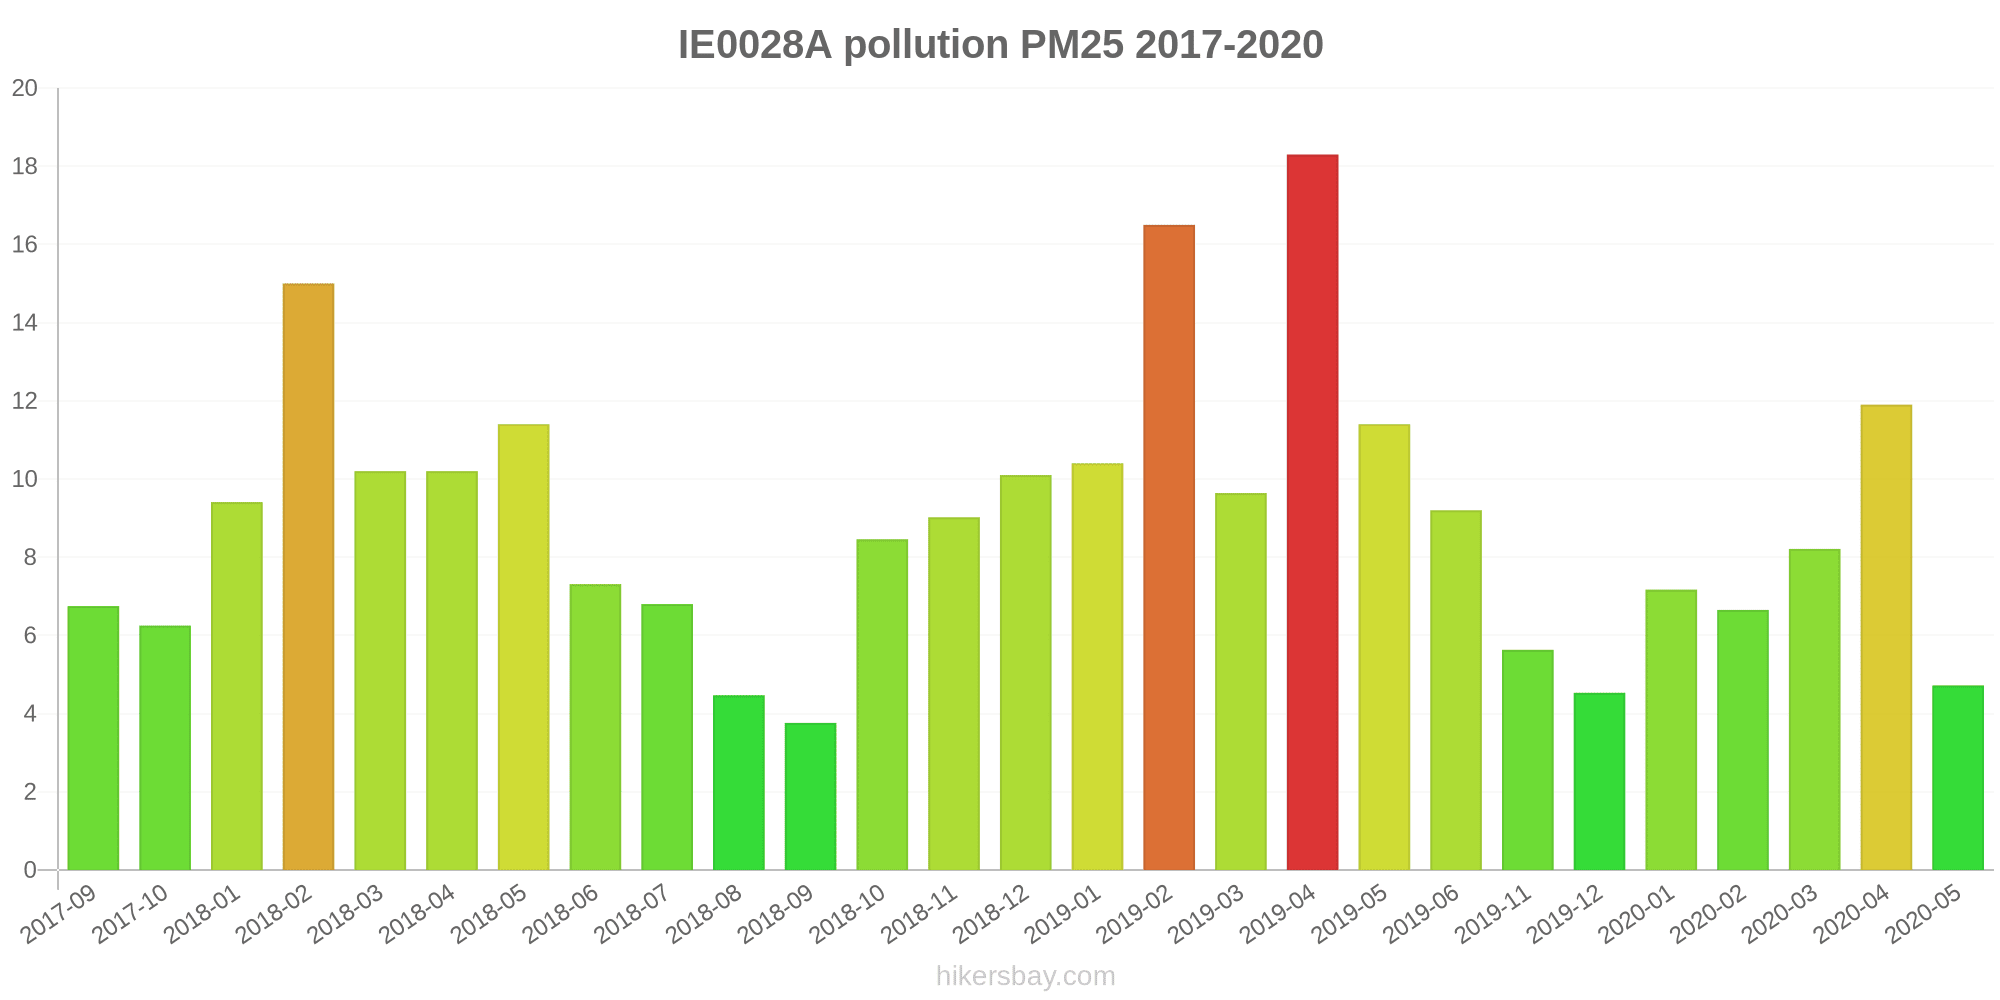
| pm25 | 4.7 | 12 | 8.2 | 6.7 | 7.2 | 4.5 | 5.6 | - | - | 9.2 | 11 | 18 | 9.6 | 17 | 10 | 10 | 9 | 8.5 | 3.8 | 4.5 | 6.8 | 7.3 | 11 | 10 | 10 | 15 | 9.4 | 6.3 | 6.8 |
| pm10 | 7.7 | 17 | 12 | 9.7 | 11 | 6.5 | 7.3 | - | - | 11 | 13 | 21 | 13 | 21 | 13 | 13 | 11 | 10 | 6.2 | 6.2 | 8.7 | 10 | 14 | 12 | 13 | 18 | 12 | 9 | 9.5 |
| so2 | 1.5 | 1.6 | 1.4 | 3.5 | 0.94 | 0.57 | 0.51 | 0.01 | - | 0.5 | 0.79 | 1.2 | 0.9 | 1.5 | 1.4 | 1.6 | 0.65 | 1.3 | 0.47 | 1.1 | 1.6 | 3.1 | 12 | 1.5 | 2.5 | 2.6 | - | 1.3 | 1.1 |
| no2 | 9.8 | 17 | 19 | 18 | 16 | 13 | 16 | 2.4 | 17 | 27 | 22 | 26 | 24 | 31 | 28 | 24 | 23 | 21 | 15 | 11 | 6.3 | 16 | 29 | 21 | 27 | 27 | - | 13 | 17 |
| o3 | 64 | 61 | 55 | 57 | 51 | 26 | 17 | 4.8 | 28 | 48 | 54 | 63 | 56 | 48 | 36 | 44 | 40 | 41 | 37 | 36 | 39 | 51 | 51 | 61 | 51 | 47 | - | 47 | 40 |
IE002AP
| index | 2020-05 | 2020-04 | 2020-03 | 2020-02 | 2020-01 | 2019-12 | 2019-11 | 2019-10 | 2019-09 | 2019-08 | 2019-07 | 2019-06 | 2019-05 | 2019-04 | 2019-03 | 2019-02 | 2019-01 |
|---|---|---|---|---|---|---|---|---|---|---|---|---|---|---|---|---|---|
| pm10 | 9.2 | 17 | 12 | 9.1 | 11 | 9.1 | 8.2 | 1.6 | 2.1 | 0.75 | 3.1 | 7.9 | 8.5 | 25 | 13 | 19 | 11 |
IE0036A
| index | 2020-05 | 2020-04 | 2020-03 | 2020-02 | 2020-01 | 2019-12 | 2019-11 | 2019-10 | 2019-09 | 2019-08 | 2019-07 | 2019-06 | 2019-05 | 2019-04 | 2019-03 | 2019-02 | 2019-01 |
|---|---|---|---|---|---|---|---|---|---|---|---|---|---|---|---|---|---|
| no2 | 7.8 | 14 | 14 | 12 | 17 | 18 | 23 | 15 | 9.8 | 8.3 | 7.4 | 11 | 6.2 | 27 | 15 | 29 | 24 |
| pm10 | 9.6 | 18 | 15 | 10 | 13 | 12 | 13 | 9.7 | 7.4 | 7 | 6.9 | 8.7 | 11 | 31 | 16 | 26 | 14 |
IE003AP
| index | 2020-05 | 2020-04 | 2020-03 | 2020-02 | 2020-01 | 2019-12 | 2019-11 | 2019-10 | 2019-09 | 2019-08 | 2019-07 | 2019-06 | 2019-05 | 2019-04 | 2019-03 | 2019-02 | 2019-01 |
|---|---|---|---|---|---|---|---|---|---|---|---|---|---|---|---|---|---|
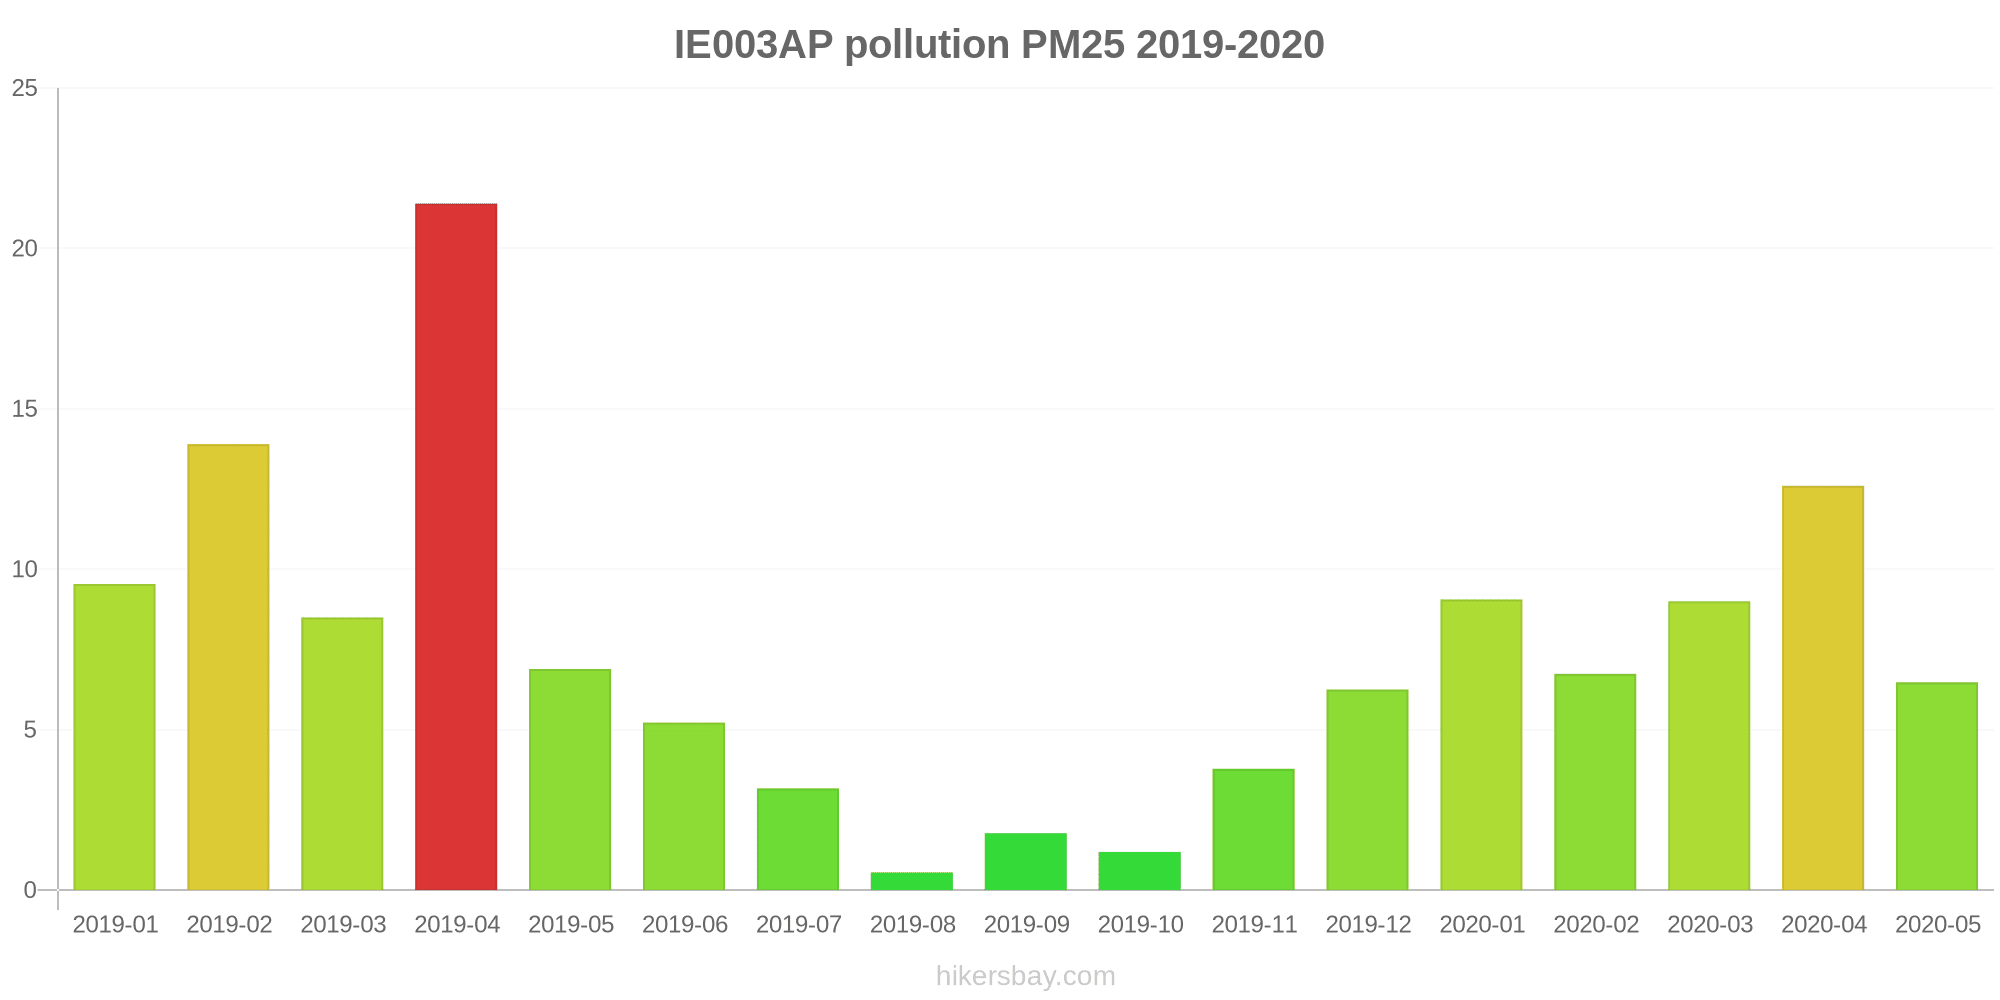
| pm25 | 6.5 | 13 | 9 | 6.7 | 9.1 | 6.3 | 3.8 | 1.2 | 1.8 | 0.55 | 3.2 | 5.2 | 6.9 | 21 | 8.5 | 14 | 9.5 |
| pm10 | 10 | 19 | 15 | 11 | 13 | 8.8 | 6.6 | 1.8 | 2.8 | 0.9 | 7.2 | 8.5 | 11 | 27 | 14 | 20 | 12 |
IE0098A
| index | 2020-05 | 2020-04 | 2020-03 | 2020-02 | 2020-01 | 2019-12 | 2019-11 | 2019-10 | 2019-09 | 2019-08 | 2019-07 | 2019-06 | 2019-05 | 2019-04 | 2019-03 | 2019-02 | 2019-01 | 2018-12 | 2018-11 | 2018-10 | 2018-09 | 2018-08 | 2018-07 | 2018-06 | 2018-05 | 2018-04 | 2018-03 | 2018-02 | 2018-01 | 2017-12 | 2017-10 | 2017-09 |
|---|---|---|---|---|---|---|---|---|---|---|---|---|---|---|---|---|---|---|---|---|---|---|---|---|---|---|---|---|---|---|---|---|
| co | 0.26 | 0.34 | 0.32 | 0.29 | 0.32 | 0.34 | 0.34 | 0.03 | 0.14 | 0.03 | 0.15 | 0.23 | 0.28 | 0.46 | 0.35 | 0.47 | 0.4 | 0.4 | 0.32 | 0.33 | 0.3 | 0.24 | 0.34 | 0.34 | 0.32 | 0.43 | 0.48 | 0.42 | 0.39 | 0.34 | 0.38 | 0.41 |
| no2 | 12 | 17 | 19 | 19 | 24 | 28 | 31 | 2.5 | 10 | 1.9 | 10 | 19 | 23 | 36 | 30 | 39 | 36 | 34 | 30 | 29 | 24 | 19 | 27 | 30 | 32 | 26 | - | - | - | - | - | - |
| so2 | 2.1 | 3.2 | 5.9 | 6.3 | 3.8 | 1.8 | 1.2 | 0.16 | 0.29 | 0.17 | 0.73 | 0.93 | 0.99 | 13 | 19 | 9.4 | 3.8 | - | - | - | - | - | 8.5 | 9.1 | - | - | - | - | - | - | - | - |