Polusi udara di North East: indeks kualitas udara real-time dan siaga asap.
Perkiraan kualitas polusi dan udara untuk North East. Hari ini Rabu, 13 Mei 2026. Nilai polusi udara berikut telah tercatat untuk North East:- partikulat Matter (PM10) debu tersuspensi - 368 (Sangat buruk berbahaya)
- sulfur dioksida (SO2) - 6 (Bagus)
- partikulat Matter (PM 2.5) debu - 205 (Sangat buruk berbahaya)
- karbon monoksida (CO) - 877 (Bagus)
- nitrogen dioksida (NO2) - 31 (Bagus)
- ozon (O3) - 3 (Bagus)

Apa kualitas udara di North East hari ini? Apakah udara tercemar di North East?. Apakah ada Smog?
Apa tingkat PM10 hari ini di North East? (partikulat Matter (PM10) debu tersuspensi)
Level saat ini dari partikulat Matter PM10 di North East adalah:
368 (Sangat buruk berbahaya)
Nilai PM10 tertinggi biasanya terjadi di bulan: 391 (November 2018).
Nilai terendah dari partikulat PM10 pencemaran North East biasanya dicatat di: Agustus (77).
Apa tingkat polusi SO2? (sulfur dioksida (SO2))
6 (Bagus)
Apa tingkat saat PM 2,5 in North East? (partikulat Matter (PM 2.5) debu)
Hari ini PM 2.5 tingkat:
205 (Sangat buruk berbahaya)
Sebagai perbandingan, tingkat tertinggi PM 2,5 in North East dalam 7 hari terakhir adalah: 218 (Senin, 31 Oktober 2022) dan Terendah: 218 (Senin, 31 Oktober 2022).
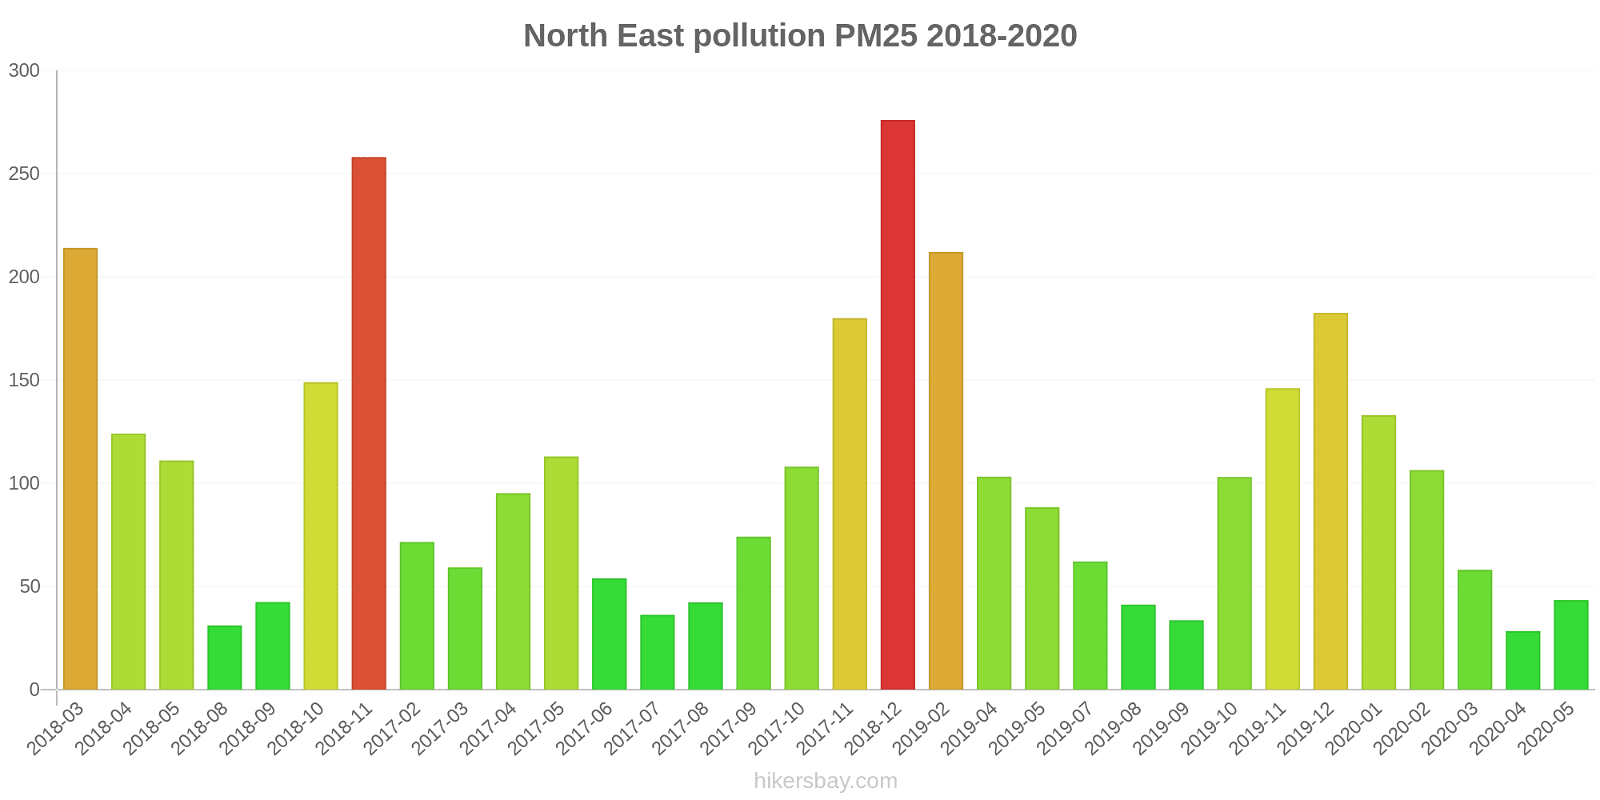
Nilai tertinggi PM 2.5 direkam: 276 (Desember 2018).
Tingkat terendah dari partikulat Matter PM 2.5 polusi terjadi di bulan: April (28).
Seberapa tinggi tingkat CO? (karbon monoksida (CO))
877 (Bagus)
Seberapa tinggi tingkat NO2? (nitrogen dioksida (NO2))
31 (Bagus)
Bagaimana tingkat O3 hari ini di North East? (ozon (O3))
3 (Bagus)
Data saat ini Senin, 31 Oktober 2022 00.45
PM10 368 (Sangat buruk berbahaya)
SO2 6 (Bagus)
PM2,5 205 (Sangat buruk berbahaya)
CO 877 (Bagus)
NO2 31 (Bagus)
O3 3 (Bagus)
Data tentang polusi udara dari beberapa hari terakhir di North East
index
2022-10-31
pm10
375
Very bad Hazardous
so2
6
Good
pm25
218
Very bad Hazardous
co
920
Good
no2
30
Good
o3
3
Good
data source »
Polusi udara di North East dari Maret 2018 ke Mei 2020
index
2020-05
2020-04
2020-03
2020-02
2020-01
2019-12
2019-11
2019-10
2019-09
2019-08
2019-07
2019-05
2019-04
2019-02
2018-12
2017-11
2017-10
2017-09
2017-08
2017-07
2017-06
2017-05
2017-04
2017-03
2017-02
2017-01
2016-12
2016-11
2016-10
2016-09
2016-08
2016-07
2016-06
2016-05
2016-04
2018-11
2018-10
2018-09
2018-08
2018-05
2018-04
2018-03
pm25
43 (Unhealthy for Sensitive Groups)
28 (Moderate)
58 (Unhealthy)
106 (Very Unhealthy)
133 (Very bad Hazardous)
183 (Very bad Hazardous)
146 (Very bad Hazardous)
103 (Very Unhealthy)
34 (Moderate)
41 (Unhealthy for Sensitive Groups)
62 (Unhealthy)
88 (Very Unhealthy)
103 (Very Unhealthy)
212 (Very bad Hazardous)
276 (Very bad Hazardous)
180 (Very bad Hazardous)
108 (Very Unhealthy)
74 (Unhealthy)
42 (Unhealthy for Sensitive Groups)
36 (Unhealthy for Sensitive Groups)
54 (Unhealthy for Sensitive Groups)
113 (Very bad Hazardous)
95 (Very Unhealthy)
59 (Unhealthy)
72 (Unhealthy)
- (Good)
- (Good)
- (Good)
- (Good)
- (Good)
- (Good)
- (Good)
- (Good)
- (Good)
- (Good)
258 (Very bad Hazardous)
149 (Very bad Hazardous)
42 (Unhealthy for Sensitive Groups)
31 (Moderate)
111 (Very bad Hazardous)
124 (Very bad Hazardous)
214 (Very bad Hazardous)
no2
26 (Good)
19 (Good)
32 (Good)
50 (Moderate)
50 (Moderate)
51 (Moderate)
58 (Moderate)
43 (Moderate)
22 (Good)
24 (Good)
29 (Good)
30 (Good)
39 (Good)
65 (Moderate)
65 (Moderate)
70 (Moderate)
62 (Moderate)
28 (Good)
49 (Moderate)
23 (Good)
28 (Good)
55 (Moderate)
62 (Moderate)
63 (Moderate)
75 (Moderate)
51 (Moderate)
86 (Moderate)
107 (Unhealthy for Sensitive Groups)
- (Good)
- (Good)
- (Good)
- (Good)
11 (Good)
22 (Good)
- (Good)
57 (Moderate)
42 (Moderate)
20 (Good)
17 (Good)
13 (Good)
16 (Good)
26 (Good)
so2
6.4 (Good)
13 (Good)
12 (Good)
15 (Good)
13 (Good)
16 (Good)
14 (Good)
15 (Good)
11 (Good)
8.5 (Good)
9.2 (Good)
18 (Good)
16 (Good)
14 (Good)
17 (Good)
13 (Good)
18 (Good)
9.4 (Good)
15 (Good)
14 (Good)
9.3 (Good)
- (Good)
- (Good)
- (Good)
- (Good)
- (Good)
- (Good)
- (Good)
- (Good)
- (Good)
- (Good)
- (Good)
- (Good)
- (Good)
- (Good)
12 (Good)
13 (Good)
6.5 (Good)
6 (Good)
2.9 (Good)
8.3 (Good)
10 (Good)
co
374 (Good)
406 (Good)
427 (Good)
463 (Good)
1.1 (Good)
1.1 (Good)
1.1 (Good)
441 (Good)
250 (Good)
379 (Good)
356 (Good)
441 (Good)
375 (Good)
1.4 (Good)
2 (Good)
1 (Good)
1 (Good)
847 (Good)
650 (Good)
640 (Good)
720 (Good)
1 (Good)
850 (Good)
693 (Good)
916 (Good)
1 (Good)
1 (Good)
1 (Good)
863 (Good)
528 (Good)
673 (Good)
575 (Good)
296 (Good)
503 (Good)
655 (Good)
2.2 (Good)
2.5 (Good)
1.2 (Good)
1 (Good)
0.7 (Good)
28 (Good)
52 (Good)
pm10
110 (Very Unhealthy)
104 (Unhealthy)
119 (Very Unhealthy)
208 (Very bad Hazardous)
231 (Very bad Hazardous)
309 (Very bad Hazardous)
259 (Very bad Hazardous)
235 (Very bad Hazardous)
87 (Unhealthy)
81 (Unhealthy)
139 (Very Unhealthy)
244 (Very bad Hazardous)
323 (Very bad Hazardous)
330 (Very bad Hazardous)
374 (Very bad Hazardous)
- (Good)
- (Good)
- (Good)
- (Good)
- (Good)
- (Good)
- (Good)
- (Good)
- (Good)
- (Good)
- (Good)
- (Good)
- (Good)
- (Good)
- (Good)
- (Good)
- (Good)
- (Good)
- (Good)
- (Good)
391 (Very bad Hazardous)
306 (Very bad Hazardous)
111 (Very Unhealthy)
77 (Unhealthy for Sensitive Groups)
213 (Very bad Hazardous)
293 (Very bad Hazardous)
240 (Very bad Hazardous)
o3
95 (Moderate)
23 (Good)
61 (Good)
59 (Good)
18 (Good)
28 (Good)
37 (Good)
55 (Good)
30 (Good)
24 (Good)
30 (Good)
62 (Good)
49 (Good)
42 (Good)
31 (Good)
- (Good)
- (Good)
- (Good)
- (Good)
- (Good)
- (Good)
- (Good)
- (Good)
- (Good)
- (Good)
- (Good)
- (Good)
- (Good)
- (Good)
- (Good)
- (Good)
- (Good)
- (Good)
- (Good)
- (Good)
46 (Good)
51 (Good)
26 (Good)
34 (Good)
133 (Unhealthy for Sensitive Groups)
127 (Unhealthy for Sensitive Groups)
82 (Moderate)
data source »
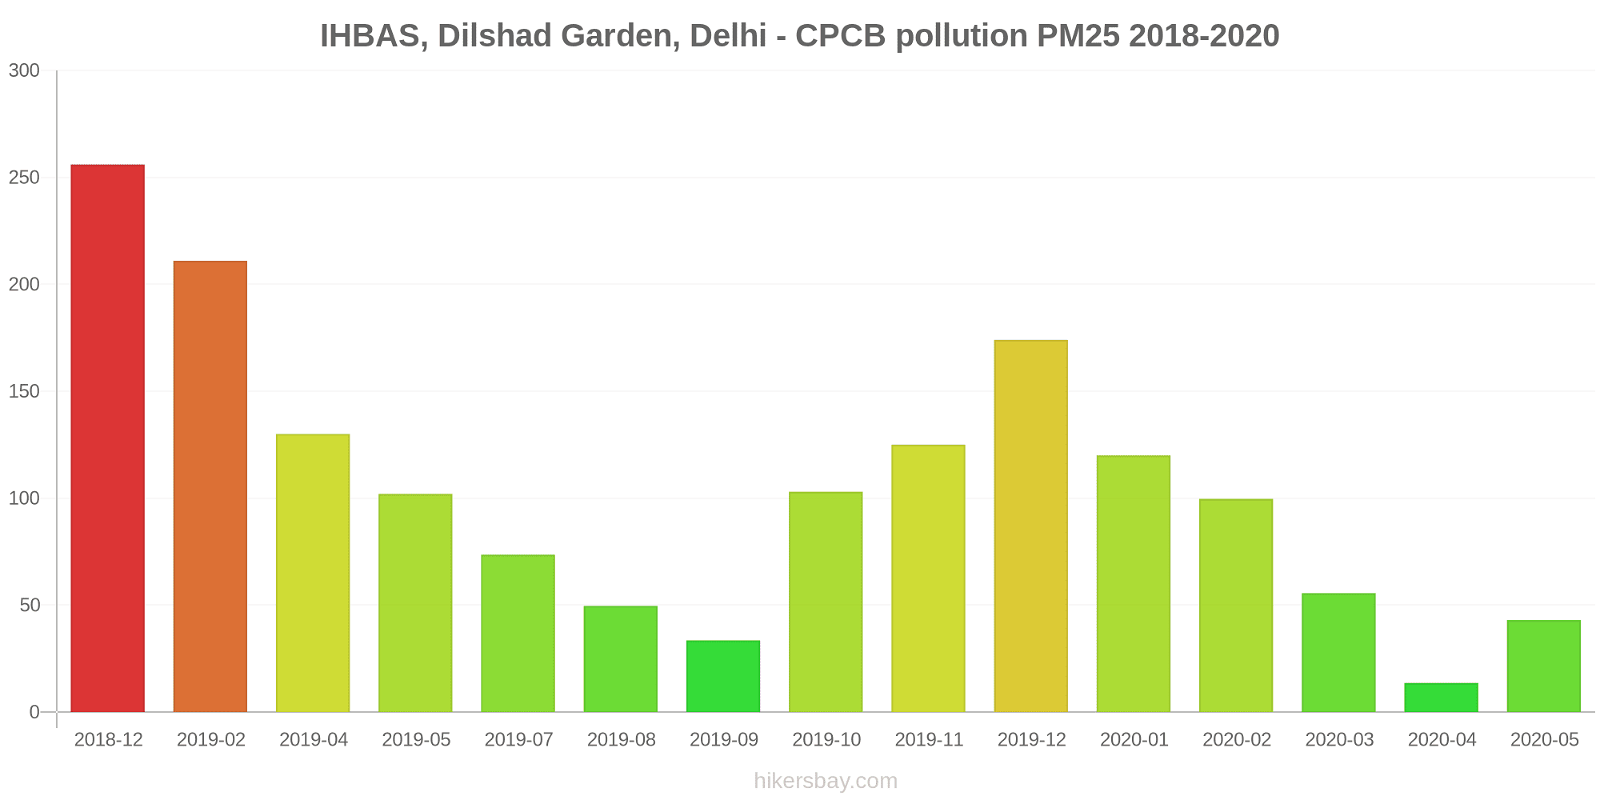
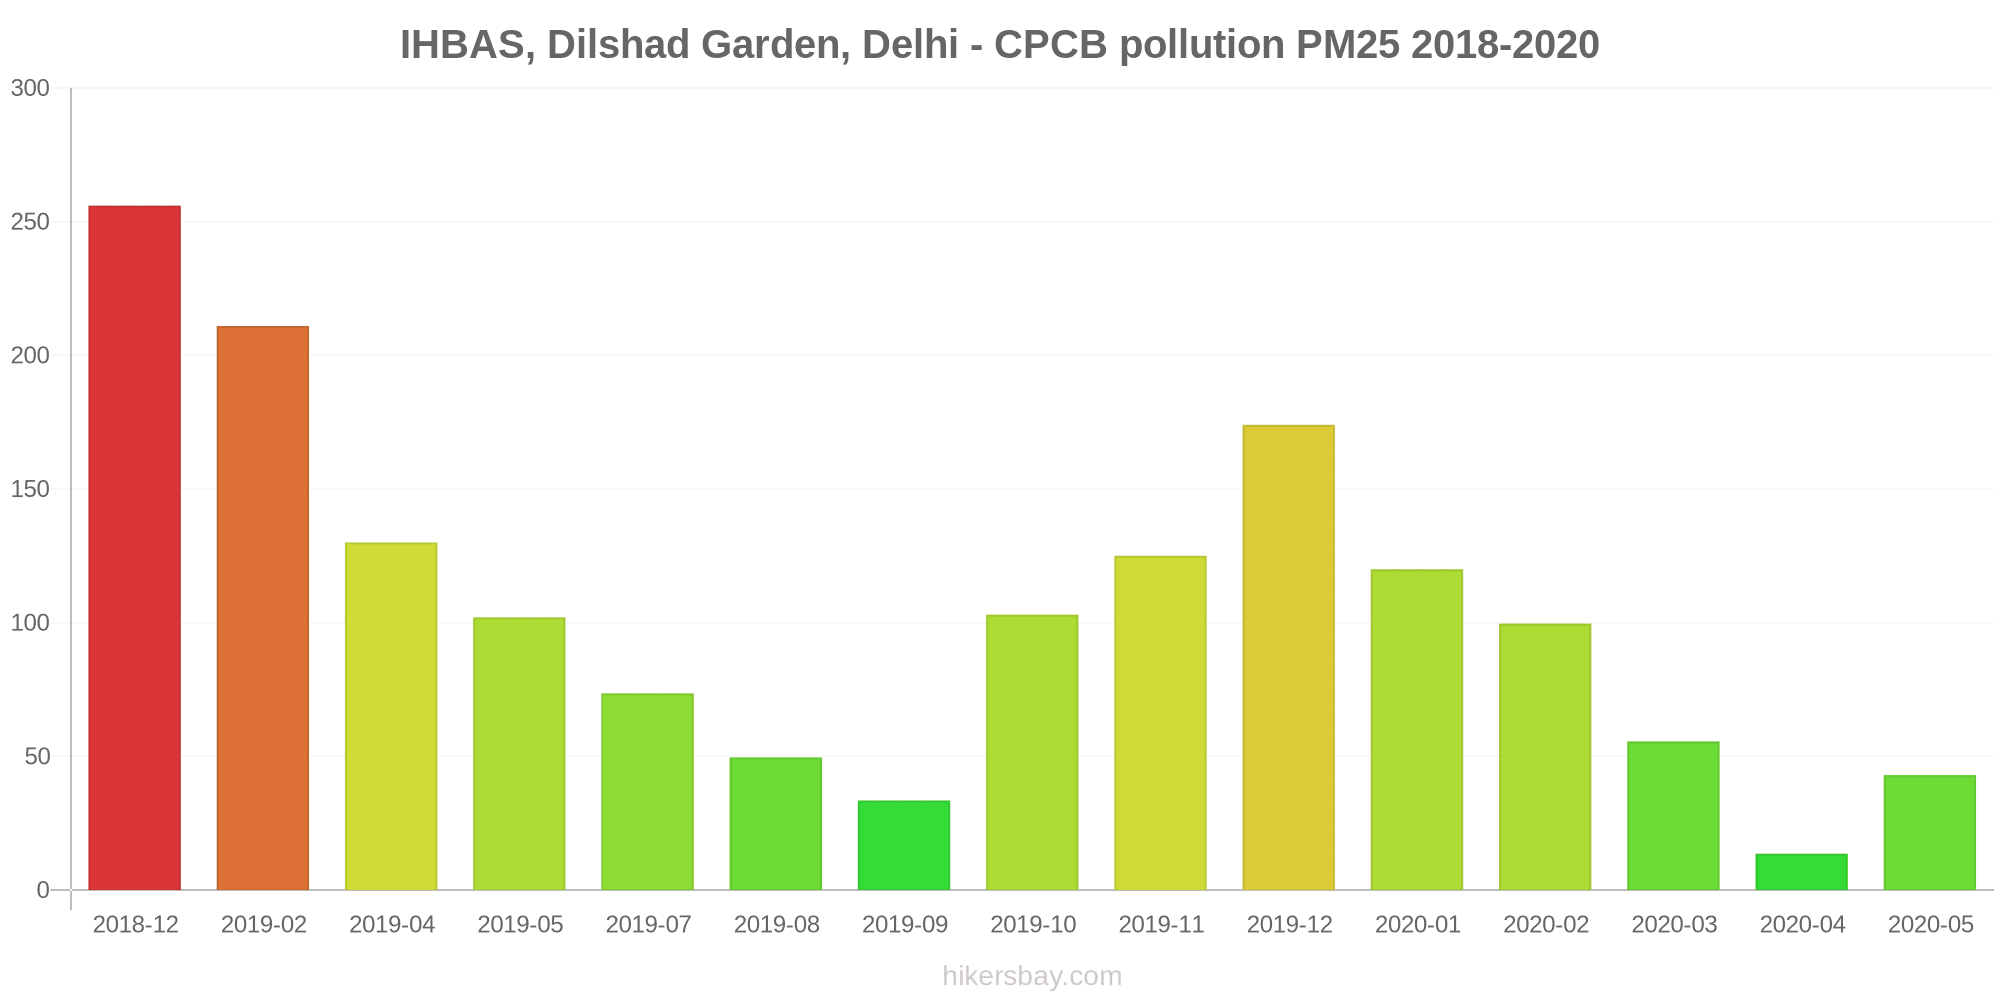
IHBAS, Dilshad Garden,New Delhi - CPCB
Senin, 31 Oktober 2022 01.45
PM10 310 (Sangat buruk berbahaya)
partikulat Matter (PM10) debu tersuspensi
SO2 5.9 (Bagus)
sulfur dioksida (SO2)
PM2,5 100 (Sangat tidak sehat)
partikulat Matter (PM 2.5) debu
CO 1750 (Bagus)
karbon monoksida (CO)
NO2 11 (Bagus)
nitrogen dioksida (NO2)
O3 1.5 (Bagus)
ozon (O3)
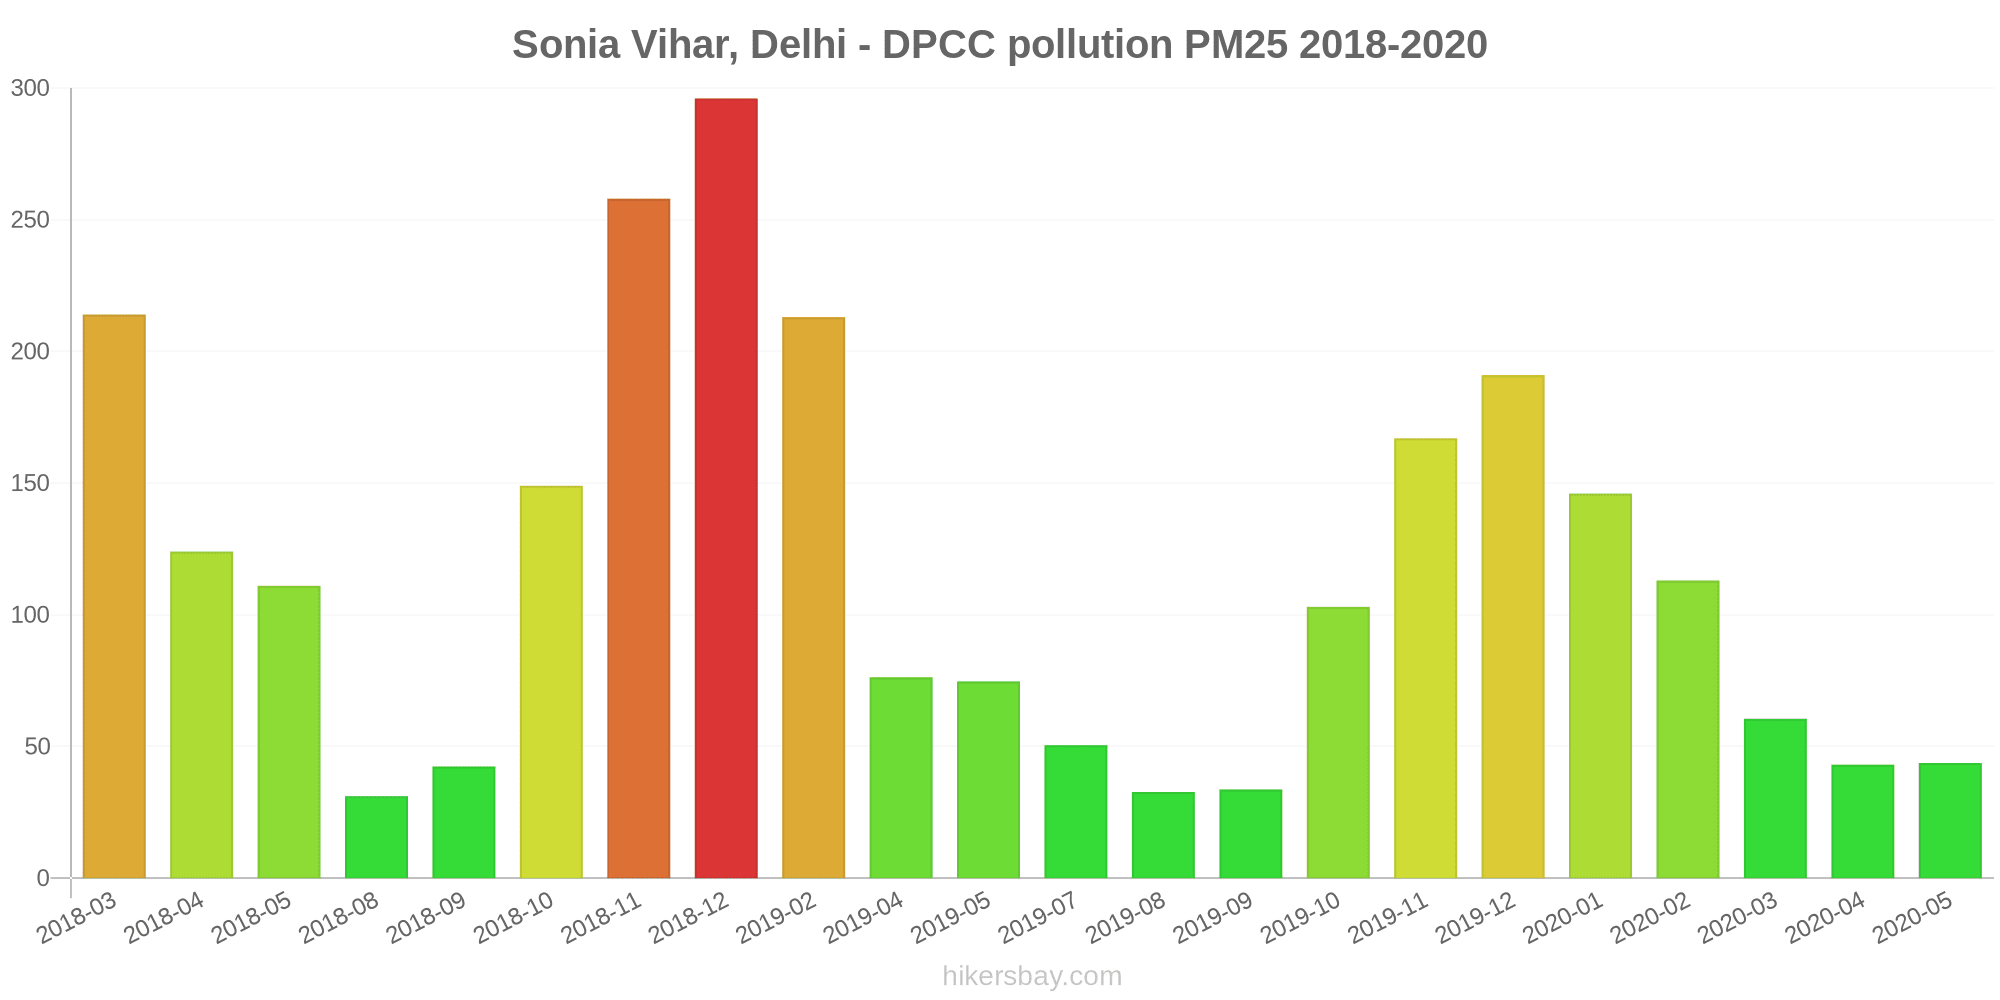
Sonia Vihar, Delhi - DPCC
Senin, 31 Oktober 2022 00.45
NO2 50 (Moderat)
nitrogen dioksida (NO2)
PM2,5 310 (Sangat buruk berbahaya)
partikulat Matter (PM 2.5) debu
PM10 427 (Sangat buruk berbahaya)
partikulat Matter (PM10) debu tersuspensi
O3 3.8 (Bagus)
ozon (O3)
CO 4.2 (Bagus)
karbon monoksida (CO)
SO2 6 (Bagus)
sulfur dioksida (SO2)
IHBAS, Dilshad Garden,New Delhi - CPCB
index
2022-10-31
pm10
323
so2
5.9
pm25
127
co
1835
no2
11
o3
1.4
Sonia Vihar, Delhi - DPCC
index
2022-10-31
no2
50
pm25
310
pm10
427
o3
3.8
co
4.2
so2
6
IHBAS, Dilshad Garden, Delhi - CPCB
2018-12 2020-05
index
2020-05
2020-04
2020-03
2020-02
2020-01
2019-12
2019-11
2019-10
2019-09
2019-08
2019-07
2019-05
2019-04
2019-02
2018-12
pm25
43
14
56
100
120
174
125
103
34
50
74
102
130
211
256
no2
26
17
31
55
60
64
68
55
29
27
33
30
41
58
73
so2
6.4
14
12
16
17
23
18
18
11
8.6
9.2
19
12
13
25
co
747
811
853
924
1
1
1
880
499
756
711
880
749
1
1
IHBAS
index
2017-11
2017-10
2017-09
2017-08
2017-07
2017-06
2017-05
2017-04
2017-03
2017-02
2017-01
2016-12
2016-11
2016-10
2016-09
2016-08
2016-07
2016-06
2016-05
2016-04
co
1
1
847
650
640
720
1
850
693
916
1
1
1
863
528
673
575
296
503
655
no2
70
62
28
49
23
28
55
62
63
75
51
86
107
-
-
-
-
11
22
-
pm25
180
108
74
42
36
54
113
95
59
72
-
-
-
-
-
-
-
-
-
-
so2
13
18
9.4
15
14
9.3
-
-
-
-
-
-
-
-
-
-
-
-
-
-
Sonia Vihar, Delhi - DPCC
2018-03 2020-05

index
2020-05
2020-04
2020-03
2020-02
2020-01
2019-12
2019-11
2019-10
2019-09
2019-08
2019-07
2019-05
2019-04
2019-02
2018-12
2018-11
2018-10
2018-09
2018-08
2018-05
2018-04
2018-03
pm25
44
43
61
113
146
191
167
103
34
33
51
75
76
213
296
258
149
42
31
111
124
214
pm10
110
104
119
208
231
309
259
235
87
81
139
244
323
330
374
391
306
111
77
213
293
240
no2
-
21
33
46
41
38
48
31
16
20
24
29
38
72
57
57
42
20
17
13
16
26
so2
-
12
12
13
8.5
8
11
12
11
8.4
9.2
17
20
16
9.8
12
13
6.5
6
2.9
8.3
10
co
1.1
0.81
0.89
1.1
1.2
1.3
1.3
1.1
1.3
1.3
1.6
1.3
1.2
1.8
3.1
2.2
2.5
1.2
1
0.7
28
52
o3
95
23
61
59
18
28
37
55
30
24
30
62
49
42
31
46
51
26
34
133
127
82
* Pollution data source:
https://openaq.org
(caaqm)
The data is licensed under CC-By 4.0
PM10 368 (Sangat buruk berbahaya)
SO2 6 (Bagus)
PM2,5 205 (Sangat buruk berbahaya)
CO 877 (Bagus)
NO2 31 (Bagus)
O3 3 (Bagus)
Data tentang polusi udara dari beberapa hari terakhir di North East
| index | 2022-10-31 |
|---|---|
| pm10 | 375 Very bad Hazardous |
| so2 | 6 Good |
| pm25 | 218 Very bad Hazardous |
| co | 920 Good |
| no2 | 30 Good |
| o3 | 3 Good |

| index | 2020-05 | 2020-04 | 2020-03 | 2020-02 | 2020-01 | 2019-12 | 2019-11 | 2019-10 | 2019-09 | 2019-08 | 2019-07 | 2019-05 | 2019-04 | 2019-02 | 2018-12 | 2017-11 | 2017-10 | 2017-09 | 2017-08 | 2017-07 | 2017-06 | 2017-05 | 2017-04 | 2017-03 | 2017-02 | 2017-01 | 2016-12 | 2016-11 | 2016-10 | 2016-09 | 2016-08 | 2016-07 | 2016-06 | 2016-05 | 2016-04 | 2018-11 | 2018-10 | 2018-09 | 2018-08 | 2018-05 | 2018-04 | 2018-03 |
|---|---|---|---|---|---|---|---|---|---|---|---|---|---|---|---|---|---|---|---|---|---|---|---|---|---|---|---|---|---|---|---|---|---|---|---|---|---|---|---|---|---|---|
| pm25 | 43 (Unhealthy for Sensitive Groups) | 28 (Moderate) | 58 (Unhealthy) | 106 (Very Unhealthy) | 133 (Very bad Hazardous) | 183 (Very bad Hazardous) | 146 (Very bad Hazardous) | 103 (Very Unhealthy) | 34 (Moderate) | 41 (Unhealthy for Sensitive Groups) | 62 (Unhealthy) | 88 (Very Unhealthy) | 103 (Very Unhealthy) | 212 (Very bad Hazardous) | 276 (Very bad Hazardous) | 180 (Very bad Hazardous) | 108 (Very Unhealthy) | 74 (Unhealthy) | 42 (Unhealthy for Sensitive Groups) | 36 (Unhealthy for Sensitive Groups) | 54 (Unhealthy for Sensitive Groups) | 113 (Very bad Hazardous) | 95 (Very Unhealthy) | 59 (Unhealthy) | 72 (Unhealthy) | - (Good) | - (Good) | - (Good) | - (Good) | - (Good) | - (Good) | - (Good) | - (Good) | - (Good) | - (Good) | 258 (Very bad Hazardous) | 149 (Very bad Hazardous) | 42 (Unhealthy for Sensitive Groups) | 31 (Moderate) | 111 (Very bad Hazardous) | 124 (Very bad Hazardous) | 214 (Very bad Hazardous) |
| no2 | 26 (Good) | 19 (Good) | 32 (Good) | 50 (Moderate) | 50 (Moderate) | 51 (Moderate) | 58 (Moderate) | 43 (Moderate) | 22 (Good) | 24 (Good) | 29 (Good) | 30 (Good) | 39 (Good) | 65 (Moderate) | 65 (Moderate) | 70 (Moderate) | 62 (Moderate) | 28 (Good) | 49 (Moderate) | 23 (Good) | 28 (Good) | 55 (Moderate) | 62 (Moderate) | 63 (Moderate) | 75 (Moderate) | 51 (Moderate) | 86 (Moderate) | 107 (Unhealthy for Sensitive Groups) | - (Good) | - (Good) | - (Good) | - (Good) | 11 (Good) | 22 (Good) | - (Good) | 57 (Moderate) | 42 (Moderate) | 20 (Good) | 17 (Good) | 13 (Good) | 16 (Good) | 26 (Good) |
| so2 | 6.4 (Good) | 13 (Good) | 12 (Good) | 15 (Good) | 13 (Good) | 16 (Good) | 14 (Good) | 15 (Good) | 11 (Good) | 8.5 (Good) | 9.2 (Good) | 18 (Good) | 16 (Good) | 14 (Good) | 17 (Good) | 13 (Good) | 18 (Good) | 9.4 (Good) | 15 (Good) | 14 (Good) | 9.3 (Good) | - (Good) | - (Good) | - (Good) | - (Good) | - (Good) | - (Good) | - (Good) | - (Good) | - (Good) | - (Good) | - (Good) | - (Good) | - (Good) | - (Good) | 12 (Good) | 13 (Good) | 6.5 (Good) | 6 (Good) | 2.9 (Good) | 8.3 (Good) | 10 (Good) |
| co | 374 (Good) | 406 (Good) | 427 (Good) | 463 (Good) | 1.1 (Good) | 1.1 (Good) | 1.1 (Good) | 441 (Good) | 250 (Good) | 379 (Good) | 356 (Good) | 441 (Good) | 375 (Good) | 1.4 (Good) | 2 (Good) | 1 (Good) | 1 (Good) | 847 (Good) | 650 (Good) | 640 (Good) | 720 (Good) | 1 (Good) | 850 (Good) | 693 (Good) | 916 (Good) | 1 (Good) | 1 (Good) | 1 (Good) | 863 (Good) | 528 (Good) | 673 (Good) | 575 (Good) | 296 (Good) | 503 (Good) | 655 (Good) | 2.2 (Good) | 2.5 (Good) | 1.2 (Good) | 1 (Good) | 0.7 (Good) | 28 (Good) | 52 (Good) |
| pm10 | 110 (Very Unhealthy) | 104 (Unhealthy) | 119 (Very Unhealthy) | 208 (Very bad Hazardous) | 231 (Very bad Hazardous) | 309 (Very bad Hazardous) | 259 (Very bad Hazardous) | 235 (Very bad Hazardous) | 87 (Unhealthy) | 81 (Unhealthy) | 139 (Very Unhealthy) | 244 (Very bad Hazardous) | 323 (Very bad Hazardous) | 330 (Very bad Hazardous) | 374 (Very bad Hazardous) | - (Good) | - (Good) | - (Good) | - (Good) | - (Good) | - (Good) | - (Good) | - (Good) | - (Good) | - (Good) | - (Good) | - (Good) | - (Good) | - (Good) | - (Good) | - (Good) | - (Good) | - (Good) | - (Good) | - (Good) | 391 (Very bad Hazardous) | 306 (Very bad Hazardous) | 111 (Very Unhealthy) | 77 (Unhealthy for Sensitive Groups) | 213 (Very bad Hazardous) | 293 (Very bad Hazardous) | 240 (Very bad Hazardous) |
| o3 | 95 (Moderate) | 23 (Good) | 61 (Good) | 59 (Good) | 18 (Good) | 28 (Good) | 37 (Good) | 55 (Good) | 30 (Good) | 24 (Good) | 30 (Good) | 62 (Good) | 49 (Good) | 42 (Good) | 31 (Good) | - (Good) | - (Good) | - (Good) | - (Good) | - (Good) | - (Good) | - (Good) | - (Good) | - (Good) | - (Good) | - (Good) | - (Good) | - (Good) | - (Good) | - (Good) | - (Good) | - (Good) | - (Good) | - (Good) | - (Good) | 46 (Good) | 51 (Good) | 26 (Good) | 34 (Good) | 133 (Unhealthy for Sensitive Groups) | 127 (Unhealthy for Sensitive Groups) | 82 (Moderate) |
PM10 310 (Sangat buruk berbahaya)
partikulat Matter (PM10) debu tersuspensiSO2 5.9 (Bagus)
sulfur dioksida (SO2)PM2,5 100 (Sangat tidak sehat)
partikulat Matter (PM 2.5) debuCO 1750 (Bagus)
karbon monoksida (CO)NO2 11 (Bagus)
nitrogen dioksida (NO2)O3 1.5 (Bagus)
ozon (O3)NO2 50 (Moderat)
nitrogen dioksida (NO2)PM2,5 310 (Sangat buruk berbahaya)
partikulat Matter (PM 2.5) debuPM10 427 (Sangat buruk berbahaya)
partikulat Matter (PM10) debu tersuspensiO3 3.8 (Bagus)
ozon (O3)CO 4.2 (Bagus)
karbon monoksida (CO)SO2 6 (Bagus)
sulfur dioksida (SO2)IHBAS, Dilshad Garden,New Delhi - CPCB
| index | 2022-10-31 |
|---|---|
| pm10 | 323 |
| so2 | 5.9 |
| pm25 | 127 |
| co | 1835 |
| no2 | 11 |
| o3 | 1.4 |
Sonia Vihar, Delhi - DPCC
| index | 2022-10-31 |
|---|---|
| no2 | 50 |
| pm25 | 310 |
| pm10 | 427 |
| o3 | 3.8 |
| co | 4.2 |
| so2 | 6 |
IHBAS, Dilshad Garden, Delhi - CPCB
| index | 2020-05 | 2020-04 | 2020-03 | 2020-02 | 2020-01 | 2019-12 | 2019-11 | 2019-10 | 2019-09 | 2019-08 | 2019-07 | 2019-05 | 2019-04 | 2019-02 | 2018-12 |
|---|---|---|---|---|---|---|---|---|---|---|---|---|---|---|---|
| pm25 | 43 | 14 | 56 | 100 | 120 | 174 | 125 | 103 | 34 | 50 | 74 | 102 | 130 | 211 | 256 |
| no2 | 26 | 17 | 31 | 55 | 60 | 64 | 68 | 55 | 29 | 27 | 33 | 30 | 41 | 58 | 73 |
| so2 | 6.4 | 14 | 12 | 16 | 17 | 23 | 18 | 18 | 11 | 8.6 | 9.2 | 19 | 12 | 13 | 25 |
| co | 747 | 811 | 853 | 924 | 1 | 1 | 1 | 880 | 499 | 756 | 711 | 880 | 749 | 1 | 1 |
IHBAS
| index | 2017-11 | 2017-10 | 2017-09 | 2017-08 | 2017-07 | 2017-06 | 2017-05 | 2017-04 | 2017-03 | 2017-02 | 2017-01 | 2016-12 | 2016-11 | 2016-10 | 2016-09 | 2016-08 | 2016-07 | 2016-06 | 2016-05 | 2016-04 |
|---|---|---|---|---|---|---|---|---|---|---|---|---|---|---|---|---|---|---|---|---|
| co | 1 | 1 | 847 | 650 | 640 | 720 | 1 | 850 | 693 | 916 | 1 | 1 | 1 | 863 | 528 | 673 | 575 | 296 | 503 | 655 |
| no2 | 70 | 62 | 28 | 49 | 23 | 28 | 55 | 62 | 63 | 75 | 51 | 86 | 107 | - | - | - | - | 11 | 22 | - |
| pm25 | 180 | 108 | 74 | 42 | 36 | 54 | 113 | 95 | 59 | 72 | - | - | - | - | - | - | - | - | - | - |
| so2 | 13 | 18 | 9.4 | 15 | 14 | 9.3 | - | - | - | - | - | - | - | - | - | - | - | - | - | - |
Sonia Vihar, Delhi - DPCC
| index | 2020-05 | 2020-04 | 2020-03 | 2020-02 | 2020-01 | 2019-12 | 2019-11 | 2019-10 | 2019-09 | 2019-08 | 2019-07 | 2019-05 | 2019-04 | 2019-02 | 2018-12 | 2018-11 | 2018-10 | 2018-09 | 2018-08 | 2018-05 | 2018-04 | 2018-03 |
|---|---|---|---|---|---|---|---|---|---|---|---|---|---|---|---|---|---|---|---|---|---|---|
| pm25 | 44 | 43 | 61 | 113 | 146 | 191 | 167 | 103 | 34 | 33 | 51 | 75 | 76 | 213 | 296 | 258 | 149 | 42 | 31 | 111 | 124 | 214 |
| pm10 | 110 | 104 | 119 | 208 | 231 | 309 | 259 | 235 | 87 | 81 | 139 | 244 | 323 | 330 | 374 | 391 | 306 | 111 | 77 | 213 | 293 | 240 |
| no2 | - | 21 | 33 | 46 | 41 | 38 | 48 | 31 | 16 | 20 | 24 | 29 | 38 | 72 | 57 | 57 | 42 | 20 | 17 | 13 | 16 | 26 |
| so2 | - | 12 | 12 | 13 | 8.5 | 8 | 11 | 12 | 11 | 8.4 | 9.2 | 17 | 20 | 16 | 9.8 | 12 | 13 | 6.5 | 6 | 2.9 | 8.3 | 10 |
| co | 1.1 | 0.81 | 0.89 | 1.1 | 1.2 | 1.3 | 1.3 | 1.1 | 1.3 | 1.3 | 1.6 | 1.3 | 1.2 | 1.8 | 3.1 | 2.2 | 2.5 | 1.2 | 1 | 0.7 | 28 | 52 |
| o3 | 95 | 23 | 61 | 59 | 18 | 28 | 37 | 55 | 30 | 24 | 30 | 62 | 49 | 42 | 31 | 46 | 51 | 26 | 34 | 133 | 127 | 82 |