Polusi udara di Kāsāreddipalli: indeks kualitas udara real-time dan siaga asap.
Perkiraan kualitas polusi dan udara untuk Kāsāreddipalli. Hari ini Rabu, 13 Mei 2026. Nilai polusi udara berikut telah tercatat untuk Kāsāreddipalli:- karbon monoksida (CO) - 480 (Bagus)
- partikulat Matter (PM 2.5) debu - 60 (Tidak sehat)
- sulfur dioksida (SO2) - 9 (Bagus)
- partikulat Matter (PM10) debu tersuspensi - 113 (Sangat tidak sehat)
- ozon (O3) - 7 (Bagus)
- nitrogen dioksida (NO2) - 23 (Bagus)

Apa kualitas udara di Kāsāreddipalli hari ini? Apakah udara tercemar di Kāsāreddipalli?. Apakah ada Smog?
Seberapa tinggi tingkat CO? (karbon monoksida (CO))
480 (Bagus)
Apa tingkat saat PM 2,5 in Kāsāreddipalli? (partikulat Matter (PM 2.5) debu)
Hari ini PM 2.5 tingkat:
60 (Tidak sehat)
Sebagai perbandingan, tingkat tertinggi PM 2,5 in Kāsāreddipalli dalam 7 hari terakhir adalah: 61 (Senin, 31 Oktober 2022) dan Terendah: 61 (Senin, 31 Oktober 2022).
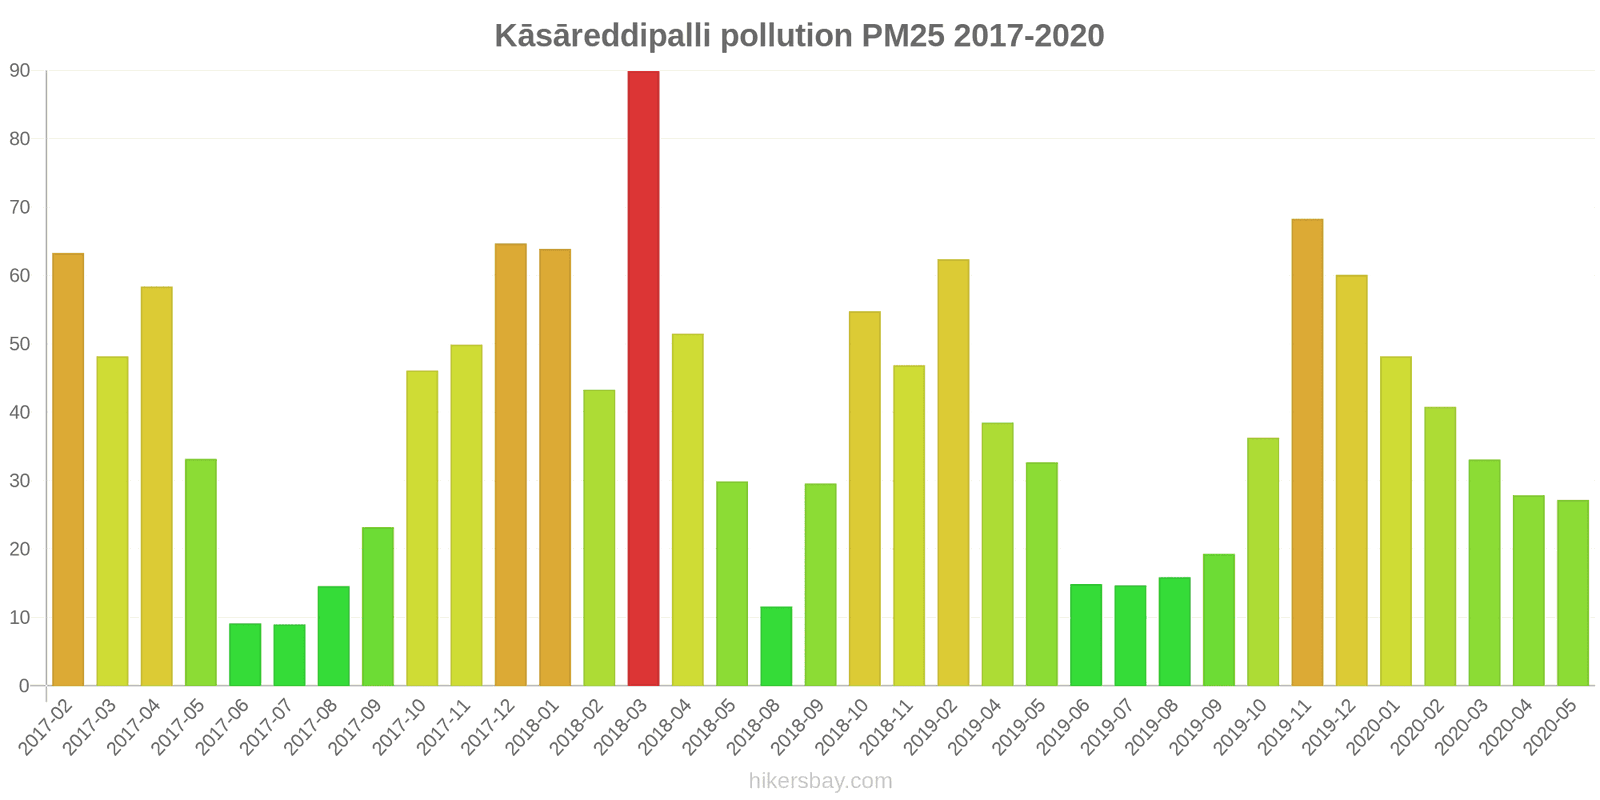
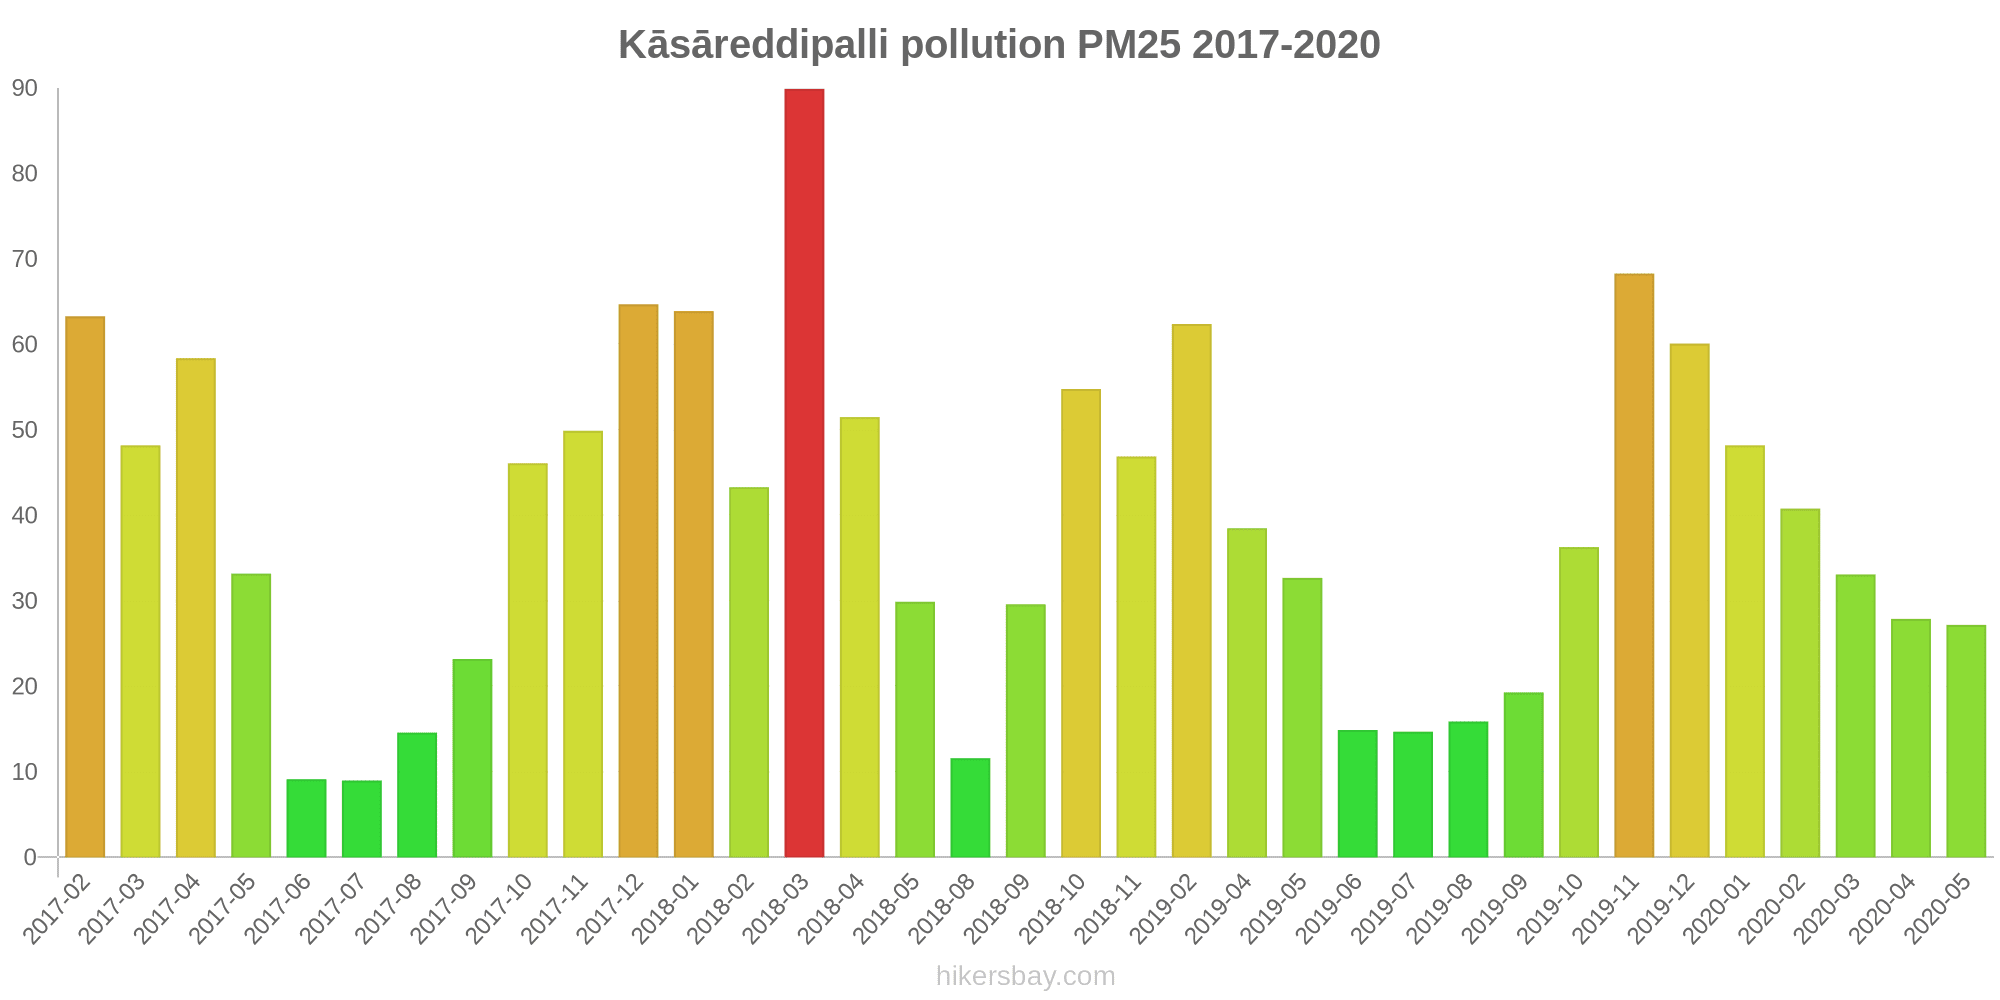
Nilai tertinggi PM 2.5 direkam: 90 (Maret 2018).
Tingkat terendah dari partikulat Matter PM 2.5 polusi terjadi di bulan: Juli (9).
Apa tingkat polusi SO2? (sulfur dioksida (SO2))
9 (Bagus)
Apa tingkat PM10 hari ini di Kāsāreddipalli? (partikulat Matter (PM10) debu tersuspensi)
Level saat ini dari partikulat Matter PM10 di Kāsāreddipalli adalah:
113 (Sangat tidak sehat)
Nilai PM10 tertinggi biasanya terjadi di bulan: 178 (Februari 2017).
Nilai terendah dari partikulat PM10 pencemaran Kāsāreddipalli biasanya dicatat di: Juni (31).
Bagaimana tingkat O3 hari ini di Kāsāreddipalli? (ozon (O3))
7 (Bagus)
Seberapa tinggi tingkat NO2? (nitrogen dioksida (NO2))
23 (Bagus)
Data saat ini Senin, 31 Oktober 2022 01.45
CO 480 (Bagus)
PM2,5 60 (Tidak sehat)
SO2 9 (Bagus)
PM10 113 (Sangat tidak sehat)
O3 7 (Bagus)
NO2 23 (Bagus)
Data tentang polusi udara dari beberapa hari terakhir di Kāsāreddipalli
index
2022-10-31
co
500
Good
pm25
61
Unhealthy
so2
9
Good
pm10
118
Very Unhealthy
o3
5
Good
no2
25
Good
data source »
Polusi udara di Kāsāreddipalli dari Februari 2017 ke Mei 2020
index
2020-05
2020-04
2020-03
2020-02
2020-01
2019-12
2019-11
2019-10
2019-09
2019-08
2019-07
2019-06
2019-05
2019-04
2019-02
2018-11
2018-10
2018-09
2018-08
2018-05
2018-04
2018-03
2018-02
2018-01
2017-12
2017-11
2017-10
2017-09
2017-08
2017-07
2017-06
2017-05
2017-04
2017-03
2017-02
pm25
27 (Moderate)
28 (Moderate)
33 (Moderate)
41 (Unhealthy for Sensitive Groups)
48 (Unhealthy for Sensitive Groups)
60 (Unhealthy)
68 (Unhealthy)
36 (Unhealthy for Sensitive Groups)
19 (Moderate)
16 (Moderate)
15 (Moderate)
15 (Moderate)
33 (Moderate)
39 (Unhealthy for Sensitive Groups)
62 (Unhealthy)
47 (Unhealthy for Sensitive Groups)
55 (Unhealthy for Sensitive Groups)
30 (Moderate)
12 (Good)
30 (Moderate)
52 (Unhealthy for Sensitive Groups)
90 (Very Unhealthy)
43 (Unhealthy for Sensitive Groups)
64 (Unhealthy)
65 (Unhealthy)
50 (Unhealthy for Sensitive Groups)
46 (Unhealthy for Sensitive Groups)
23 (Moderate)
15 (Moderate)
9 (Good)
9.2 (Good)
33 (Moderate)
58 (Unhealthy)
48 (Unhealthy for Sensitive Groups)
63 (Unhealthy)
pm10
64 (Unhealthy for Sensitive Groups)
58 (Unhealthy for Sensitive Groups)
77 (Unhealthy for Sensitive Groups)
96 (Unhealthy)
101 (Unhealthy)
120 (Very Unhealthy)
123 (Very Unhealthy)
66 (Unhealthy for Sensitive Groups)
33 (Moderate)
36 (Moderate)
31 (Moderate)
35 (Moderate)
130 (Very Unhealthy)
108 (Unhealthy)
140 (Very Unhealthy)
107 (Unhealthy)
125 (Very Unhealthy)
73 (Unhealthy for Sensitive Groups)
38 (Moderate)
83 (Unhealthy)
90 (Unhealthy)
103 (Unhealthy)
108 (Unhealthy)
141 (Very Unhealthy)
132 (Very Unhealthy)
100 (Unhealthy)
88 (Unhealthy)
49 (Moderate)
35 (Moderate)
36 (Moderate)
31 (Moderate)
98 (Unhealthy)
174 (Very bad Hazardous)
130 (Very Unhealthy)
178 (Very bad Hazardous)
no2
8.5 (Good)
7.5 (Good)
12 (Good)
22 (Good)
21 (Good)
27 (Good)
32 (Good)
18 (Good)
9.2 (Good)
5.9 (Good)
5.5 (Good)
8.1 (Good)
17 (Good)
14 (Good)
25 (Good)
22 (Good)
21 (Good)
11 (Good)
4.1 (Good)
12 (Good)
23 (Good)
26 (Good)
21 (Good)
27 (Good)
28 (Good)
22 (Good)
14 (Good)
8.3 (Good)
6.2 (Good)
5.2 (Good)
7.5 (Good)
16 (Good)
30 (Good)
24 (Good)
35 (Good)
so2
18 (Good)
14 (Good)
15 (Good)
18 (Good)
20 (Good)
17 (Good)
22 (Good)
7 (Good)
5.2 (Good)
16 (Good)
17 (Good)
16 (Good)
12 (Good)
12 (Good)
19 (Good)
27 (Good)
112 (Unhealthy for Sensitive Groups)
27 (Good)
29 (Good)
27 (Good)
24 (Good)
17 (Good)
26 (Good)
32 (Good)
30 (Good)
36 (Good)
23 (Good)
17 (Good)
16 (Good)
23 (Good)
18 (Good)
22 (Good)
39 (Good)
37 (Good)
34 (Good)
co
467 (Good)
453 (Good)
490 (Good)
568 (Good)
540 (Good)
648 (Good)
648 (Good)
458 (Good)
351 (Good)
294 (Good)
277 (Good)
247 (Good)
485 (Good)
464 (Good)
552 (Good)
438 (Good)
449 (Good)
347 (Good)
274 (Good)
400 (Good)
13 (Good)
34 (Good)
628 (Good)
782 (Good)
843 (Good)
657 (Good)
605 (Good)
409 (Good)
378 (Good)
278 (Good)
329 (Good)
479 (Good)
896 (Good)
833 (Good)
1 (Good)
o3
21 (Good)
25 (Good)
23 (Good)
30 (Good)
32 (Good)
33 (Good)
35 (Good)
24 (Good)
20 (Good)
20 (Good)
25 (Good)
34 (Good)
42 (Good)
64 (Good)
26 (Good)
23 (Good)
29 (Good)
28 (Good)
21 (Good)
57 (Good)
44 (Good)
35 (Good)
53 (Good)
47 (Good)
48 (Good)
43 (Good)
39 (Good)
27 (Good)
23 (Good)
27 (Good)
42 (Good)
63 (Good)
58 (Good)
64 (Good)
66 (Good)
data source »
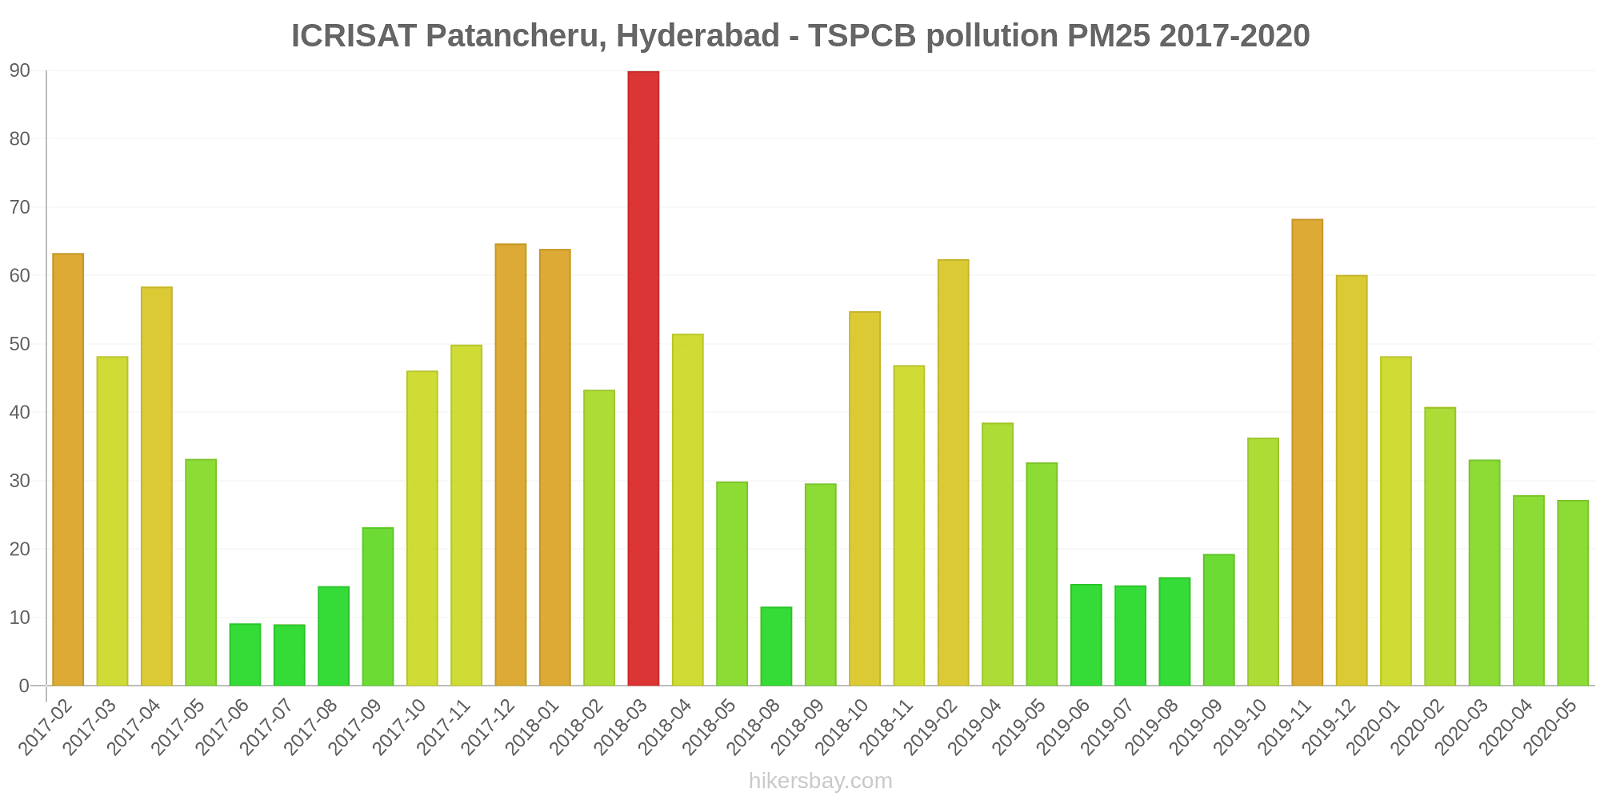
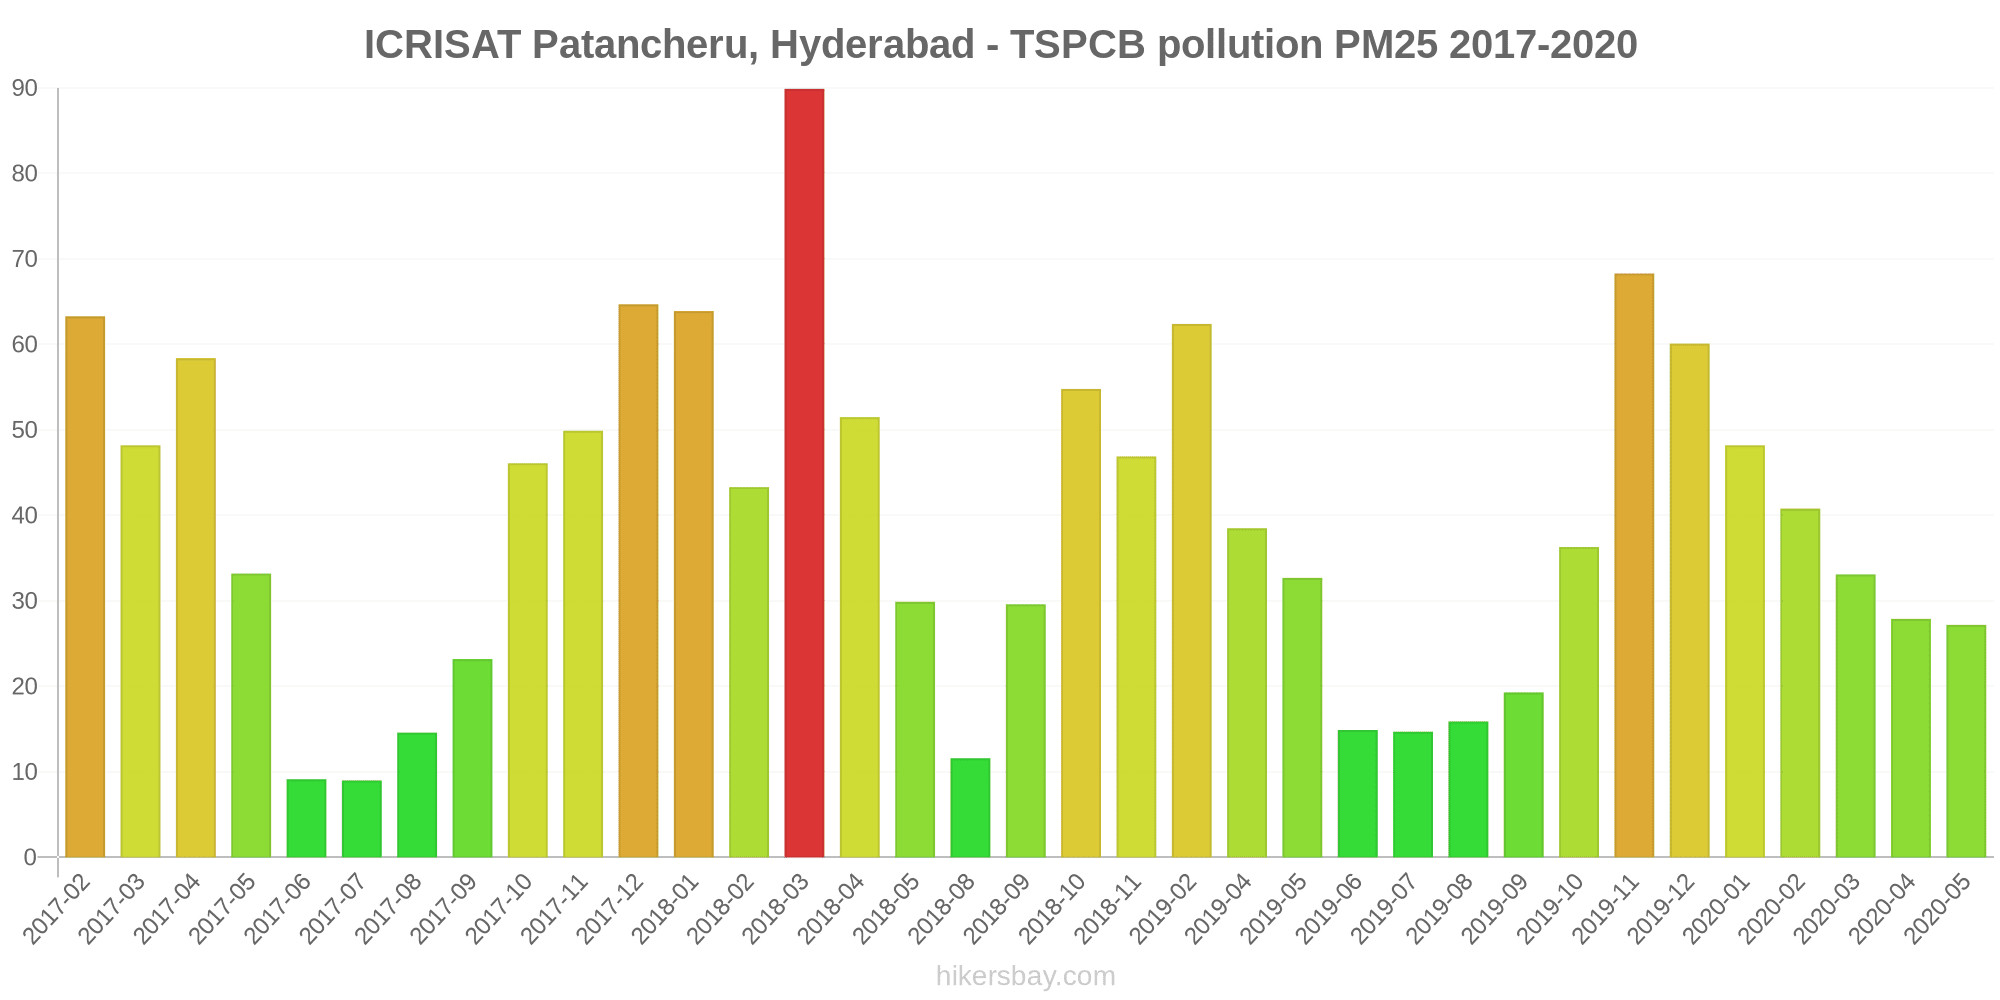
ICRISAT Patancheru, Hyderabad - TSPCB
Senin, 31 Oktober 2022 01.45
CO 480 (Bagus)
karbon monoksida (CO)
PM2,5 60 (Tidak sehat)
partikulat Matter (PM 2.5) debu
SO2 8.9 (Bagus)
sulfur dioksida (SO2)
PM10 113 (Sangat tidak sehat)
partikulat Matter (PM10) debu tersuspensi
O3 7.4 (Bagus)
ozon (O3)
NO2 23 (Bagus)
nitrogen dioksida (NO2)
ICRISAT Patancheru, Hyderabad - TSPCB
index
2022-10-31
co
500
pm25
61
so2
9.1
pm10
118
o3
5.3
no2
25
ICRISAT Patancheru, Hyderabad - TSPCB
2017-02 2020-05
index
2020-05
2020-04
2020-03
2020-02
2020-01
2019-12
2019-11
2019-10
2019-09
2019-08
2019-07
2019-06
2019-05
2019-04
2019-02
2018-11
2018-10
2018-09
2018-08
2018-05
2018-04
2018-03
2018-02
2018-01
2017-12
2017-11
2017-10
2017-09
2017-08
2017-07
2017-06
2017-05
2017-04
2017-03
2017-02
no2
8.5
7.5
12
22
21
27
32
18
9.2
5.9
5.5
8.1
17
14
25
22
21
11
4.1
12
23
26
21
27
28
22
14
8.3
6.2
5.2
7.5
16
30
24
35
co
467
453
490
568
540
648
648
458
351
294
277
247
485
464
552
438
449
347
274
400
13
34
628
782
843
657
605
409
378
278
329
479
896
833
1
pm25
27
28
33
41
48
60
68
36
19
16
15
15
33
39
62
47
55
30
12
30
52
90
43
64
65
50
46
23
15
9
9.2
33
58
48
63
so2
18
14
15
18
20
17
22
7
5.2
16
17
16
12
12
19
27
112
27
29
27
24
17
26
32
30
36
23
17
16
23
18
22
39
37
34
o3
21
25
23
30
32
33
35
24
20
20
25
34
42
64
26
23
29
28
21
57
44
35
53
47
48
43
39
27
23
27
42
63
58
64
66
pm10
64
58
77
96
101
120
123
66
33
36
31
35
130
108
140
107
125
73
38
83
90
103
108
141
132
100
88
49
35
36
31
98
174
130
178
* Pollution data source:
https://openaq.org
(caaqm)
The data is licensed under CC-By 4.0
CO 480 (Bagus)
PM2,5 60 (Tidak sehat)
SO2 9 (Bagus)
PM10 113 (Sangat tidak sehat)
O3 7 (Bagus)
NO2 23 (Bagus)
Data tentang polusi udara dari beberapa hari terakhir di Kāsāreddipalli
| index | 2022-10-31 |
|---|---|
| co | 500 Good |
| pm25 | 61 Unhealthy |
| so2 | 9 Good |
| pm10 | 118 Very Unhealthy |
| o3 | 5 Good |
| no2 | 25 Good |
| index | 2020-05 | 2020-04 | 2020-03 | 2020-02 | 2020-01 | 2019-12 | 2019-11 | 2019-10 | 2019-09 | 2019-08 | 2019-07 | 2019-06 | 2019-05 | 2019-04 | 2019-02 | 2018-11 | 2018-10 | 2018-09 | 2018-08 | 2018-05 | 2018-04 | 2018-03 | 2018-02 | 2018-01 | 2017-12 | 2017-11 | 2017-10 | 2017-09 | 2017-08 | 2017-07 | 2017-06 | 2017-05 | 2017-04 | 2017-03 | 2017-02 |
|---|---|---|---|---|---|---|---|---|---|---|---|---|---|---|---|---|---|---|---|---|---|---|---|---|---|---|---|---|---|---|---|---|---|---|---|
| pm25 | 27 (Moderate) | 28 (Moderate) | 33 (Moderate) | 41 (Unhealthy for Sensitive Groups) | 48 (Unhealthy for Sensitive Groups) | 60 (Unhealthy) | 68 (Unhealthy) | 36 (Unhealthy for Sensitive Groups) | 19 (Moderate) | 16 (Moderate) | 15 (Moderate) | 15 (Moderate) | 33 (Moderate) | 39 (Unhealthy for Sensitive Groups) | 62 (Unhealthy) | 47 (Unhealthy for Sensitive Groups) | 55 (Unhealthy for Sensitive Groups) | 30 (Moderate) | 12 (Good) | 30 (Moderate) | 52 (Unhealthy for Sensitive Groups) | 90 (Very Unhealthy) | 43 (Unhealthy for Sensitive Groups) | 64 (Unhealthy) | 65 (Unhealthy) | 50 (Unhealthy for Sensitive Groups) | 46 (Unhealthy for Sensitive Groups) | 23 (Moderate) | 15 (Moderate) | 9 (Good) | 9.2 (Good) | 33 (Moderate) | 58 (Unhealthy) | 48 (Unhealthy for Sensitive Groups) | 63 (Unhealthy) |
| pm10 | 64 (Unhealthy for Sensitive Groups) | 58 (Unhealthy for Sensitive Groups) | 77 (Unhealthy for Sensitive Groups) | 96 (Unhealthy) | 101 (Unhealthy) | 120 (Very Unhealthy) | 123 (Very Unhealthy) | 66 (Unhealthy for Sensitive Groups) | 33 (Moderate) | 36 (Moderate) | 31 (Moderate) | 35 (Moderate) | 130 (Very Unhealthy) | 108 (Unhealthy) | 140 (Very Unhealthy) | 107 (Unhealthy) | 125 (Very Unhealthy) | 73 (Unhealthy for Sensitive Groups) | 38 (Moderate) | 83 (Unhealthy) | 90 (Unhealthy) | 103 (Unhealthy) | 108 (Unhealthy) | 141 (Very Unhealthy) | 132 (Very Unhealthy) | 100 (Unhealthy) | 88 (Unhealthy) | 49 (Moderate) | 35 (Moderate) | 36 (Moderate) | 31 (Moderate) | 98 (Unhealthy) | 174 (Very bad Hazardous) | 130 (Very Unhealthy) | 178 (Very bad Hazardous) |
| no2 | 8.5 (Good) | 7.5 (Good) | 12 (Good) | 22 (Good) | 21 (Good) | 27 (Good) | 32 (Good) | 18 (Good) | 9.2 (Good) | 5.9 (Good) | 5.5 (Good) | 8.1 (Good) | 17 (Good) | 14 (Good) | 25 (Good) | 22 (Good) | 21 (Good) | 11 (Good) | 4.1 (Good) | 12 (Good) | 23 (Good) | 26 (Good) | 21 (Good) | 27 (Good) | 28 (Good) | 22 (Good) | 14 (Good) | 8.3 (Good) | 6.2 (Good) | 5.2 (Good) | 7.5 (Good) | 16 (Good) | 30 (Good) | 24 (Good) | 35 (Good) |
| so2 | 18 (Good) | 14 (Good) | 15 (Good) | 18 (Good) | 20 (Good) | 17 (Good) | 22 (Good) | 7 (Good) | 5.2 (Good) | 16 (Good) | 17 (Good) | 16 (Good) | 12 (Good) | 12 (Good) | 19 (Good) | 27 (Good) | 112 (Unhealthy for Sensitive Groups) | 27 (Good) | 29 (Good) | 27 (Good) | 24 (Good) | 17 (Good) | 26 (Good) | 32 (Good) | 30 (Good) | 36 (Good) | 23 (Good) | 17 (Good) | 16 (Good) | 23 (Good) | 18 (Good) | 22 (Good) | 39 (Good) | 37 (Good) | 34 (Good) |
| co | 467 (Good) | 453 (Good) | 490 (Good) | 568 (Good) | 540 (Good) | 648 (Good) | 648 (Good) | 458 (Good) | 351 (Good) | 294 (Good) | 277 (Good) | 247 (Good) | 485 (Good) | 464 (Good) | 552 (Good) | 438 (Good) | 449 (Good) | 347 (Good) | 274 (Good) | 400 (Good) | 13 (Good) | 34 (Good) | 628 (Good) | 782 (Good) | 843 (Good) | 657 (Good) | 605 (Good) | 409 (Good) | 378 (Good) | 278 (Good) | 329 (Good) | 479 (Good) | 896 (Good) | 833 (Good) | 1 (Good) |
| o3 | 21 (Good) | 25 (Good) | 23 (Good) | 30 (Good) | 32 (Good) | 33 (Good) | 35 (Good) | 24 (Good) | 20 (Good) | 20 (Good) | 25 (Good) | 34 (Good) | 42 (Good) | 64 (Good) | 26 (Good) | 23 (Good) | 29 (Good) | 28 (Good) | 21 (Good) | 57 (Good) | 44 (Good) | 35 (Good) | 53 (Good) | 47 (Good) | 48 (Good) | 43 (Good) | 39 (Good) | 27 (Good) | 23 (Good) | 27 (Good) | 42 (Good) | 63 (Good) | 58 (Good) | 64 (Good) | 66 (Good) |
CO 480 (Bagus)
karbon monoksida (CO)PM2,5 60 (Tidak sehat)
partikulat Matter (PM 2.5) debuSO2 8.9 (Bagus)
sulfur dioksida (SO2)PM10 113 (Sangat tidak sehat)
partikulat Matter (PM10) debu tersuspensiO3 7.4 (Bagus)
ozon (O3)NO2 23 (Bagus)
nitrogen dioksida (NO2)ICRISAT Patancheru, Hyderabad - TSPCB
| index | 2022-10-31 |
|---|---|
| co | 500 |
| pm25 | 61 |
| so2 | 9.1 |
| pm10 | 118 |
| o3 | 5.3 |
| no2 | 25 |
ICRISAT Patancheru, Hyderabad - TSPCB
| index | 2020-05 | 2020-04 | 2020-03 | 2020-02 | 2020-01 | 2019-12 | 2019-11 | 2019-10 | 2019-09 | 2019-08 | 2019-07 | 2019-06 | 2019-05 | 2019-04 | 2019-02 | 2018-11 | 2018-10 | 2018-09 | 2018-08 | 2018-05 | 2018-04 | 2018-03 | 2018-02 | 2018-01 | 2017-12 | 2017-11 | 2017-10 | 2017-09 | 2017-08 | 2017-07 | 2017-06 | 2017-05 | 2017-04 | 2017-03 | 2017-02 |
|---|---|---|---|---|---|---|---|---|---|---|---|---|---|---|---|---|---|---|---|---|---|---|---|---|---|---|---|---|---|---|---|---|---|---|---|
| no2 | 8.5 | 7.5 | 12 | 22 | 21 | 27 | 32 | 18 | 9.2 | 5.9 | 5.5 | 8.1 | 17 | 14 | 25 | 22 | 21 | 11 | 4.1 | 12 | 23 | 26 | 21 | 27 | 28 | 22 | 14 | 8.3 | 6.2 | 5.2 | 7.5 | 16 | 30 | 24 | 35 |
| co | 467 | 453 | 490 | 568 | 540 | 648 | 648 | 458 | 351 | 294 | 277 | 247 | 485 | 464 | 552 | 438 | 449 | 347 | 274 | 400 | 13 | 34 | 628 | 782 | 843 | 657 | 605 | 409 | 378 | 278 | 329 | 479 | 896 | 833 | 1 |
| pm25 | 27 | 28 | 33 | 41 | 48 | 60 | 68 | 36 | 19 | 16 | 15 | 15 | 33 | 39 | 62 | 47 | 55 | 30 | 12 | 30 | 52 | 90 | 43 | 64 | 65 | 50 | 46 | 23 | 15 | 9 | 9.2 | 33 | 58 | 48 | 63 |
| so2 | 18 | 14 | 15 | 18 | 20 | 17 | 22 | 7 | 5.2 | 16 | 17 | 16 | 12 | 12 | 19 | 27 | 112 | 27 | 29 | 27 | 24 | 17 | 26 | 32 | 30 | 36 | 23 | 17 | 16 | 23 | 18 | 22 | 39 | 37 | 34 |
| o3 | 21 | 25 | 23 | 30 | 32 | 33 | 35 | 24 | 20 | 20 | 25 | 34 | 42 | 64 | 26 | 23 | 29 | 28 | 21 | 57 | 44 | 35 | 53 | 47 | 48 | 43 | 39 | 27 | 23 | 27 | 42 | 63 | 58 | 64 | 66 |
| pm10 | 64 | 58 | 77 | 96 | 101 | 120 | 123 | 66 | 33 | 36 | 31 | 35 | 130 | 108 | 140 | 107 | 125 | 73 | 38 | 83 | 90 | 103 | 108 | 141 | 132 | 100 | 88 | 49 | 35 | 36 | 31 | 98 | 174 | 130 | 178 |