Polusi udara di Dhar: indeks kualitas udara real-time dan siaga asap.
Perkiraan kualitas polusi dan udara untuk Dhar. Hari ini Rabu, 13 Mei 2026. Nilai polusi udara berikut telah tercatat untuk Dhar:- nitrogen dioksida (NO2) - 29 (Bagus)
- partikulat Matter (PM10) debu tersuspensi - 186 (Sangat buruk berbahaya)
- ozon (O3) - 38 (Bagus)
- partikulat Matter (PM 2.5) debu - 66 (Tidak sehat)
- sulfur dioksida (SO2) - 13 (Bagus)
- karbon monoksida (CO) - 1050 (Bagus)

Apa kualitas udara di Dhar hari ini? Apakah udara tercemar di Dhar?. Apakah ada Smog?
Seberapa tinggi tingkat NO2? (nitrogen dioksida (NO2))
29 (Bagus)
Apa tingkat PM10 hari ini di Dhar? (partikulat Matter (PM10) debu tersuspensi)
Level saat ini dari partikulat Matter PM10 di Dhar adalah:
186 (Sangat buruk berbahaya)
Nilai PM10 tertinggi biasanya terjadi di bulan: 241 (Mei 2019).
Nilai terendah dari partikulat PM10 pencemaran Dhar biasanya dicatat di: September (51).
Bagaimana tingkat O3 hari ini di Dhar? (ozon (O3))
38 (Bagus)
Apa tingkat saat PM 2,5 in Dhar? (partikulat Matter (PM 2.5) debu)
Hari ini PM 2.5 tingkat:
66 (Tidak sehat)
Sebagai perbandingan, tingkat tertinggi PM 2,5 in Dhar dalam 7 hari terakhir adalah: 116 (Senin, 31 Oktober 2022) dan Terendah: 19 (Jumat, 7 Oktober 2022).
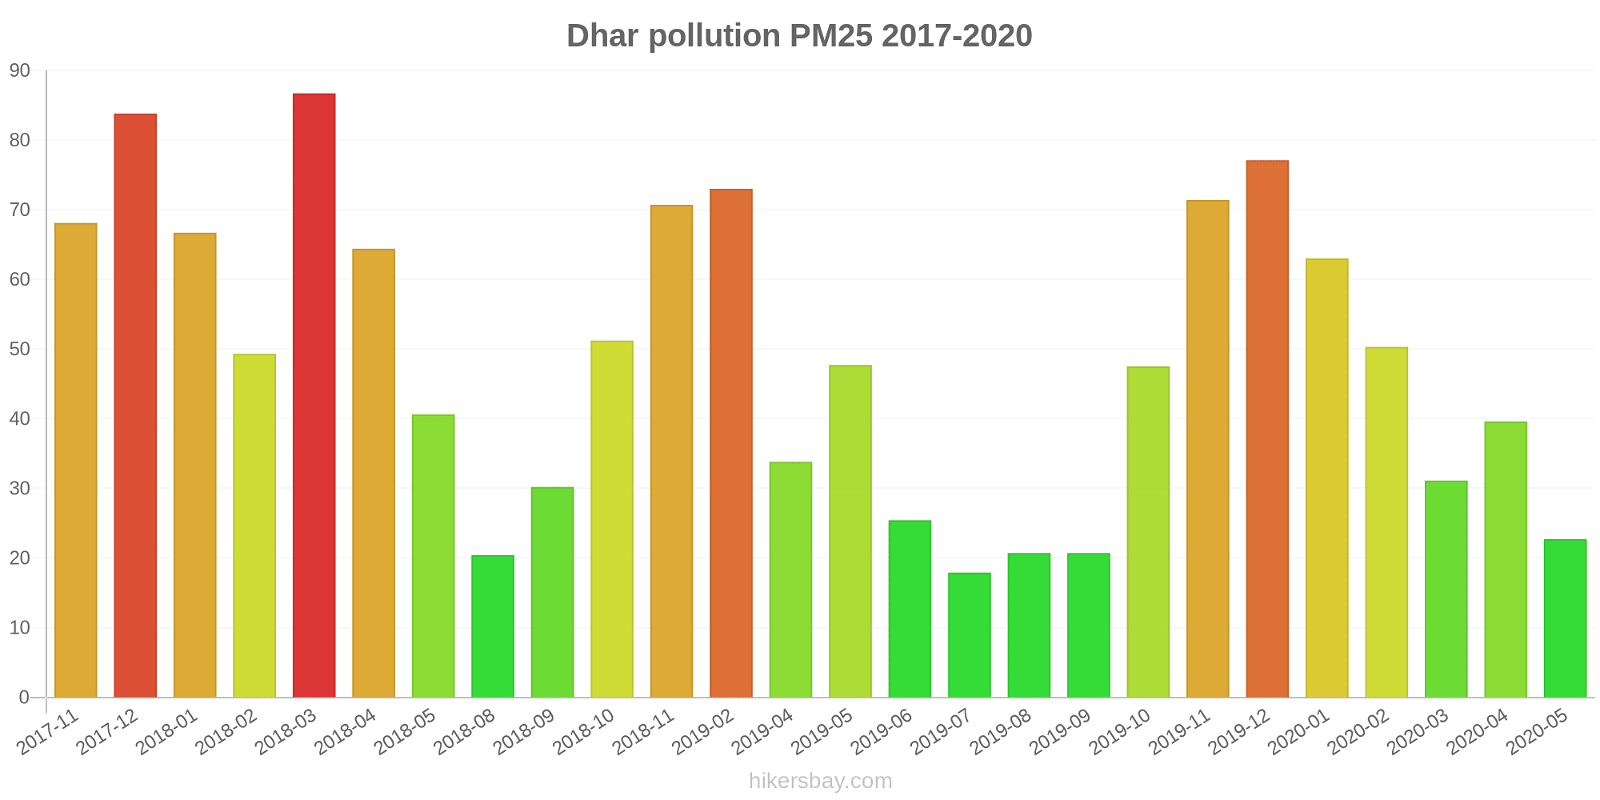
Nilai tertinggi PM 2.5 direkam: 87 (Maret 2018).
Tingkat terendah dari partikulat Matter PM 2.5 polusi terjadi di bulan: Juli (18).
Apa tingkat polusi SO2? (sulfur dioksida (SO2))
13 (Bagus)
Seberapa tinggi tingkat CO? (karbon monoksida (CO))
1050 (Bagus)
Data saat ini Senin, 31 Oktober 2022 02.00
NO2 29 (Bagus)
PM10 186 (Sangat buruk berbahaya)
O3 38 (Bagus)
PM2,5 66 (Tidak sehat)
SO2 13 (Bagus)
CO 1050 (Bagus)
Data tentang polusi udara dari beberapa hari terakhir di Dhar
index
2022-10-07
2022-10-08
2022-10-09
2022-10-10
2022-10-11
2022-10-12
2022-10-13
2022-10-14
2022-10-31
pm10
37
Moderate
58
Unhealthy for Sensitive Groups
62
Unhealthy for Sensitive Groups
106
Unhealthy
72
Unhealthy for Sensitive Groups
143
Very Unhealthy
92
Unhealthy
74
Unhealthy for Sensitive Groups
322
Very bad Hazardous
no2
27
Good
32
Good
39
Good
53
Moderate
47
Moderate
63
Moderate
52
Moderate
43
Moderate
10
Good
pm25
19
Moderate
24
Moderate
23
Moderate
33
Moderate
29
Moderate
43
Unhealthy for Sensitive Groups
27
Moderate
19
Moderate
116
Very bad Hazardous
so2
11
Good
13
Good
14
Good
15
Good
12
Good
17
Good
14
Good
13
Good
14
Good
o3
20
Good
28
Good
26
Good
24
Good
31
Good
38
Good
33
Good
42
Good
24
Good
co
-
Good
-
Good
-
Good
-
Good
-
Good
-
Good
-
Good
-
Good
1050
Good
data source »
Polusi udara di Dhar dari November 2017 ke Mei 2020
index
2020-05
2020-04
2020-03
2020-02
2020-01
2019-12
2019-11
2019-10
2019-09
2019-08
2019-07
2019-06
2019-05
2019-04
2019-02
2018-11
2018-10
2018-09
2018-08
2018-05
2018-04
2018-03
2018-02
2018-01
2017-12
2017-11
pm25
23 (Moderate)
40 (Unhealthy for Sensitive Groups)
31 (Moderate)
50 (Unhealthy for Sensitive Groups)
63 (Unhealthy)
77 (Very Unhealthy)
71 (Unhealthy)
48 (Unhealthy for Sensitive Groups)
21 (Moderate)
21 (Moderate)
18 (Moderate)
25 (Moderate)
48 (Unhealthy for Sensitive Groups)
34 (Moderate)
73 (Unhealthy)
71 (Unhealthy)
51 (Unhealthy for Sensitive Groups)
30 (Moderate)
20 (Moderate)
41 (Unhealthy for Sensitive Groups)
64 (Unhealthy)
87 (Very Unhealthy)
49 (Unhealthy for Sensitive Groups)
67 (Unhealthy)
84 (Very Unhealthy)
68 (Unhealthy)
pm10
117 (Very Unhealthy)
119 (Very Unhealthy)
115 (Very Unhealthy)
126 (Very Unhealthy)
127 (Very Unhealthy)
137 (Very Unhealthy)
137 (Very Unhealthy)
107 (Unhealthy)
51 (Unhealthy for Sensitive Groups)
58 (Unhealthy for Sensitive Groups)
60 (Unhealthy for Sensitive Groups)
72 (Unhealthy for Sensitive Groups)
241 (Very bad Hazardous)
160 (Very bad Hazardous)
161 (Very bad Hazardous)
153 (Very bad Hazardous)
156 (Very bad Hazardous)
101 (Unhealthy)
59 (Unhealthy for Sensitive Groups)
159 (Very bad Hazardous)
150 (Very bad Hazardous)
132 (Very Unhealthy)
137 (Very Unhealthy)
137 (Very Unhealthy)
148 (Very Unhealthy)
145 (Very Unhealthy)
no2
8.5 (Good)
9.6 (Good)
12 (Good)
18 (Good)
17 (Good)
18 (Good)
17 (Good)
11 (Good)
8.4 (Good)
4.4 (Good)
6.5 (Good)
8.5 (Good)
7.2 (Good)
7.5 (Good)
21 (Good)
15 (Good)
14 (Good)
7.2 (Good)
5.1 (Good)
7.2 (Good)
8 (Good)
15 (Good)
19 (Good)
18 (Good)
20 (Good)
18 (Good)
so2
12 (Good)
10 (Good)
11 (Good)
18 (Good)
15 (Good)
14 (Good)
24 (Good)
13 (Good)
5.7 (Good)
4.9 (Good)
3.9 (Good)
5.5 (Good)
15 (Good)
12 (Good)
43 (Good)
20 (Good)
18 (Good)
9 (Good)
8.8 (Good)
16 (Good)
14 (Good)
20 (Good)
22 (Good)
23 (Good)
33 (Good)
40 (Good)
co
633 (Good)
1 (Good)
1 (Good)
1 (Good)
921 (Good)
547 (Good)
642 (Good)
499 (Good)
395 (Good)
276 (Good)
313 (Good)
352 (Good)
267 (Good)
273 (Good)
659 (Good)
599 (Good)
522 (Good)
314 (Good)
283 (Good)
1 (Good)
29 (Good)
51 (Good)
1 (Good)
813 (Good)
1 (Good)
988 (Good)
o3
12 (Good)
12 (Good)
12 (Good)
14 (Good)
14 (Good)
12 (Good)
13 (Good)
13 (Good)
8.1 (Good)
8.4 (Good)
12 (Good)
19 (Good)
23 (Good)
24 (Good)
39 (Good)
99 (Moderate)
77 (Moderate)
41 (Good)
27 (Good)
52 (Good)
59 (Good)
70 (Moderate)
97 (Moderate)
102 (Moderate)
100 (Moderate)
134 (Unhealthy for Sensitive Groups)
data source »
Chhoti Gwaltoli, Indore - MPPCB
Jumat, 14 Oktober 2022 06.00
NO2 47 (Moderat)
nitrogen dioksida (NO2)
PM10 82 (Tidak sehat)
partikulat Matter (PM10) debu tersuspensi
O3 52 (Bagus)
ozon (O3)
PM2,5 12 (Bagus)
partikulat Matter (PM 2.5) debu
SO2 12 (Bagus)
sulfur dioksida (SO2)
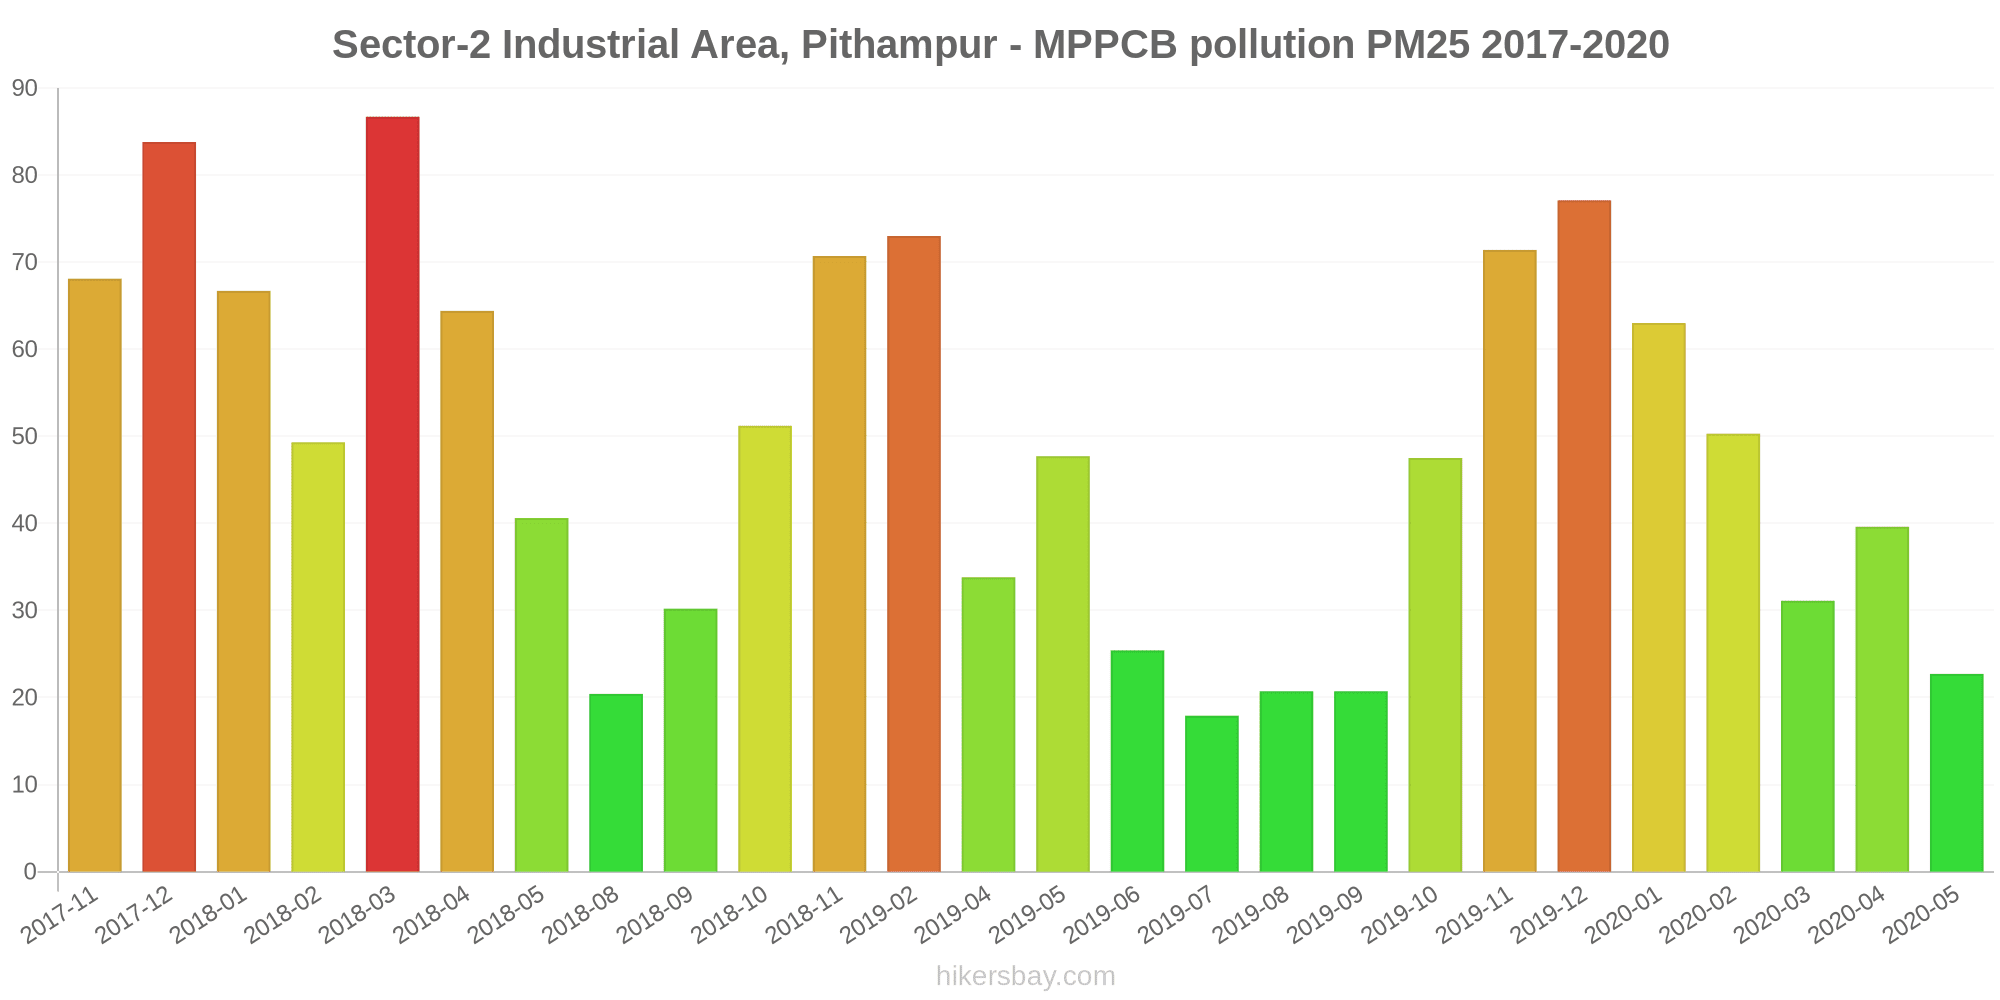
Sector-2 Industrial Area, Pithampur - MPPCB
Senin, 31 Oktober 2022 02.00
PM10 289 (Sangat buruk berbahaya)
partikulat Matter (PM10) debu tersuspensi
O3 24 (Bagus)
ozon (O3)
PM2,5 120 (Sangat buruk berbahaya)
partikulat Matter (PM 2.5) debu
SO2 14 (Bagus)
sulfur dioksida (SO2)
CO 1050 (Bagus)
karbon monoksida (CO)
NO2 11 (Bagus)
nitrogen dioksida (NO2)
Chhoti Gwaltoli, Indore - MPPCB
index
2022-10-14
2022-10-13
2022-10-12
2022-10-11
2022-10-10
2022-10-09
2022-10-08
2022-10-07
pm10
74
92
143
72
106
62
58
37
no2
43
52
63
47
53
39
32
27
pm25
19
27
43
29
33
23
24
19
so2
13
14
17
12
15
14
13
11
o3
42
33
38
31
24
26
28
20
Sector-2 Industrial Area, Pithampur - MPPCB
index
2022-10-31
pm10
322
o3
24
pm25
116
so2
14
co
1050
no2
10
Sector-2 Industrial Area, Pithampur - MPPCB
2017-11 2020-05

index
2020-05
2020-04
2020-03
2020-02
2020-01
2019-12
2019-11
2019-10
2019-09
2019-08
2019-07
2019-06
2019-05
2019-04
2019-02
2018-11
2018-10
2018-09
2018-08
2018-05
2018-04
2018-03
2018-02
2018-01
2017-12
2017-11
no2
8.5
9.6
12
18
17
18
17
11
8.4
4.4
6.5
8.5
7.2
7.5
21
15
14
7.2
5.1
7.2
8
15
19
18
20
18
so2
12
10
11
18
15
14
24
13
5.7
4.9
3.9
5.5
15
12
43
20
18
9
8.8
16
14
20
22
23
33
40
co
633
1
1
1
921
547
642
499
395
276
313
352
267
273
659
599
522
314
283
1
29
51
1
813
1
988
o3
12
12
12
14
14
12
13
13
8.1
8.4
12
19
23
24
39
99
77
41
27
52
59
70
97
102
100
134
pm10
117
119
115
126
127
137
137
107
51
58
60
72
241
160
161
153
156
101
59
159
150
132
137
137
148
145
pm25
23
40
31
50
63
77
71
48
21
21
18
25
48
34
73
71
51
30
20
41
64
87
49
67
84
68
* Pollution data source:
https://openaq.org
(caaqm)
The data is licensed under CC-By 4.0
NO2 29 (Bagus)
PM10 186 (Sangat buruk berbahaya)
O3 38 (Bagus)
PM2,5 66 (Tidak sehat)
SO2 13 (Bagus)
CO 1050 (Bagus)
Data tentang polusi udara dari beberapa hari terakhir di Dhar
| index | 2022-10-07 | 2022-10-08 | 2022-10-09 | 2022-10-10 | 2022-10-11 | 2022-10-12 | 2022-10-13 | 2022-10-14 | 2022-10-31 |
|---|---|---|---|---|---|---|---|---|---|
| pm10 | 37 Moderate |
58 Unhealthy for Sensitive Groups |
62 Unhealthy for Sensitive Groups |
106 Unhealthy |
72 Unhealthy for Sensitive Groups |
143 Very Unhealthy |
92 Unhealthy |
74 Unhealthy for Sensitive Groups |
322 Very bad Hazardous |
| no2 | 27 Good |
32 Good |
39 Good |
53 Moderate |
47 Moderate |
63 Moderate |
52 Moderate |
43 Moderate |
10 Good |
| pm25 | 19 Moderate |
24 Moderate |
23 Moderate |
33 Moderate |
29 Moderate |
43 Unhealthy for Sensitive Groups |
27 Moderate |
19 Moderate |
116 Very bad Hazardous |
| so2 | 11 Good |
13 Good |
14 Good |
15 Good |
12 Good |
17 Good |
14 Good |
13 Good |
14 Good |
| o3 | 20 Good |
28 Good |
26 Good |
24 Good |
31 Good |
38 Good |
33 Good |
42 Good |
24 Good |
| co | - Good |
- Good |
- Good |
- Good |
- Good |
- Good |
- Good |
- Good |
1050 Good |

| index | 2020-05 | 2020-04 | 2020-03 | 2020-02 | 2020-01 | 2019-12 | 2019-11 | 2019-10 | 2019-09 | 2019-08 | 2019-07 | 2019-06 | 2019-05 | 2019-04 | 2019-02 | 2018-11 | 2018-10 | 2018-09 | 2018-08 | 2018-05 | 2018-04 | 2018-03 | 2018-02 | 2018-01 | 2017-12 | 2017-11 |
|---|---|---|---|---|---|---|---|---|---|---|---|---|---|---|---|---|---|---|---|---|---|---|---|---|---|---|
| pm25 | 23 (Moderate) | 40 (Unhealthy for Sensitive Groups) | 31 (Moderate) | 50 (Unhealthy for Sensitive Groups) | 63 (Unhealthy) | 77 (Very Unhealthy) | 71 (Unhealthy) | 48 (Unhealthy for Sensitive Groups) | 21 (Moderate) | 21 (Moderate) | 18 (Moderate) | 25 (Moderate) | 48 (Unhealthy for Sensitive Groups) | 34 (Moderate) | 73 (Unhealthy) | 71 (Unhealthy) | 51 (Unhealthy for Sensitive Groups) | 30 (Moderate) | 20 (Moderate) | 41 (Unhealthy for Sensitive Groups) | 64 (Unhealthy) | 87 (Very Unhealthy) | 49 (Unhealthy for Sensitive Groups) | 67 (Unhealthy) | 84 (Very Unhealthy) | 68 (Unhealthy) |
| pm10 | 117 (Very Unhealthy) | 119 (Very Unhealthy) | 115 (Very Unhealthy) | 126 (Very Unhealthy) | 127 (Very Unhealthy) | 137 (Very Unhealthy) | 137 (Very Unhealthy) | 107 (Unhealthy) | 51 (Unhealthy for Sensitive Groups) | 58 (Unhealthy for Sensitive Groups) | 60 (Unhealthy for Sensitive Groups) | 72 (Unhealthy for Sensitive Groups) | 241 (Very bad Hazardous) | 160 (Very bad Hazardous) | 161 (Very bad Hazardous) | 153 (Very bad Hazardous) | 156 (Very bad Hazardous) | 101 (Unhealthy) | 59 (Unhealthy for Sensitive Groups) | 159 (Very bad Hazardous) | 150 (Very bad Hazardous) | 132 (Very Unhealthy) | 137 (Very Unhealthy) | 137 (Very Unhealthy) | 148 (Very Unhealthy) | 145 (Very Unhealthy) |
| no2 | 8.5 (Good) | 9.6 (Good) | 12 (Good) | 18 (Good) | 17 (Good) | 18 (Good) | 17 (Good) | 11 (Good) | 8.4 (Good) | 4.4 (Good) | 6.5 (Good) | 8.5 (Good) | 7.2 (Good) | 7.5 (Good) | 21 (Good) | 15 (Good) | 14 (Good) | 7.2 (Good) | 5.1 (Good) | 7.2 (Good) | 8 (Good) | 15 (Good) | 19 (Good) | 18 (Good) | 20 (Good) | 18 (Good) |
| so2 | 12 (Good) | 10 (Good) | 11 (Good) | 18 (Good) | 15 (Good) | 14 (Good) | 24 (Good) | 13 (Good) | 5.7 (Good) | 4.9 (Good) | 3.9 (Good) | 5.5 (Good) | 15 (Good) | 12 (Good) | 43 (Good) | 20 (Good) | 18 (Good) | 9 (Good) | 8.8 (Good) | 16 (Good) | 14 (Good) | 20 (Good) | 22 (Good) | 23 (Good) | 33 (Good) | 40 (Good) |
| co | 633 (Good) | 1 (Good) | 1 (Good) | 1 (Good) | 921 (Good) | 547 (Good) | 642 (Good) | 499 (Good) | 395 (Good) | 276 (Good) | 313 (Good) | 352 (Good) | 267 (Good) | 273 (Good) | 659 (Good) | 599 (Good) | 522 (Good) | 314 (Good) | 283 (Good) | 1 (Good) | 29 (Good) | 51 (Good) | 1 (Good) | 813 (Good) | 1 (Good) | 988 (Good) |
| o3 | 12 (Good) | 12 (Good) | 12 (Good) | 14 (Good) | 14 (Good) | 12 (Good) | 13 (Good) | 13 (Good) | 8.1 (Good) | 8.4 (Good) | 12 (Good) | 19 (Good) | 23 (Good) | 24 (Good) | 39 (Good) | 99 (Moderate) | 77 (Moderate) | 41 (Good) | 27 (Good) | 52 (Good) | 59 (Good) | 70 (Moderate) | 97 (Moderate) | 102 (Moderate) | 100 (Moderate) | 134 (Unhealthy for Sensitive Groups) |
NO2 47 (Moderat)
nitrogen dioksida (NO2)PM10 82 (Tidak sehat)
partikulat Matter (PM10) debu tersuspensiO3 52 (Bagus)
ozon (O3)PM2,5 12 (Bagus)
partikulat Matter (PM 2.5) debuSO2 12 (Bagus)
sulfur dioksida (SO2)PM10 289 (Sangat buruk berbahaya)
partikulat Matter (PM10) debu tersuspensiO3 24 (Bagus)
ozon (O3)PM2,5 120 (Sangat buruk berbahaya)
partikulat Matter (PM 2.5) debuSO2 14 (Bagus)
sulfur dioksida (SO2)CO 1050 (Bagus)
karbon monoksida (CO)NO2 11 (Bagus)
nitrogen dioksida (NO2)Chhoti Gwaltoli, Indore - MPPCB
| index | 2022-10-14 | 2022-10-13 | 2022-10-12 | 2022-10-11 | 2022-10-10 | 2022-10-09 | 2022-10-08 | 2022-10-07 |
|---|---|---|---|---|---|---|---|---|
| pm10 | 74 | 92 | 143 | 72 | 106 | 62 | 58 | 37 |
| no2 | 43 | 52 | 63 | 47 | 53 | 39 | 32 | 27 |
| pm25 | 19 | 27 | 43 | 29 | 33 | 23 | 24 | 19 |
| so2 | 13 | 14 | 17 | 12 | 15 | 14 | 13 | 11 |
| o3 | 42 | 33 | 38 | 31 | 24 | 26 | 28 | 20 |
Sector-2 Industrial Area, Pithampur - MPPCB
| index | 2022-10-31 |
|---|---|
| pm10 | 322 |
| o3 | 24 |
| pm25 | 116 |
| so2 | 14 |
| co | 1050 |
| no2 | 10 |
Sector-2 Industrial Area, Pithampur - MPPCB
| index | 2020-05 | 2020-04 | 2020-03 | 2020-02 | 2020-01 | 2019-12 | 2019-11 | 2019-10 | 2019-09 | 2019-08 | 2019-07 | 2019-06 | 2019-05 | 2019-04 | 2019-02 | 2018-11 | 2018-10 | 2018-09 | 2018-08 | 2018-05 | 2018-04 | 2018-03 | 2018-02 | 2018-01 | 2017-12 | 2017-11 |
|---|---|---|---|---|---|---|---|---|---|---|---|---|---|---|---|---|---|---|---|---|---|---|---|---|---|---|
| no2 | 8.5 | 9.6 | 12 | 18 | 17 | 18 | 17 | 11 | 8.4 | 4.4 | 6.5 | 8.5 | 7.2 | 7.5 | 21 | 15 | 14 | 7.2 | 5.1 | 7.2 | 8 | 15 | 19 | 18 | 20 | 18 |
| so2 | 12 | 10 | 11 | 18 | 15 | 14 | 24 | 13 | 5.7 | 4.9 | 3.9 | 5.5 | 15 | 12 | 43 | 20 | 18 | 9 | 8.8 | 16 | 14 | 20 | 22 | 23 | 33 | 40 |
| co | 633 | 1 | 1 | 1 | 921 | 547 | 642 | 499 | 395 | 276 | 313 | 352 | 267 | 273 | 659 | 599 | 522 | 314 | 283 | 1 | 29 | 51 | 1 | 813 | 1 | 988 |
| o3 | 12 | 12 | 12 | 14 | 14 | 12 | 13 | 13 | 8.1 | 8.4 | 12 | 19 | 23 | 24 | 39 | 99 | 77 | 41 | 27 | 52 | 59 | 70 | 97 | 102 | 100 | 134 |
| pm10 | 117 | 119 | 115 | 126 | 127 | 137 | 137 | 107 | 51 | 58 | 60 | 72 | 241 | 160 | 161 | 153 | 156 | 101 | 59 | 159 | 150 | 132 | 137 | 137 | 148 | 145 |
| pm25 | 23 | 40 | 31 | 50 | 63 | 77 | 71 | 48 | 21 | 21 | 18 | 25 | 48 | 34 | 73 | 71 | 51 | 30 | 20 | 41 | 64 | 87 | 49 | 67 | 84 | 68 |