Polusi udara di Valsad: indeks kualitas udara real-time dan siaga asap.
Perkiraan kualitas polusi dan udara untuk Valsad. Hari ini Rabu, 13 Mei 2026. Nilai polusi udara berikut telah tercatat untuk Valsad:- partikulat Matter (PM10) debu tersuspensi - 54 (Tidak sehat untuk kelompok sensitif)
- nitrogen dioksida (NO2) - 7 (Bagus)
- ozon (O3) - 0 (Bagus)
- partikulat Matter (PM 2.5) debu - 53 (Tidak sehat untuk kelompok sensitif)
- karbon monoksida (CO) - 900 (Bagus)
- sulfur dioksida (SO2) - 29 (Bagus)

Apa kualitas udara di Valsad hari ini? Apakah udara tercemar di Valsad?. Apakah ada Smog?
Apa tingkat PM10 hari ini di Valsad? (partikulat Matter (PM10) debu tersuspensi)
Level saat ini dari partikulat Matter PM10 di Valsad adalah:
54 (Tidak sehat untuk kelompok sensitif)
Nilai PM10 tertinggi biasanya terjadi di bulan: 187 (Januari 2020).
Nilai terendah dari partikulat PM10 pencemaran Valsad biasanya dicatat di: September (49).
Seberapa tinggi tingkat NO2? (nitrogen dioksida (NO2))
7 (Bagus)
Bagaimana tingkat O3 hari ini di Valsad? (ozon (O3))
0 (Bagus)
Apa tingkat saat PM 2,5 in Valsad? (partikulat Matter (PM 2.5) debu)
Hari ini PM 2.5 tingkat:
53 (Tidak sehat untuk kelompok sensitif)
Sebagai perbandingan, tingkat tertinggi PM 2,5 in Valsad dalam 7 hari terakhir adalah: 58 (Selasa, 11 Oktober 2022) dan Terendah: 22 (Sabtu, 8 Oktober 2022).
Nilai tertinggi PM 2.5 direkam: 129 (Januari 2020).
Tingkat terendah dari partikulat Matter PM 2.5 polusi terjadi di bulan: September (22).
Seberapa tinggi tingkat CO? (karbon monoksida (CO))
900 (Bagus)
Apa tingkat polusi SO2? (sulfur dioksida (SO2))
29 (Bagus)
Data saat ini Rabu, 12 Oktober 2022 04.45
PM10 54 (Tidak sehat untuk kelompok sensitif)
NO2 7 (Bagus)
O3 0 (Bagus)
PM2,5 53 (Tidak sehat untuk kelompok sensitif)
CO 900 (Bagus)
SO2 29 (Bagus)
Data tentang polusi udara dari beberapa hari terakhir di Valsad
index
2022-10-07
2022-10-08
2022-10-10
2022-10-11
2022-10-12
so2
28
Good
28
Good
28
Good
28
Good
29
Good
co
500
Good
400
Good
600
Good
550
Good
900
Good
pm10
63
Unhealthy for Sensitive Groups
24
Moderate
39
Moderate
67
Unhealthy for Sensitive Groups
54
Unhealthy for Sensitive Groups
no2
7
Good
8
Good
8
Good
8
Good
7
Good
o3
0
Good
0
Good
0
Good
0
Good
0
Good
pm25
56
Unhealthy
22
Moderate
25
Moderate
58
Unhealthy
53
Unhealthy for Sensitive Groups
data source »
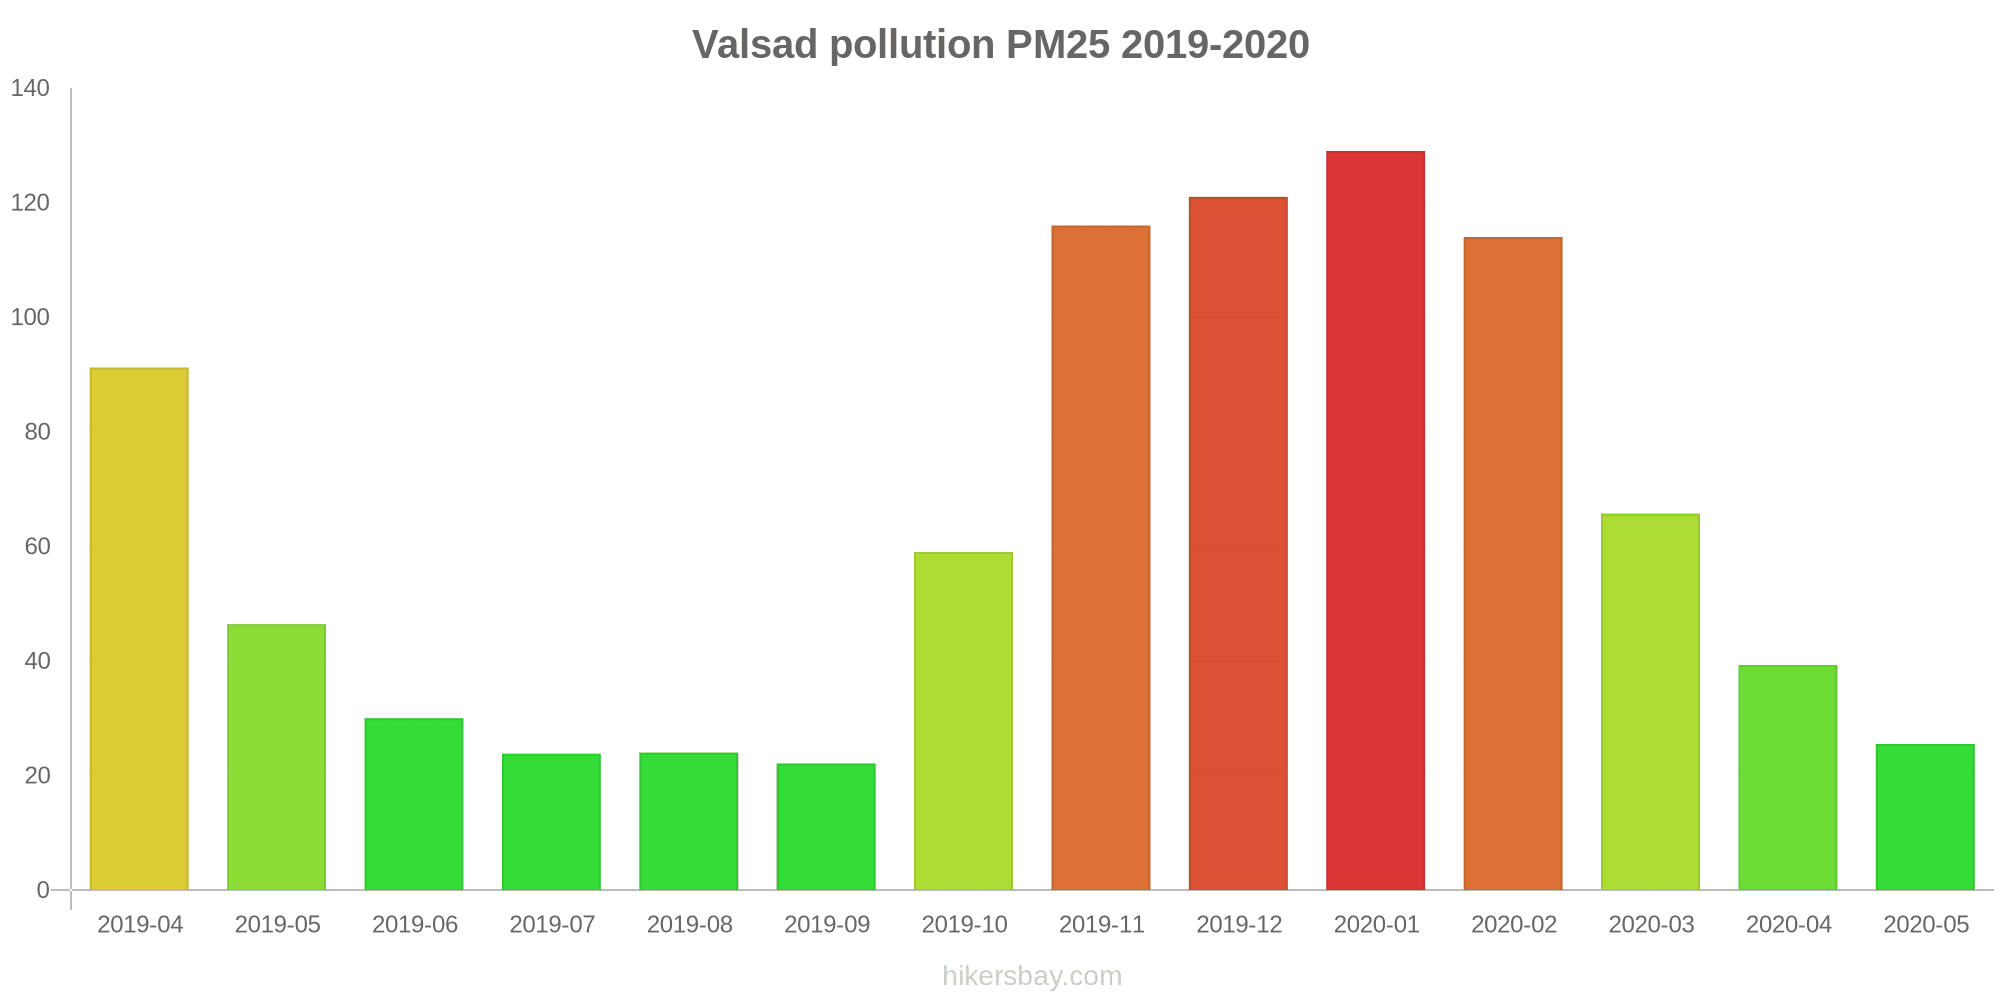
Polusi udara di Valsad dari April 2019 ke Mei 2020

index
2020-05
2020-04
2020-03
2020-02
2020-01
2019-12
2019-11
2019-10
2019-09
2019-08
2019-07
2019-06
2019-05
2019-04
pm25
26 (Moderate)
39 (Unhealthy for Sensitive Groups)
66 (Unhealthy)
114 (Very bad Hazardous)
129 (Very bad Hazardous)
121 (Very bad Hazardous)
116 (Very bad Hazardous)
59 (Unhealthy)
22 (Moderate)
24 (Moderate)
24 (Moderate)
30 (Moderate)
46 (Unhealthy for Sensitive Groups)
91 (Very Unhealthy)
pm10
55 (Unhealthy for Sensitive Groups)
70 (Unhealthy for Sensitive Groups)
115 (Very Unhealthy)
175 (Very bad Hazardous)
187 (Very bad Hazardous)
182 (Very bad Hazardous)
168 (Very bad Hazardous)
106 (Unhealthy)
49 (Moderate)
62 (Unhealthy for Sensitive Groups)
54 (Unhealthy for Sensitive Groups)
60 (Unhealthy for Sensitive Groups)
116 (Very Unhealthy)
178 (Very bad Hazardous)
no2
16 (Good)
16 (Good)
19 (Good)
18 (Good)
24 (Good)
25 (Good)
18 (Good)
9.1 (Good)
4.9 (Good)
4.1 (Good)
9.3 (Good)
24 (Good)
22 (Good)
36 (Good)
so2
21 (Good)
5.4 (Good)
18 (Good)
25 (Good)
53 (Moderate)
88 (Moderate)
46 (Good)
17 (Good)
4.5 (Good)
4.3 (Good)
18 (Good)
26 (Good)
25 (Good)
39 (Good)
co
421 (Good)
1 (Good)
1 (Good)
1 (Good)
1 (Good)
1 (Good)
1 (Good)
1 (Good)
490 (Good)
265 (Good)
374 (Good)
835 (Good)
419 (Good)
885 (Good)
o3
14 (Good)
25 (Good)
14 (Good)
5.5 (Good)
5.4 (Good)
5.3 (Good)
5.3 (Good)
3.8 (Good)
5 (Good)
0.85 (Good)
1.8 (Good)
5.7 (Good)
18 (Good)
32 (Good)
data source »
Kualitas hidup di Valsad
Hijau dan taman di kota
Valsad
38%
Nepal: 32%
Bangladesh: 33%
Bhutan: 82%
Sri Lanka: 59%
Pakistan: 49%
partikulat Matter PM 2.5
Valsad
54 (Unhealthy for Sensitive Groups)
Kenikmatan menghabiskan waktu di kota
Valsad
24%
Nepal: 32%
Bangladesh: 26%
Bhutan: 61%
Sri Lanka: 52%
Pakistan: 43%
partikulat Matter PM10
Valsad
100 (Unhealthy)
Polusi udara
Valsad
91%
Nepal: 76%
Bangladesh: 78%
Bhutan: 45%
Sri Lanka: 53%
Pakistan: 64%
Pembuangan sampah
Valsad
28%
Nepal: 25%
Bangladesh: 22%
Bhutan: 47%
Sri Lanka: 41%
Pakistan: 34%
Ketersediaan dan kualitas air minum
Valsad
34%
Nepal: 36%
Bangladesh: 44%
Bhutan: 64%
Sri Lanka: 65%
Pakistan: 44%
Kebersihan dan kerasnya
Valsad
30%
Nepal: 27%
Bangladesh: 23%
Bhutan: 57%
Sri Lanka: 52%
Pakistan: 40%
Kebisingan dan polusi cahaya
Valsad
39%
Nepal: 55%
Bangladesh: 63%
Bhutan: 55%
Sri Lanka: 50%
Pakistan: 59%
Polusi air
Valsad
69%
Nepal: 76%
Bangladesh: 74%
Bhutan: 56%
Sri Lanka: 57%
Pakistan: 70%
Source: Numbeo
Phase-1 GIDC, Vapi - GPCB
Rabu, 12 Oktober 2022 04.45
PM10 54 (Tidak sehat untuk kelompok sensitif)
partikulat Matter (PM10) debu tersuspensi
NO2 6.6 (Bagus)
nitrogen dioksida (NO2)
O3 0 (Bagus)
ozon (O3)
PM2,5 53 (Tidak sehat untuk kelompok sensitif)
partikulat Matter (PM 2.5) debu
CO 900 (Bagus)
karbon monoksida (CO)
SO2 29 (Bagus)
sulfur dioksida (SO2)
Phase-1 GIDC, Vapi - GPCB
index
2022-10-12
2022-10-11
2022-10-10
2022-10-08
2022-10-07
so2
29
28
28
28
28
co
900
550
600
400
500
pm10
54
67
39
24
63
no2
6.6
7.5
7.5
7.6
7.4
o3
0
0
0
0
0
pm25
53
58
25
22
56
Phase-1 GIDC, Vapi - GPCB
2019-04 2020-05

index
2020-05
2020-04
2020-03
2020-02
2020-01
2019-12
2019-11
2019-10
2019-09
2019-08
2019-07
2019-06
2019-05
2019-04
pm25
26
39
66
114
129
121
116
59
22
24
24
30
46
91
pm10
55
70
115
175
187
182
168
106
49
62
54
60
116
178
no2
16
16
19
18
24
25
18
9.1
4.9
4.1
9.3
24
22
36
so2
21
5.4
18
25
53
88
46
17
4.5
4.3
18
26
25
39
co
421
1
1
1
1
1
1
1
490
265
374
835
419
885
o3
14
25
14
5.5
5.4
5.3
5.3
3.8
5
0.85
1.8
5.7
18
32
* Pollution data source:
https://openaq.org
(caaqm)
The data is licensed under CC-By 4.0
PM10 54 (Tidak sehat untuk kelompok sensitif)
NO2 7 (Bagus)
O3 0 (Bagus)
PM2,5 53 (Tidak sehat untuk kelompok sensitif)
CO 900 (Bagus)
SO2 29 (Bagus)
Data tentang polusi udara dari beberapa hari terakhir di Valsad
| index | 2022-10-07 | 2022-10-08 | 2022-10-10 | 2022-10-11 | 2022-10-12 |
|---|---|---|---|---|---|
| so2 | 28 Good |
28 Good |
28 Good |
28 Good |
29 Good |
| co | 500 Good |
400 Good |
600 Good |
550 Good |
900 Good |
| pm10 | 63 Unhealthy for Sensitive Groups |
24 Moderate |
39 Moderate |
67 Unhealthy for Sensitive Groups |
54 Unhealthy for Sensitive Groups |
| no2 | 7 Good |
8 Good |
8 Good |
8 Good |
7 Good |
| o3 | 0 Good |
0 Good |
0 Good |
0 Good |
0 Good |
| pm25 | 56 Unhealthy |
22 Moderate |
25 Moderate |
58 Unhealthy |
53 Unhealthy for Sensitive Groups |
| index | 2020-05 | 2020-04 | 2020-03 | 2020-02 | 2020-01 | 2019-12 | 2019-11 | 2019-10 | 2019-09 | 2019-08 | 2019-07 | 2019-06 | 2019-05 | 2019-04 |
|---|---|---|---|---|---|---|---|---|---|---|---|---|---|---|
| pm25 | 26 (Moderate) | 39 (Unhealthy for Sensitive Groups) | 66 (Unhealthy) | 114 (Very bad Hazardous) | 129 (Very bad Hazardous) | 121 (Very bad Hazardous) | 116 (Very bad Hazardous) | 59 (Unhealthy) | 22 (Moderate) | 24 (Moderate) | 24 (Moderate) | 30 (Moderate) | 46 (Unhealthy for Sensitive Groups) | 91 (Very Unhealthy) |
| pm10 | 55 (Unhealthy for Sensitive Groups) | 70 (Unhealthy for Sensitive Groups) | 115 (Very Unhealthy) | 175 (Very bad Hazardous) | 187 (Very bad Hazardous) | 182 (Very bad Hazardous) | 168 (Very bad Hazardous) | 106 (Unhealthy) | 49 (Moderate) | 62 (Unhealthy for Sensitive Groups) | 54 (Unhealthy for Sensitive Groups) | 60 (Unhealthy for Sensitive Groups) | 116 (Very Unhealthy) | 178 (Very bad Hazardous) |
| no2 | 16 (Good) | 16 (Good) | 19 (Good) | 18 (Good) | 24 (Good) | 25 (Good) | 18 (Good) | 9.1 (Good) | 4.9 (Good) | 4.1 (Good) | 9.3 (Good) | 24 (Good) | 22 (Good) | 36 (Good) |
| so2 | 21 (Good) | 5.4 (Good) | 18 (Good) | 25 (Good) | 53 (Moderate) | 88 (Moderate) | 46 (Good) | 17 (Good) | 4.5 (Good) | 4.3 (Good) | 18 (Good) | 26 (Good) | 25 (Good) | 39 (Good) |
| co | 421 (Good) | 1 (Good) | 1 (Good) | 1 (Good) | 1 (Good) | 1 (Good) | 1 (Good) | 1 (Good) | 490 (Good) | 265 (Good) | 374 (Good) | 835 (Good) | 419 (Good) | 885 (Good) |
| o3 | 14 (Good) | 25 (Good) | 14 (Good) | 5.5 (Good) | 5.4 (Good) | 5.3 (Good) | 5.3 (Good) | 3.8 (Good) | 5 (Good) | 0.85 (Good) | 1.8 (Good) | 5.7 (Good) | 18 (Good) | 32 (Good) |
Hijau dan taman di kota
Valsad 38%
Nepal: 32% Bangladesh: 33% Bhutan: 82% Sri Lanka: 59% Pakistan: 49%partikulat Matter PM 2.5
Valsad 54 (Unhealthy for Sensitive Groups)
Kenikmatan menghabiskan waktu di kota
Valsad 24%
Nepal: 32% Bangladesh: 26% Bhutan: 61% Sri Lanka: 52% Pakistan: 43%partikulat Matter PM10
Valsad 100 (Unhealthy)
Polusi udara
Valsad 91%
Nepal: 76% Bangladesh: 78% Bhutan: 45% Sri Lanka: 53% Pakistan: 64%Pembuangan sampah
Valsad 28%
Nepal: 25% Bangladesh: 22% Bhutan: 47% Sri Lanka: 41% Pakistan: 34%Ketersediaan dan kualitas air minum
Valsad 34%
Nepal: 36% Bangladesh: 44% Bhutan: 64% Sri Lanka: 65% Pakistan: 44%Kebersihan dan kerasnya
Valsad 30%
Nepal: 27% Bangladesh: 23% Bhutan: 57% Sri Lanka: 52% Pakistan: 40%Kebisingan dan polusi cahaya
Valsad 39%
Nepal: 55% Bangladesh: 63% Bhutan: 55% Sri Lanka: 50% Pakistan: 59%Polusi air
Valsad 69%
Nepal: 76% Bangladesh: 74% Bhutan: 56% Sri Lanka: 57% Pakistan: 70%PM10 54 (Tidak sehat untuk kelompok sensitif)
partikulat Matter (PM10) debu tersuspensiNO2 6.6 (Bagus)
nitrogen dioksida (NO2)O3 0 (Bagus)
ozon (O3)PM2,5 53 (Tidak sehat untuk kelompok sensitif)
partikulat Matter (PM 2.5) debuCO 900 (Bagus)
karbon monoksida (CO)SO2 29 (Bagus)
sulfur dioksida (SO2)Phase-1 GIDC, Vapi - GPCB
| index | 2022-10-12 | 2022-10-11 | 2022-10-10 | 2022-10-08 | 2022-10-07 |
|---|---|---|---|---|---|
| so2 | 29 | 28 | 28 | 28 | 28 |
| co | 900 | 550 | 600 | 400 | 500 |
| pm10 | 54 | 67 | 39 | 24 | 63 |
| no2 | 6.6 | 7.5 | 7.5 | 7.6 | 7.4 |
| o3 | 0 | 0 | 0 | 0 | 0 |
| pm25 | 53 | 58 | 25 | 22 | 56 |
Phase-1 GIDC, Vapi - GPCB

| index | 2020-05 | 2020-04 | 2020-03 | 2020-02 | 2020-01 | 2019-12 | 2019-11 | 2019-10 | 2019-09 | 2019-08 | 2019-07 | 2019-06 | 2019-05 | 2019-04 |
|---|---|---|---|---|---|---|---|---|---|---|---|---|---|---|
| pm25 | 26 | 39 | 66 | 114 | 129 | 121 | 116 | 59 | 22 | 24 | 24 | 30 | 46 | 91 |
| pm10 | 55 | 70 | 115 | 175 | 187 | 182 | 168 | 106 | 49 | 62 | 54 | 60 | 116 | 178 |
| no2 | 16 | 16 | 19 | 18 | 24 | 25 | 18 | 9.1 | 4.9 | 4.1 | 9.3 | 24 | 22 | 36 |
| so2 | 21 | 5.4 | 18 | 25 | 53 | 88 | 46 | 17 | 4.5 | 4.3 | 18 | 26 | 25 | 39 |
| co | 421 | 1 | 1 | 1 | 1 | 1 | 1 | 1 | 490 | 265 | 374 | 835 | 419 | 885 |
| o3 | 14 | 25 | 14 | 5.5 | 5.4 | 5.3 | 5.3 | 3.8 | 5 | 0.85 | 1.8 | 5.7 | 18 | 32 |