Polusi udara di Bāspalli: indeks kualitas udara real-time dan siaga asap.
Perkiraan kualitas polusi dan udara untuk Bāspalli. Hari ini Rabu, 13 Mei 2026. Nilai polusi udara berikut telah tercatat untuk Bāspalli:- karbon monoksida (CO) - 2670 (Moderat)
- partikulat Matter (PM 2.5) debu - 83 (Sangat tidak sehat)
- sulfur dioksida (SO2) - 21 (Bagus)
- partikulat Matter (PM10) debu tersuspensi - 135 (Sangat tidak sehat)
- ozon (O3) - 1 (Bagus)
- nitrogen dioksida (NO2) - 29 (Bagus)

Apa kualitas udara di Bāspalli hari ini? Apakah udara tercemar di Bāspalli?. Apakah ada Smog?
Seberapa tinggi tingkat CO? (karbon monoksida (CO))
2670 (Moderat)
Apa tingkat saat PM 2,5 in Bāspalli? (partikulat Matter (PM 2.5) debu)
Hari ini PM 2.5 tingkat:
83 (Sangat tidak sehat)
Sebagai perbandingan, tingkat tertinggi PM 2,5 in Bāspalli dalam 7 hari terakhir adalah: 82 (Senin, 31 Oktober 2022) dan Terendah: 82 (Senin, 31 Oktober 2022).
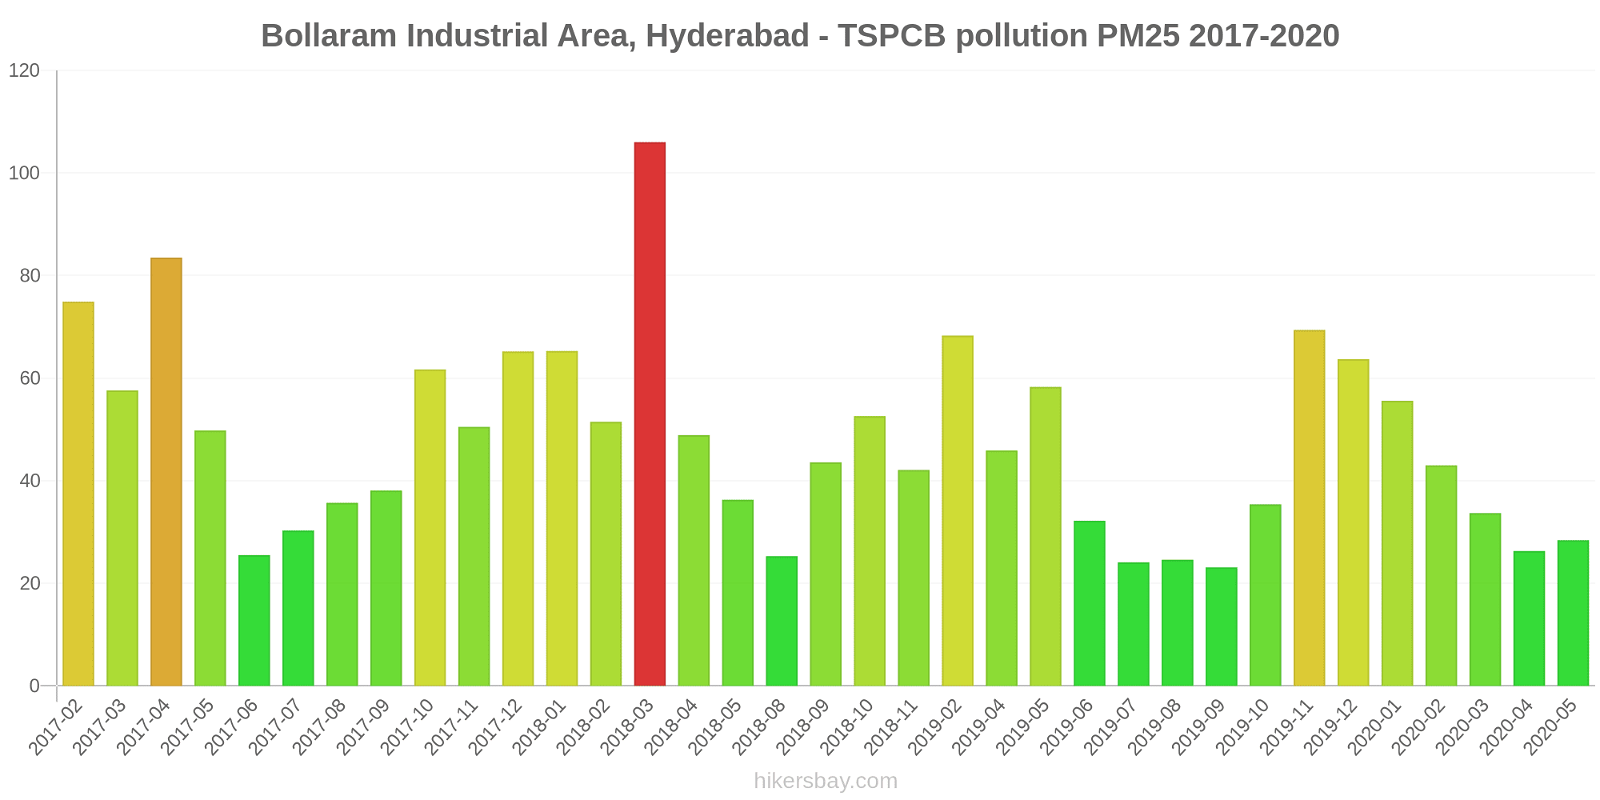
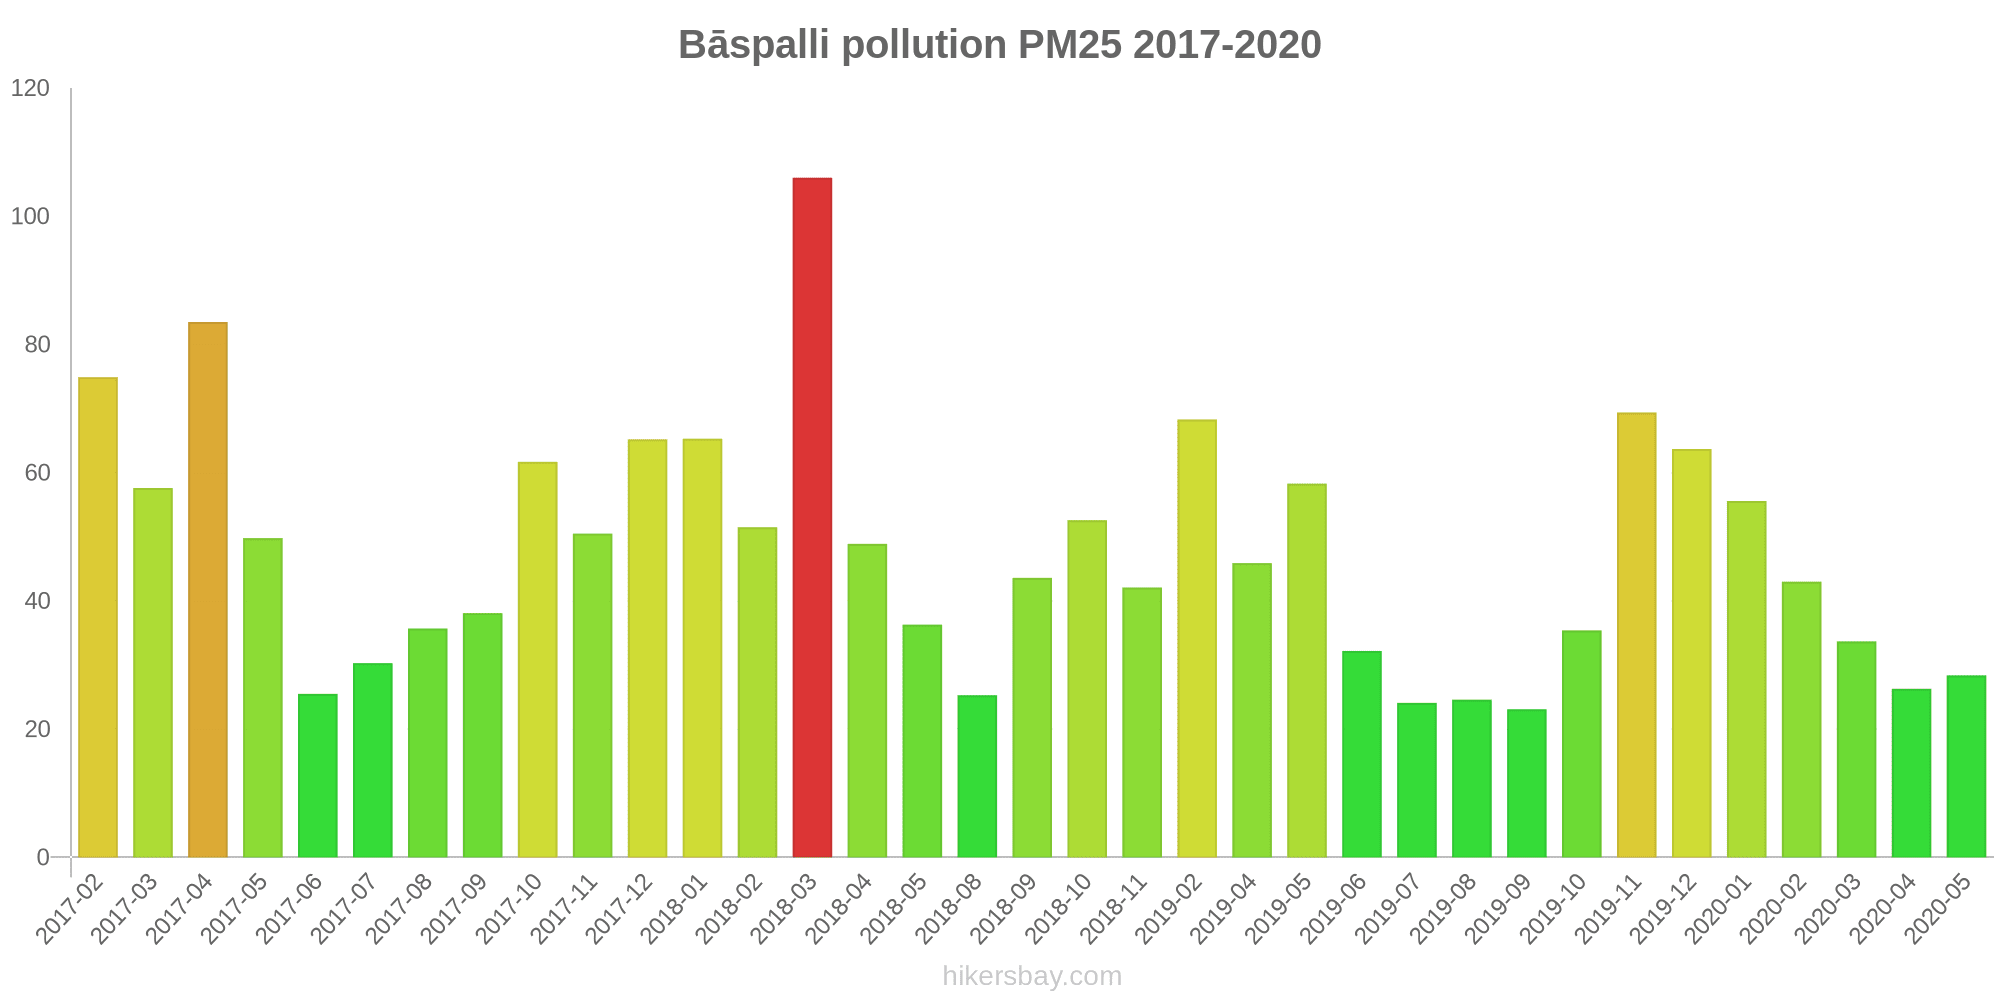
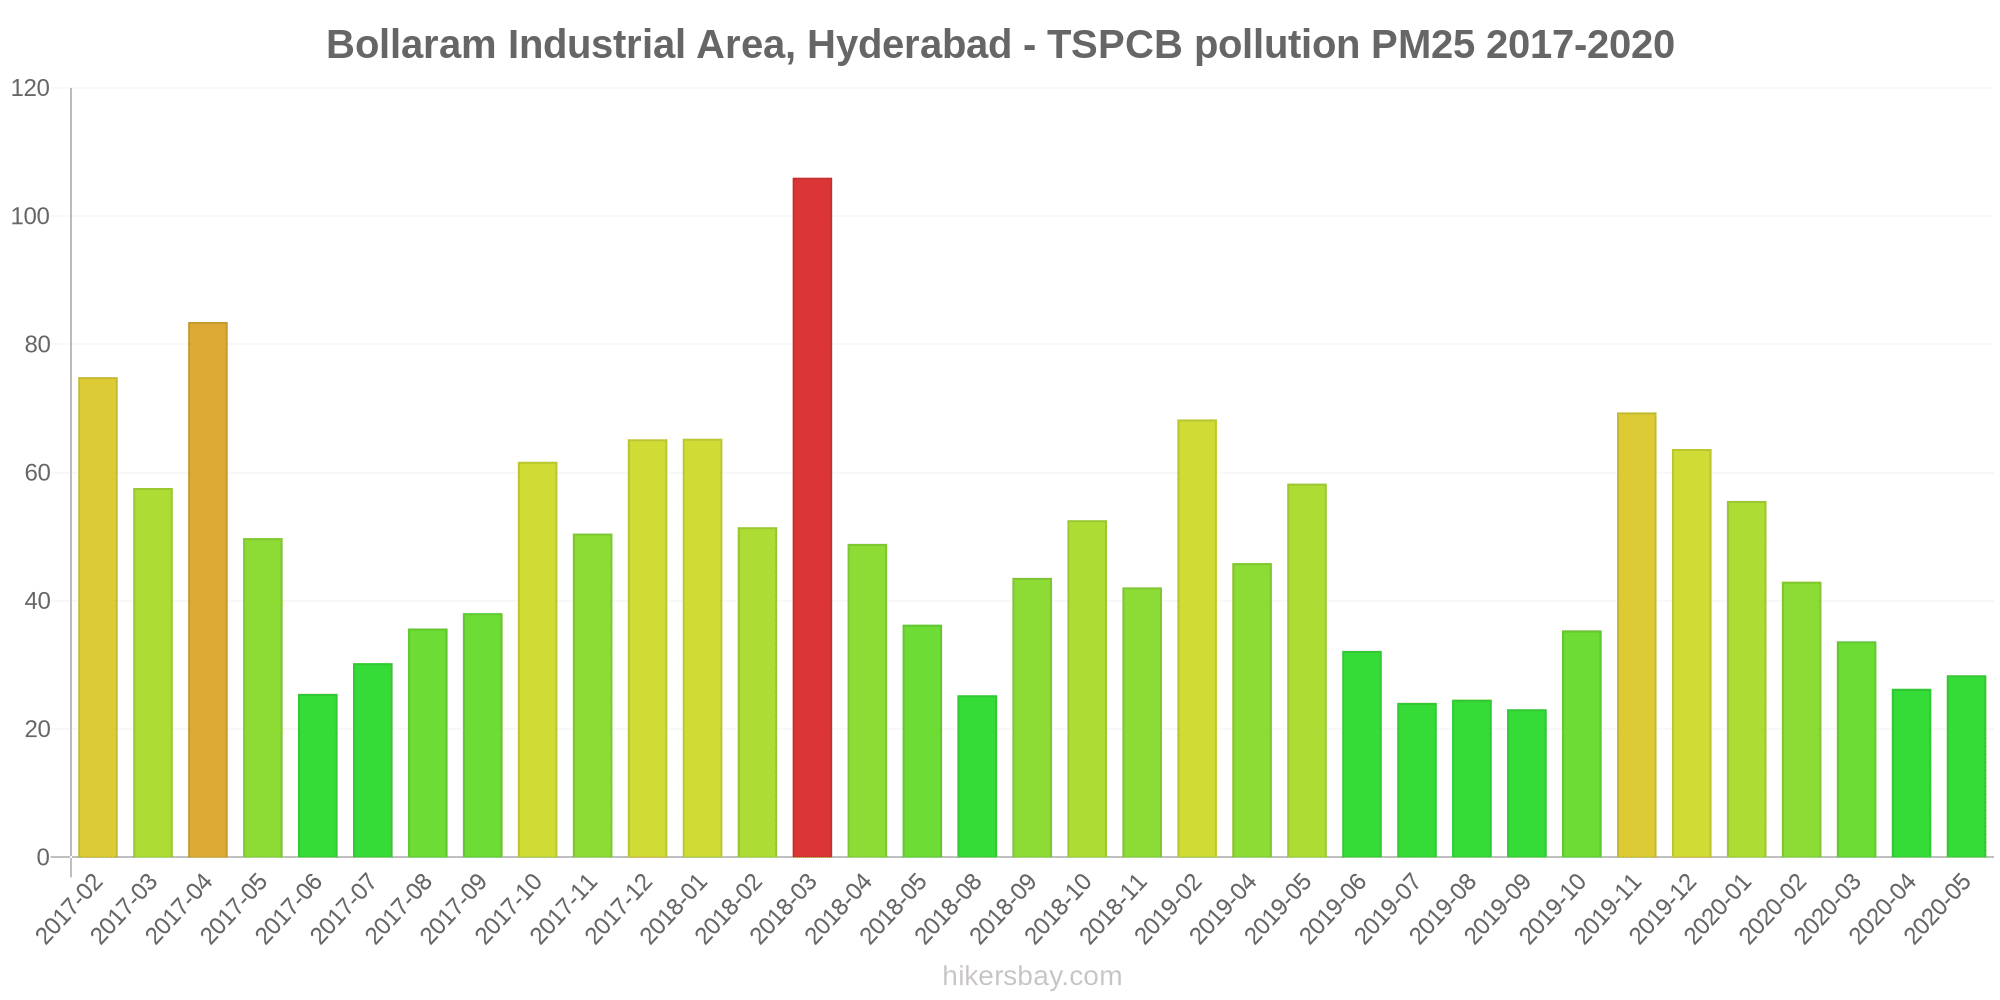
Nilai tertinggi PM 2.5 direkam: 106 (Maret 2018).
Tingkat terendah dari partikulat Matter PM 2.5 polusi terjadi di bulan: September (23).
Apa tingkat polusi SO2? (sulfur dioksida (SO2))
21 (Bagus)
Apa tingkat PM10 hari ini di Bāspalli? (partikulat Matter (PM10) debu tersuspensi)
Level saat ini dari partikulat Matter PM10 di Bāspalli adalah:
135 (Sangat tidak sehat)
Nilai PM10 tertinggi biasanya terjadi di bulan: 200 (April 2017).
Nilai terendah dari partikulat PM10 pencemaran Bāspalli biasanya dicatat di: September (55).
Bagaimana tingkat O3 hari ini di Bāspalli? (ozon (O3))
1 (Bagus)
Seberapa tinggi tingkat NO2? (nitrogen dioksida (NO2))
29 (Bagus)
Data saat ini Senin, 31 Oktober 2022 02.00
CO 2670 (Moderat)
PM2,5 83 (Sangat tidak sehat)
SO2 21 (Bagus)
PM10 135 (Sangat tidak sehat)
O3 1 (Bagus)
NO2 29 (Bagus)
Data tentang polusi udara dari beberapa hari terakhir di Bāspalli
index
2022-10-31
co
2095
Moderate
pm25
82
Very Unhealthy
so2
11
Good
pm10
129
Very Unhealthy
o3
5
Good
no2
29
Good
data source »
Polusi udara di Bāspalli dari Februari 2017 ke Mei 2020

index
2020-05
2020-04
2020-03
2020-02
2020-01
2019-12
2019-11
2019-10
2019-09
2019-08
2019-07
2019-06
2019-05
2019-04
2019-02
2018-11
2018-10
2018-09
2018-08
2018-05
2018-04
2018-03
2018-02
2018-01
2017-12
2017-11
2017-10
2017-09
2017-08
2017-07
2017-06
2017-05
2017-04
2017-03
2017-02
pm25
28 (Moderate)
26 (Moderate)
34 (Moderate)
43 (Unhealthy for Sensitive Groups)
56 (Unhealthy)
64 (Unhealthy)
69 (Unhealthy)
35 (Unhealthy for Sensitive Groups)
23 (Moderate)
25 (Moderate)
24 (Moderate)
32 (Moderate)
58 (Unhealthy)
46 (Unhealthy for Sensitive Groups)
68 (Unhealthy)
42 (Unhealthy for Sensitive Groups)
53 (Unhealthy for Sensitive Groups)
44 (Unhealthy for Sensitive Groups)
25 (Moderate)
36 (Unhealthy for Sensitive Groups)
49 (Unhealthy for Sensitive Groups)
106 (Very Unhealthy)
52 (Unhealthy for Sensitive Groups)
65 (Unhealthy)
65 (Unhealthy)
51 (Unhealthy for Sensitive Groups)
62 (Unhealthy)
38 (Unhealthy for Sensitive Groups)
36 (Unhealthy for Sensitive Groups)
30 (Moderate)
26 (Moderate)
50 (Unhealthy for Sensitive Groups)
84 (Very Unhealthy)
58 (Unhealthy)
75 (Unhealthy)
pm10
69 (Unhealthy for Sensitive Groups)
55 (Unhealthy for Sensitive Groups)
80 (Unhealthy for Sensitive Groups)
102 (Unhealthy)
107 (Unhealthy)
122 (Very Unhealthy)
141 (Very Unhealthy)
74 (Unhealthy for Sensitive Groups)
55 (Unhealthy for Sensitive Groups)
71 (Unhealthy for Sensitive Groups)
65 (Unhealthy for Sensitive Groups)
61 (Unhealthy for Sensitive Groups)
159 (Very bad Hazardous)
124 (Very Unhealthy)
133 (Very Unhealthy)
86 (Unhealthy)
99 (Unhealthy)
93 (Unhealthy)
68 (Unhealthy for Sensitive Groups)
103 (Unhealthy)
106 (Unhealthy)
115 (Very Unhealthy)
122 (Very Unhealthy)
137 (Very Unhealthy)
123 (Very Unhealthy)
100 (Unhealthy)
121 (Very Unhealthy)
85 (Unhealthy)
83 (Unhealthy)
74 (Unhealthy for Sensitive Groups)
63 (Unhealthy for Sensitive Groups)
124 (Very Unhealthy)
200 (Very bad Hazardous)
134 (Very Unhealthy)
167 (Very bad Hazardous)
no2
18 (Good)
16 (Good)
22 (Good)
27 (Good)
29 (Good)
34 (Good)
34 (Good)
24 (Good)
23 (Good)
31 (Good)
27 (Good)
26 (Good)
33 (Good)
27 (Good)
24 (Good)
18 (Good)
19 (Good)
17 (Good)
13 (Good)
24 (Good)
30 (Good)
38 (Good)
35 (Good)
35 (Good)
36 (Good)
27 (Good)
28 (Good)
19 (Good)
15 (Good)
17 (Good)
19 (Good)
22 (Good)
35 (Good)
27 (Good)
38 (Good)
so2
14 (Good)
9 (Good)
17 (Good)
18 (Good)
13 (Good)
6.7 (Good)
10 (Good)
14 (Good)
23 (Good)
31 (Good)
22 (Good)
9 (Good)
18 (Good)
5.3 (Good)
12 (Good)
9.4 (Good)
13 (Good)
15 (Good)
18 (Good)
30 (Good)
28 (Good)
13 (Good)
14 (Good)
17 (Good)
14 (Good)
22 (Good)
39 (Good)
30 (Good)
37 (Good)
42 (Good)
39 (Good)
38 (Good)
57 (Moderate)
33 (Good)
64 (Moderate)
co
363 (Good)
329 (Good)
372 (Good)
419 (Good)
496 (Good)
576 (Good)
604 (Good)
517 (Good)
449 (Good)
347 (Good)
302 (Good)
389 (Good)
651 (Good)
550 (Good)
666 (Good)
452 (Good)
442 (Good)
426 (Good)
285 (Good)
413 (Good)
6 (Good)
37 (Good)
637 (Good)
743 (Good)
736 (Good)
514 (Good)
802 (Good)
413 (Good)
545 (Good)
246 (Good)
276 (Good)
505 (Good)
898 (Good)
832 (Good)
1 (Good)
o3
27 (Good)
29 (Good)
26 (Good)
29 (Good)
31 (Good)
34 (Good)
44 (Good)
31 (Good)
24 (Good)
23 (Good)
20 (Good)
19 (Good)
24 (Good)
36 (Good)
17 (Good)
20 (Good)
21 (Good)
12 (Good)
7.2 (Good)
43 (Good)
40 (Good)
37 (Good)
- (Good)
- (Good)
- (Good)
- (Good)
- (Good)
- (Good)
- (Good)
- (Good)
- (Good)
- (Good)
- (Good)
- (Good)
- (Good)
data source »
Bollaram Industrial Area, Hyderabad - TSPCB
Senin, 31 Oktober 2022 02.00
CO 2670 (Moderat)
karbon monoksida (CO)
PM2,5 83 (Sangat tidak sehat)
partikulat Matter (PM 2.5) debu
SO2 21 (Bagus)
sulfur dioksida (SO2)
PM10 135 (Sangat tidak sehat)
partikulat Matter (PM10) debu tersuspensi
O3 0.7 (Bagus)
ozon (O3)
NO2 29 (Bagus)
nitrogen dioksida (NO2)
Bollaram Industrial Area, Hyderabad - TSPCB
index
2022-10-31
co
2095
pm25
82
so2
11
pm10
129
o3
4.8
no2
29
Bollaram Industrial Area, Hyderabad - TSPCB
2017-02 2020-05
index
2020-05
2020-04
2020-03
2020-02
2020-01
2019-12
2019-11
2019-10
2019-09
2019-08
2019-07
2019-06
2019-05
2019-04
2019-02
2018-11
2018-10
2018-09
2018-08
2018-05
2018-04
2018-03
2018-02
2018-01
2017-12
2017-11
2017-10
2017-09
2017-08
2017-07
2017-06
2017-05
2017-04
2017-03
2017-02
pm25
28
26
34
43
56
64
69
35
23
25
24
32
58
46
68
42
53
44
25
36
49
106
52
65
65
51
62
38
36
30
26
50
84
58
75
co
363
329
372
419
496
576
604
517
449
347
302
389
651
550
666
452
442
426
285
413
6
37
637
743
736
514
802
413
545
246
276
505
898
832
1
so2
14
9
17
18
13
6.7
10
14
23
31
22
9
18
5.3
12
9.4
13
15
18
30
28
13
14
17
14
22
39
30
37
42
39
38
57
33
64
pm10
69
55
80
102
107
122
141
74
55
71
65
61
159
124
133
86
99
93
68
103
106
115
122
137
123
100
121
85
83
74
63
124
200
134
167
no2
18
16
22
27
29
34
34
24
23
31
27
26
33
27
24
18
19
17
13
24
30
38
35
35
36
27
28
19
15
17
19
22
35
27
38
o3
27
29
26
29
31
34
44
31
24
23
20
19
24
36
17
20
21
12
7.2
43
40
37
-
-
-
-
-
-
-
-
-
-
-
-
-
* Pollution data source:
https://openaq.org
(caaqm)
The data is licensed under CC-By 4.0
CO 2670 (Moderat)
PM2,5 83 (Sangat tidak sehat)
SO2 21 (Bagus)
PM10 135 (Sangat tidak sehat)
O3 1 (Bagus)
NO2 29 (Bagus)
Data tentang polusi udara dari beberapa hari terakhir di Bāspalli
| index | 2022-10-31 |
|---|---|
| co | 2095 Moderate |
| pm25 | 82 Very Unhealthy |
| so2 | 11 Good |
| pm10 | 129 Very Unhealthy |
| o3 | 5 Good |
| no2 | 29 Good |
| index | 2020-05 | 2020-04 | 2020-03 | 2020-02 | 2020-01 | 2019-12 | 2019-11 | 2019-10 | 2019-09 | 2019-08 | 2019-07 | 2019-06 | 2019-05 | 2019-04 | 2019-02 | 2018-11 | 2018-10 | 2018-09 | 2018-08 | 2018-05 | 2018-04 | 2018-03 | 2018-02 | 2018-01 | 2017-12 | 2017-11 | 2017-10 | 2017-09 | 2017-08 | 2017-07 | 2017-06 | 2017-05 | 2017-04 | 2017-03 | 2017-02 |
|---|---|---|---|---|---|---|---|---|---|---|---|---|---|---|---|---|---|---|---|---|---|---|---|---|---|---|---|---|---|---|---|---|---|---|---|
| pm25 | 28 (Moderate) | 26 (Moderate) | 34 (Moderate) | 43 (Unhealthy for Sensitive Groups) | 56 (Unhealthy) | 64 (Unhealthy) | 69 (Unhealthy) | 35 (Unhealthy for Sensitive Groups) | 23 (Moderate) | 25 (Moderate) | 24 (Moderate) | 32 (Moderate) | 58 (Unhealthy) | 46 (Unhealthy for Sensitive Groups) | 68 (Unhealthy) | 42 (Unhealthy for Sensitive Groups) | 53 (Unhealthy for Sensitive Groups) | 44 (Unhealthy for Sensitive Groups) | 25 (Moderate) | 36 (Unhealthy for Sensitive Groups) | 49 (Unhealthy for Sensitive Groups) | 106 (Very Unhealthy) | 52 (Unhealthy for Sensitive Groups) | 65 (Unhealthy) | 65 (Unhealthy) | 51 (Unhealthy for Sensitive Groups) | 62 (Unhealthy) | 38 (Unhealthy for Sensitive Groups) | 36 (Unhealthy for Sensitive Groups) | 30 (Moderate) | 26 (Moderate) | 50 (Unhealthy for Sensitive Groups) | 84 (Very Unhealthy) | 58 (Unhealthy) | 75 (Unhealthy) |
| pm10 | 69 (Unhealthy for Sensitive Groups) | 55 (Unhealthy for Sensitive Groups) | 80 (Unhealthy for Sensitive Groups) | 102 (Unhealthy) | 107 (Unhealthy) | 122 (Very Unhealthy) | 141 (Very Unhealthy) | 74 (Unhealthy for Sensitive Groups) | 55 (Unhealthy for Sensitive Groups) | 71 (Unhealthy for Sensitive Groups) | 65 (Unhealthy for Sensitive Groups) | 61 (Unhealthy for Sensitive Groups) | 159 (Very bad Hazardous) | 124 (Very Unhealthy) | 133 (Very Unhealthy) | 86 (Unhealthy) | 99 (Unhealthy) | 93 (Unhealthy) | 68 (Unhealthy for Sensitive Groups) | 103 (Unhealthy) | 106 (Unhealthy) | 115 (Very Unhealthy) | 122 (Very Unhealthy) | 137 (Very Unhealthy) | 123 (Very Unhealthy) | 100 (Unhealthy) | 121 (Very Unhealthy) | 85 (Unhealthy) | 83 (Unhealthy) | 74 (Unhealthy for Sensitive Groups) | 63 (Unhealthy for Sensitive Groups) | 124 (Very Unhealthy) | 200 (Very bad Hazardous) | 134 (Very Unhealthy) | 167 (Very bad Hazardous) |
| no2 | 18 (Good) | 16 (Good) | 22 (Good) | 27 (Good) | 29 (Good) | 34 (Good) | 34 (Good) | 24 (Good) | 23 (Good) | 31 (Good) | 27 (Good) | 26 (Good) | 33 (Good) | 27 (Good) | 24 (Good) | 18 (Good) | 19 (Good) | 17 (Good) | 13 (Good) | 24 (Good) | 30 (Good) | 38 (Good) | 35 (Good) | 35 (Good) | 36 (Good) | 27 (Good) | 28 (Good) | 19 (Good) | 15 (Good) | 17 (Good) | 19 (Good) | 22 (Good) | 35 (Good) | 27 (Good) | 38 (Good) |
| so2 | 14 (Good) | 9 (Good) | 17 (Good) | 18 (Good) | 13 (Good) | 6.7 (Good) | 10 (Good) | 14 (Good) | 23 (Good) | 31 (Good) | 22 (Good) | 9 (Good) | 18 (Good) | 5.3 (Good) | 12 (Good) | 9.4 (Good) | 13 (Good) | 15 (Good) | 18 (Good) | 30 (Good) | 28 (Good) | 13 (Good) | 14 (Good) | 17 (Good) | 14 (Good) | 22 (Good) | 39 (Good) | 30 (Good) | 37 (Good) | 42 (Good) | 39 (Good) | 38 (Good) | 57 (Moderate) | 33 (Good) | 64 (Moderate) |
| co | 363 (Good) | 329 (Good) | 372 (Good) | 419 (Good) | 496 (Good) | 576 (Good) | 604 (Good) | 517 (Good) | 449 (Good) | 347 (Good) | 302 (Good) | 389 (Good) | 651 (Good) | 550 (Good) | 666 (Good) | 452 (Good) | 442 (Good) | 426 (Good) | 285 (Good) | 413 (Good) | 6 (Good) | 37 (Good) | 637 (Good) | 743 (Good) | 736 (Good) | 514 (Good) | 802 (Good) | 413 (Good) | 545 (Good) | 246 (Good) | 276 (Good) | 505 (Good) | 898 (Good) | 832 (Good) | 1 (Good) |
| o3 | 27 (Good) | 29 (Good) | 26 (Good) | 29 (Good) | 31 (Good) | 34 (Good) | 44 (Good) | 31 (Good) | 24 (Good) | 23 (Good) | 20 (Good) | 19 (Good) | 24 (Good) | 36 (Good) | 17 (Good) | 20 (Good) | 21 (Good) | 12 (Good) | 7.2 (Good) | 43 (Good) | 40 (Good) | 37 (Good) | - (Good) | - (Good) | - (Good) | - (Good) | - (Good) | - (Good) | - (Good) | - (Good) | - (Good) | - (Good) | - (Good) | - (Good) | - (Good) |
CO 2670 (Moderat)
karbon monoksida (CO)PM2,5 83 (Sangat tidak sehat)
partikulat Matter (PM 2.5) debuSO2 21 (Bagus)
sulfur dioksida (SO2)PM10 135 (Sangat tidak sehat)
partikulat Matter (PM10) debu tersuspensiO3 0.7 (Bagus)
ozon (O3)NO2 29 (Bagus)
nitrogen dioksida (NO2)Bollaram Industrial Area, Hyderabad - TSPCB
| index | 2022-10-31 |
|---|---|
| co | 2095 |
| pm25 | 82 |
| so2 | 11 |
| pm10 | 129 |
| o3 | 4.8 |
| no2 | 29 |
Bollaram Industrial Area, Hyderabad - TSPCB
| index | 2020-05 | 2020-04 | 2020-03 | 2020-02 | 2020-01 | 2019-12 | 2019-11 | 2019-10 | 2019-09 | 2019-08 | 2019-07 | 2019-06 | 2019-05 | 2019-04 | 2019-02 | 2018-11 | 2018-10 | 2018-09 | 2018-08 | 2018-05 | 2018-04 | 2018-03 | 2018-02 | 2018-01 | 2017-12 | 2017-11 | 2017-10 | 2017-09 | 2017-08 | 2017-07 | 2017-06 | 2017-05 | 2017-04 | 2017-03 | 2017-02 |
|---|---|---|---|---|---|---|---|---|---|---|---|---|---|---|---|---|---|---|---|---|---|---|---|---|---|---|---|---|---|---|---|---|---|---|---|
| pm25 | 28 | 26 | 34 | 43 | 56 | 64 | 69 | 35 | 23 | 25 | 24 | 32 | 58 | 46 | 68 | 42 | 53 | 44 | 25 | 36 | 49 | 106 | 52 | 65 | 65 | 51 | 62 | 38 | 36 | 30 | 26 | 50 | 84 | 58 | 75 |
| co | 363 | 329 | 372 | 419 | 496 | 576 | 604 | 517 | 449 | 347 | 302 | 389 | 651 | 550 | 666 | 452 | 442 | 426 | 285 | 413 | 6 | 37 | 637 | 743 | 736 | 514 | 802 | 413 | 545 | 246 | 276 | 505 | 898 | 832 | 1 |
| so2 | 14 | 9 | 17 | 18 | 13 | 6.7 | 10 | 14 | 23 | 31 | 22 | 9 | 18 | 5.3 | 12 | 9.4 | 13 | 15 | 18 | 30 | 28 | 13 | 14 | 17 | 14 | 22 | 39 | 30 | 37 | 42 | 39 | 38 | 57 | 33 | 64 |
| pm10 | 69 | 55 | 80 | 102 | 107 | 122 | 141 | 74 | 55 | 71 | 65 | 61 | 159 | 124 | 133 | 86 | 99 | 93 | 68 | 103 | 106 | 115 | 122 | 137 | 123 | 100 | 121 | 85 | 83 | 74 | 63 | 124 | 200 | 134 | 167 |
| no2 | 18 | 16 | 22 | 27 | 29 | 34 | 34 | 24 | 23 | 31 | 27 | 26 | 33 | 27 | 24 | 18 | 19 | 17 | 13 | 24 | 30 | 38 | 35 | 35 | 36 | 27 | 28 | 19 | 15 | 17 | 19 | 22 | 35 | 27 | 38 |
| o3 | 27 | 29 | 26 | 29 | 31 | 34 | 44 | 31 | 24 | 23 | 20 | 19 | 24 | 36 | 17 | 20 | 21 | 12 | 7.2 | 43 | 40 | 37 | - | - | - | - | - | - | - | - | - | - | - | - | - |