Polusi udara di Gulla Bāwdi: indeks kualitas udara real-time dan siaga asap.
Perkiraan kualitas polusi dan udara untuk Gulla Bāwdi. Hari ini Kamis, 14 Mei 2026. Nilai polusi udara berikut telah tercatat untuk Gulla Bāwdi:- sulfur dioksida (SO2) - 31 (Bagus)
- karbon monoksida (CO) - 350 (Bagus)
- ozon (O3) - 7 (Bagus)
- partikulat Matter (PM 2.5) debu - 54 (Tidak sehat untuk kelompok sensitif)

Apa kualitas udara di Gulla Bāwdi hari ini? Apakah udara tercemar di Gulla Bāwdi?. Apakah ada Smog?
Apa tingkat polusi SO2? (sulfur dioksida (SO2))
31 (Bagus)
Seberapa tinggi tingkat CO? (karbon monoksida (CO))
350 (Bagus)
Bagaimana tingkat O3 hari ini di Gulla Bāwdi? (ozon (O3))
7 (Bagus)
Apa tingkat saat PM 2,5 in Gulla Bāwdi? (partikulat Matter (PM 2.5) debu)
Hari ini PM 2.5 tingkat:
54 (Tidak sehat untuk kelompok sensitif)
Sebagai perbandingan, tingkat tertinggi PM 2,5 in Gulla Bāwdi dalam 7 hari terakhir adalah: 54 (Senin, 31 Oktober 2022) dan Terendah: 54 (Senin, 31 Oktober 2022).
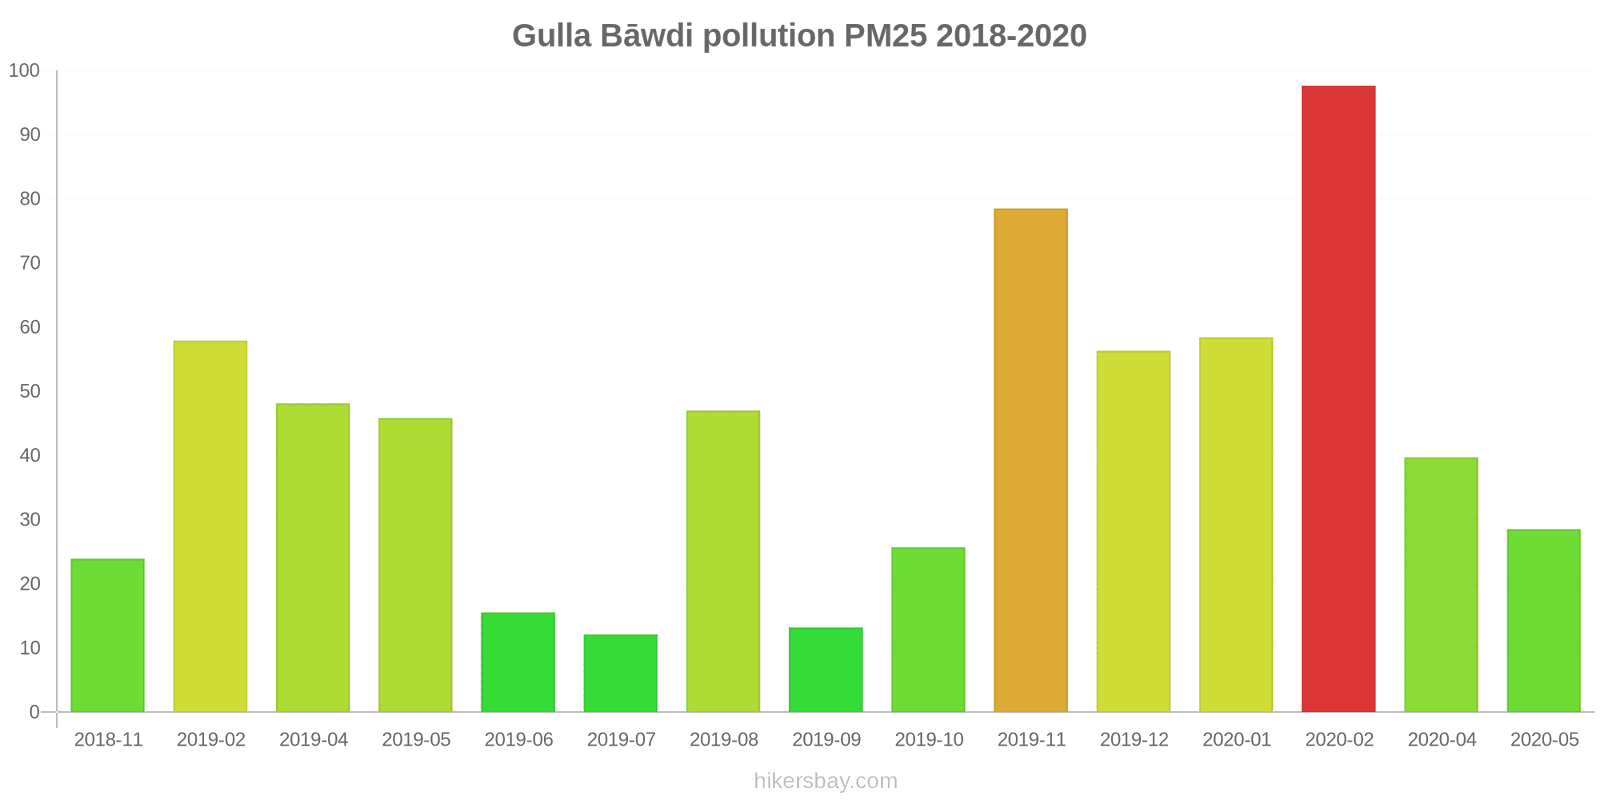
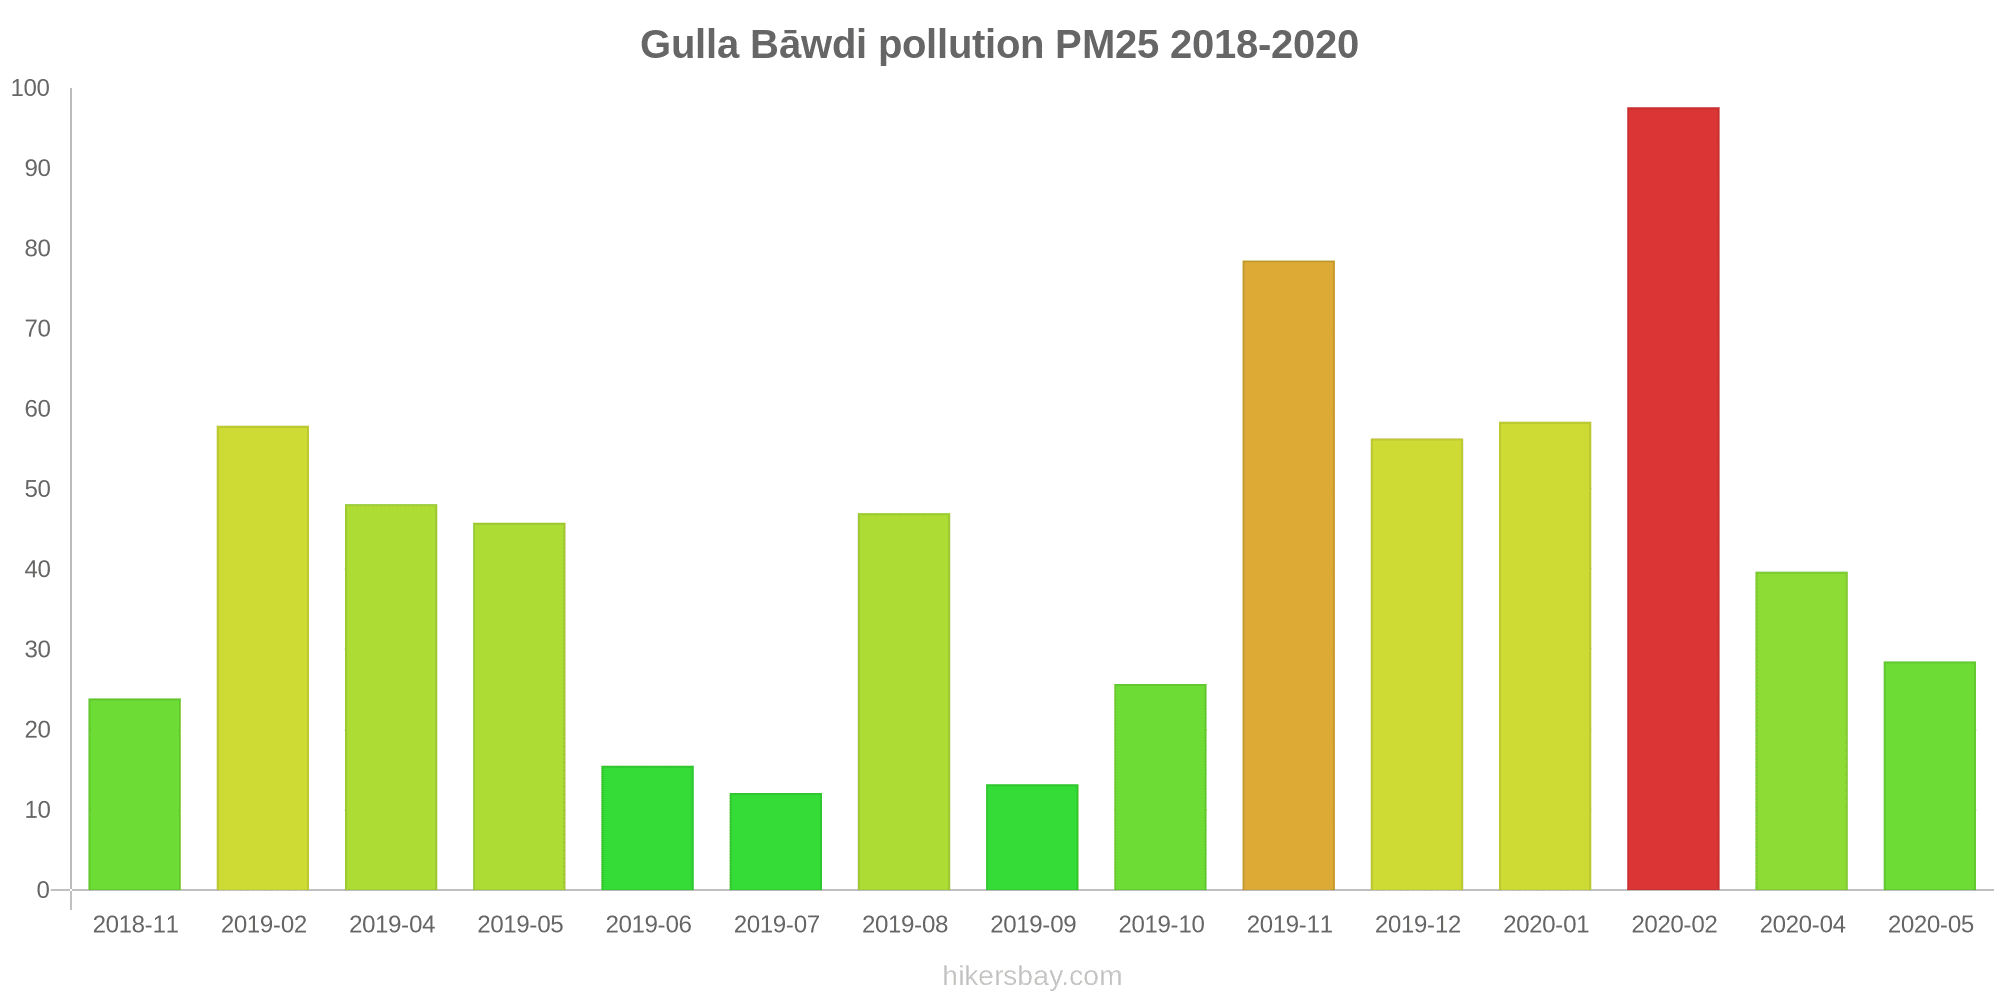
Nilai tertinggi PM 2.5 direkam: 98 (Februari 2020).
Tingkat terendah dari partikulat Matter PM 2.5 polusi terjadi di bulan: Juli (12).
Data saat ini Senin, 31 Oktober 2022 01.00
SO2 31 (Bagus)
CO 350 (Bagus)
O3 7 (Bagus)
PM2,5 54 (Tidak sehat untuk kelompok sensitif)
Data tentang polusi udara dari beberapa hari terakhir di Gulla Bāwdi
index
2022-10-31
so2
31
Good
co
350
Good
o3
7
Good
pm25
54
Unhealthy for Sensitive Groups
data source »
Polusi udara di Gulla Bāwdi dari November 2018 ke Mei 2020
index
2020-05
2020-04
2020-02
2020-01
2019-12
2019-11
2019-10
2019-09
2019-08
2019-07
2019-06
2019-05
2019-04
2019-02
2018-11
pm25
29 (Moderate)
40 (Unhealthy for Sensitive Groups)
98 (Very Unhealthy)
58 (Unhealthy)
56 (Unhealthy)
79 (Very Unhealthy)
26 (Moderate)
13 (Moderate)
47 (Unhealthy for Sensitive Groups)
12 (Good)
16 (Moderate)
46 (Unhealthy for Sensitive Groups)
48 (Unhealthy for Sensitive Groups)
58 (Unhealthy)
24 (Moderate)
no2
5.7 (Good)
6.3 (Good)
35 (Good)
32 (Good)
36 (Good)
48 (Moderate)
29 (Good)
14 (Good)
10 (Good)
7.6 (Good)
8.8 (Good)
6.6 (Good)
20 (Good)
14 (Good)
19 (Good)
co
- (Good)
389 (Good)
519 (Good)
490 (Good)
424 (Good)
1 (Good)
788 (Good)
443 (Good)
419 (Good)
251 (Good)
174 (Good)
- (Good)
100 (Good)
932 (Good)
518 (Good)
pm10
- (Good)
198 (Very bad Hazardous)
97 (Unhealthy)
122 (Very Unhealthy)
95 (Unhealthy)
117 (Very Unhealthy)
50 (Moderate)
29 (Moderate)
38 (Moderate)
52 (Unhealthy for Sensitive Groups)
42 (Moderate)
139 (Very Unhealthy)
131 (Very Unhealthy)
128 (Very Unhealthy)
- (Good)
so2
- (Good)
14 (Good)
21 (Good)
18 (Good)
8.4 (Good)
13 (Good)
6.5 (Good)
6 (Good)
7.8 (Good)
1.9 (Good)
0.46 (Good)
1.6 (Good)
- (Good)
5.3 (Good)
1.6 (Good)
o3
- (Good)
1.5 (Good)
15 (Good)
9.9 (Good)
16 (Good)
20 (Good)
15 (Good)
12 (Good)
11 (Good)
16 (Good)
40 (Good)
33 (Good)
43 (Good)
56 (Good)
17 (Good)
data source »
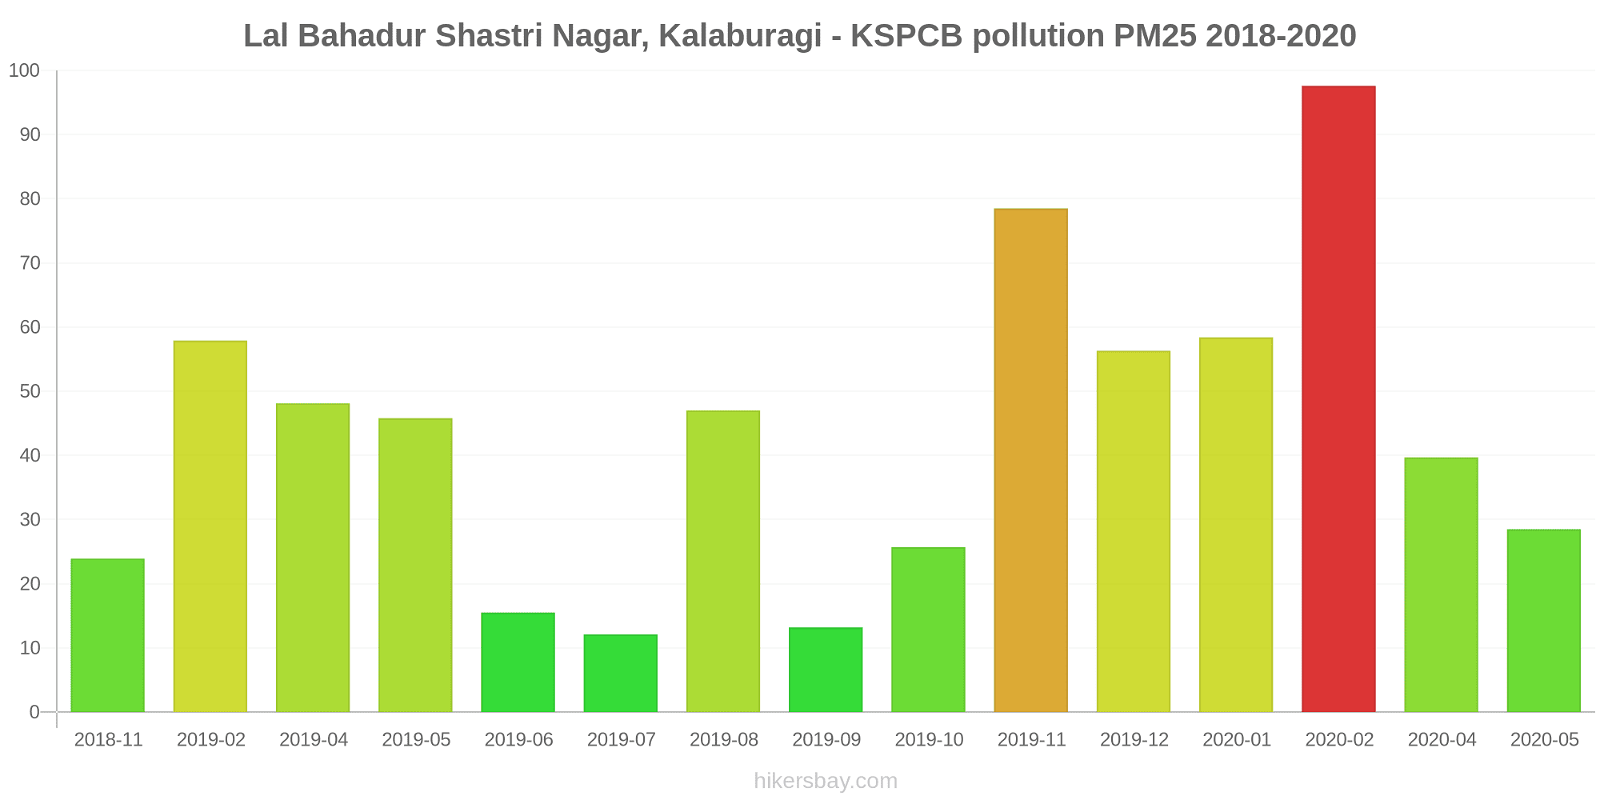
Lal Bahadur Shastri Nagar, Kalaburagi - KSPCB
Senin, 31 Oktober 2022 01.00
SO2 31 (Bagus)
sulfur dioksida (SO2)
CO 350 (Bagus)
karbon monoksida (CO)
O3 6.9 (Bagus)
ozon (O3)
PM2,5 54 (Tidak sehat untuk kelompok sensitif)
partikulat Matter (PM 2.5) debu
Lal Bahadur Shastri Nagar, Kalaburagi - KSPCB
index
2022-10-31
so2
31
co
350
o3
6.9
pm25
54
Lal Bahadur Shastri Nagar, Kalaburagi - KSPCB
2018-11 2020-05
index
2020-05
2020-04
2020-02
2020-01
2019-12
2019-11
2019-10
2019-09
2019-08
2019-07
2019-06
2019-05
2019-04
2019-02
2018-11
pm25
29
40
98
58
56
79
26
13
47
12
16
46
48
58
24
no2
5.7
6.3
35
32
36
48
29
14
10
7.6
8.8
6.6
20
14
19
so2
-
14
21
18
8.4
13
6.5
6
7.8
1.9
0.46
1.6
-
5.3
1.6
co
-
389
519
490
424
1
788
443
419
251
174
-
100
932
518
o3
-
1.5
15
9.9
16
20
15
12
11
16
40
33
43
56
17
pm10
-
198
97
122
95
117
50
29
38
52
42
139
131
128
-
* Pollution data source:
https://openaq.org
(caaqm)
The data is licensed under CC-By 4.0
SO2 31 (Bagus)
CO 350 (Bagus)
O3 7 (Bagus)
PM2,5 54 (Tidak sehat untuk kelompok sensitif)
Data tentang polusi udara dari beberapa hari terakhir di Gulla Bāwdi
| index | 2022-10-31 |
|---|---|
| so2 | 31 Good |
| co | 350 Good |
| o3 | 7 Good |
| pm25 | 54 Unhealthy for Sensitive Groups |
| index | 2020-05 | 2020-04 | 2020-02 | 2020-01 | 2019-12 | 2019-11 | 2019-10 | 2019-09 | 2019-08 | 2019-07 | 2019-06 | 2019-05 | 2019-04 | 2019-02 | 2018-11 |
|---|---|---|---|---|---|---|---|---|---|---|---|---|---|---|---|
| pm25 | 29 (Moderate) | 40 (Unhealthy for Sensitive Groups) | 98 (Very Unhealthy) | 58 (Unhealthy) | 56 (Unhealthy) | 79 (Very Unhealthy) | 26 (Moderate) | 13 (Moderate) | 47 (Unhealthy for Sensitive Groups) | 12 (Good) | 16 (Moderate) | 46 (Unhealthy for Sensitive Groups) | 48 (Unhealthy for Sensitive Groups) | 58 (Unhealthy) | 24 (Moderate) |
| no2 | 5.7 (Good) | 6.3 (Good) | 35 (Good) | 32 (Good) | 36 (Good) | 48 (Moderate) | 29 (Good) | 14 (Good) | 10 (Good) | 7.6 (Good) | 8.8 (Good) | 6.6 (Good) | 20 (Good) | 14 (Good) | 19 (Good) |
| co | - (Good) | 389 (Good) | 519 (Good) | 490 (Good) | 424 (Good) | 1 (Good) | 788 (Good) | 443 (Good) | 419 (Good) | 251 (Good) | 174 (Good) | - (Good) | 100 (Good) | 932 (Good) | 518 (Good) |
| pm10 | - (Good) | 198 (Very bad Hazardous) | 97 (Unhealthy) | 122 (Very Unhealthy) | 95 (Unhealthy) | 117 (Very Unhealthy) | 50 (Moderate) | 29 (Moderate) | 38 (Moderate) | 52 (Unhealthy for Sensitive Groups) | 42 (Moderate) | 139 (Very Unhealthy) | 131 (Very Unhealthy) | 128 (Very Unhealthy) | - (Good) |
| so2 | - (Good) | 14 (Good) | 21 (Good) | 18 (Good) | 8.4 (Good) | 13 (Good) | 6.5 (Good) | 6 (Good) | 7.8 (Good) | 1.9 (Good) | 0.46 (Good) | 1.6 (Good) | - (Good) | 5.3 (Good) | 1.6 (Good) |
| o3 | - (Good) | 1.5 (Good) | 15 (Good) | 9.9 (Good) | 16 (Good) | 20 (Good) | 15 (Good) | 12 (Good) | 11 (Good) | 16 (Good) | 40 (Good) | 33 (Good) | 43 (Good) | 56 (Good) | 17 (Good) |
SO2 31 (Bagus)
sulfur dioksida (SO2)CO 350 (Bagus)
karbon monoksida (CO)O3 6.9 (Bagus)
ozon (O3)PM2,5 54 (Tidak sehat untuk kelompok sensitif)
partikulat Matter (PM 2.5) debuLal Bahadur Shastri Nagar, Kalaburagi - KSPCB
| index | 2022-10-31 |
|---|---|
| so2 | 31 |
| co | 350 |
| o3 | 6.9 |
| pm25 | 54 |
Lal Bahadur Shastri Nagar, Kalaburagi - KSPCB

| index | 2020-05 | 2020-04 | 2020-02 | 2020-01 | 2019-12 | 2019-11 | 2019-10 | 2019-09 | 2019-08 | 2019-07 | 2019-06 | 2019-05 | 2019-04 | 2019-02 | 2018-11 |
|---|---|---|---|---|---|---|---|---|---|---|---|---|---|---|---|
| pm25 | 29 | 40 | 98 | 58 | 56 | 79 | 26 | 13 | 47 | 12 | 16 | 46 | 48 | 58 | 24 |
| no2 | 5.7 | 6.3 | 35 | 32 | 36 | 48 | 29 | 14 | 10 | 7.6 | 8.8 | 6.6 | 20 | 14 | 19 |
| so2 | - | 14 | 21 | 18 | 8.4 | 13 | 6.5 | 6 | 7.8 | 1.9 | 0.46 | 1.6 | - | 5.3 | 1.6 |
| co | - | 389 | 519 | 490 | 424 | 1 | 788 | 443 | 419 | 251 | 174 | - | 100 | 932 | 518 |
| o3 | - | 1.5 | 15 | 9.9 | 16 | 20 | 15 | 12 | 11 | 16 | 40 | 33 | 43 | 56 | 17 |
| pm10 | - | 198 | 97 | 122 | 95 | 117 | 50 | 29 | 38 | 52 | 42 | 139 | 131 | 128 | - |