Polusi udara di Nāmoli: indeks kualitas udara real-time dan siaga asap.
Perkiraan kualitas polusi dan udara untuk Nāmoli. Hari ini Rabu, 13 Mei 2026. Nilai polusi udara berikut telah tercatat untuk Nāmoli:- partikulat Matter (PM 2.5) debu - 245 (Sangat buruk berbahaya)
- partikulat Matter (PM10) debu tersuspensi - 329 (Sangat buruk berbahaya)
- sulfur dioksida (SO2) - 5 (Bagus)
- karbon monoksida (CO) - 2730 (Moderat)
- ozon (O3) - 2 (Bagus)
- nitrogen dioksida (NO2) - 36 (Bagus)

Apa kualitas udara di Nāmoli hari ini? Apakah udara tercemar di Nāmoli?. Apakah ada Smog?
Apa tingkat saat PM 2,5 in Nāmoli? (partikulat Matter (PM 2.5) debu)
Hari ini PM 2.5 tingkat:
245 (Sangat buruk berbahaya)
Sebagai perbandingan, tingkat tertinggi PM 2,5 in Nāmoli dalam 7 hari terakhir adalah: 245 (Senin, 31 Oktober 2022) dan Terendah: 245 (Senin, 31 Oktober 2022).
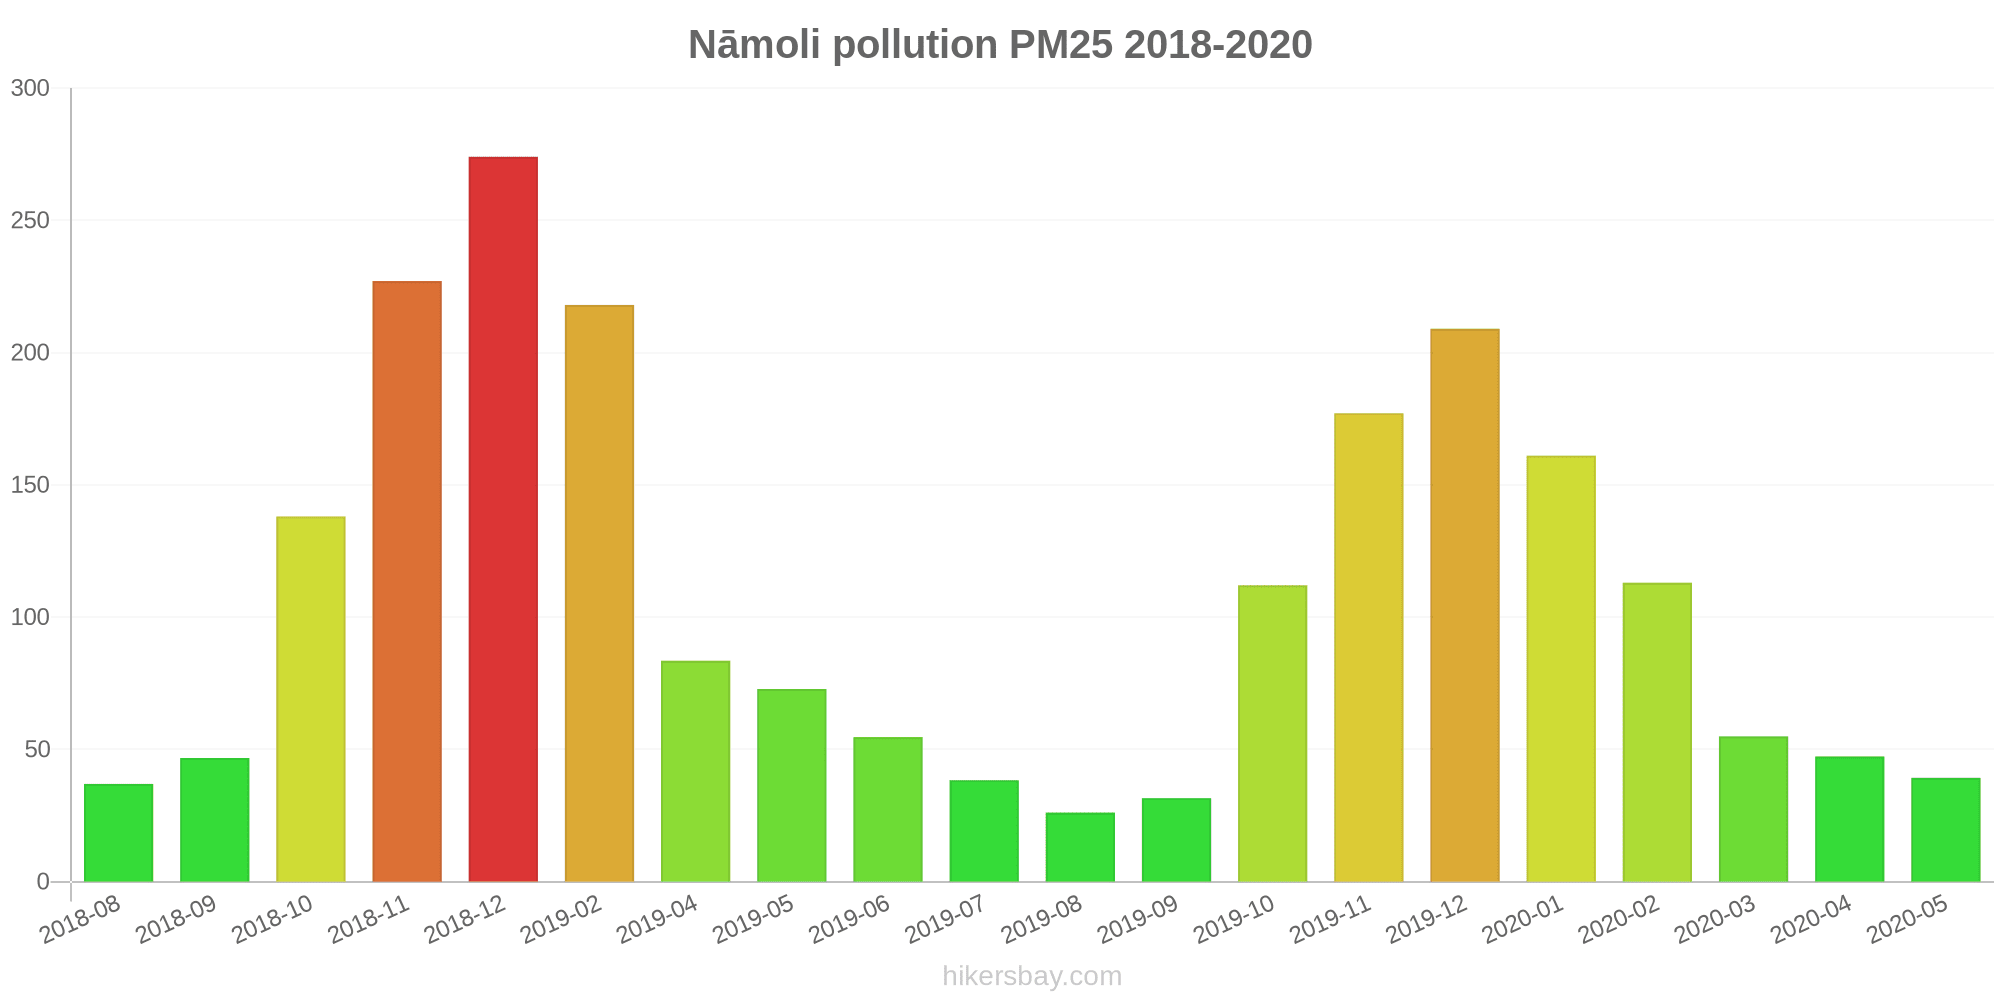
Nilai tertinggi PM 2.5 direkam: 274 (Desember 2018).
Tingkat terendah dari partikulat Matter PM 2.5 polusi terjadi di bulan: Agustus (26).
Apa tingkat PM10 hari ini di Nāmoli? (partikulat Matter (PM10) debu tersuspensi)
Level saat ini dari partikulat Matter PM10 di Nāmoli adalah:
329 (Sangat buruk berbahaya)
Nilai PM10 tertinggi biasanya terjadi di bulan: 393 (Desember 2018).
Nilai terendah dari partikulat PM10 pencemaran Nāmoli biasanya dicatat di: Agustus (85).
Apa tingkat polusi SO2? (sulfur dioksida (SO2))
5 (Bagus)
Seberapa tinggi tingkat CO? (karbon monoksida (CO))
2730 (Moderat)
Bagaimana tingkat O3 hari ini di Nāmoli? (ozon (O3))
2 (Bagus)
Seberapa tinggi tingkat NO2? (nitrogen dioksida (NO2))
36 (Bagus)
Data saat ini Senin, 31 Oktober 2022 02.00
PM2,5 245 (Sangat buruk berbahaya)
PM10 329 (Sangat buruk berbahaya)
SO2 5 (Bagus)
CO 2730 (Moderat)
O3 2 (Bagus)
NO2 36 (Bagus)
Data tentang polusi udara dari beberapa hari terakhir di Nāmoli
index
2022-10-31
pm25
245
Very bad Hazardous
pm10
333
Very bad Hazardous
so2
4
Good
co
2550
Moderate
o3
2
Good
no2
34
Good
data source »
Polusi udara di Nāmoli dari Agustus 2018 ke Mei 2020

index
2020-05
2020-04
2020-03
2020-02
2020-01
2019-12
2019-11
2019-10
2019-09
2019-08
2019-07
2019-06
2019-05
2019-04
2019-02
2018-12
2018-11
2018-10
2018-09
2018-08
pm25
39 (Unhealthy for Sensitive Groups)
47 (Unhealthy for Sensitive Groups)
55 (Unhealthy for Sensitive Groups)
113 (Very bad Hazardous)
161 (Very bad Hazardous)
209 (Very bad Hazardous)
177 (Very bad Hazardous)
112 (Very bad Hazardous)
32 (Moderate)
26 (Moderate)
38 (Unhealthy for Sensitive Groups)
55 (Unhealthy for Sensitive Groups)
73 (Unhealthy)
84 (Very Unhealthy)
218 (Very bad Hazardous)
274 (Very bad Hazardous)
227 (Very bad Hazardous)
138 (Very bad Hazardous)
47 (Unhealthy for Sensitive Groups)
37 (Unhealthy for Sensitive Groups)
pm10
99 (Unhealthy)
120 (Very Unhealthy)
121 (Very Unhealthy)
210 (Very bad Hazardous)
250 (Very bad Hazardous)
308 (Very bad Hazardous)
298 (Very bad Hazardous)
244 (Very bad Hazardous)
89 (Unhealthy)
85 (Unhealthy)
124 (Very Unhealthy)
186 (Very bad Hazardous)
264 (Very bad Hazardous)
317 (Very bad Hazardous)
341 (Very bad Hazardous)
393 (Very bad Hazardous)
363 (Very bad Hazardous)
315 (Very bad Hazardous)
142 (Very Unhealthy)
99 (Unhealthy)
no2
18 (Good)
13 (Good)
37 (Good)
68 (Moderate)
64 (Moderate)
81 (Moderate)
195 (Unhealthy)
123 (Unhealthy for Sensitive Groups)
24 (Good)
27 (Good)
26 (Good)
33 (Good)
42 (Moderate)
56 (Moderate)
80 (Moderate)
113 (Unhealthy for Sensitive Groups)
67 (Moderate)
51 (Moderate)
36 (Good)
21 (Good)
so2
11 (Good)
12 (Good)
14 (Good)
16 (Good)
12 (Good)
11 (Good)
23 (Good)
17 (Good)
16 (Good)
14 (Good)
13 (Good)
24 (Good)
42 (Good)
42 (Good)
17 (Good)
8.8 (Good)
14 (Good)
21 (Good)
11 (Good)
8.2 (Good)
o3
74 (Moderate)
60 (Good)
42 (Good)
40 (Good)
21 (Good)
27 (Good)
43 (Good)
43 (Good)
26 (Good)
24 (Good)
35 (Good)
63 (Good)
76 (Moderate)
76 (Moderate)
- (Good)
28 (Good)
63 (Good)
28 (Good)
16 (Good)
20 (Good)
co
1 (Good)
2 (Good)
3 (Good)
1 (Good)
1 (Good)
1 (Good)
1 (Good)
1 (Good)
1 (Good)
1 (Good)
1 (Good)
1 (Good)
1 (Good)
1 (Good)
1 (Good)
1 (Good)
1 (Good)
2 (Good)
1 (Good)
1 (Good)
data source »
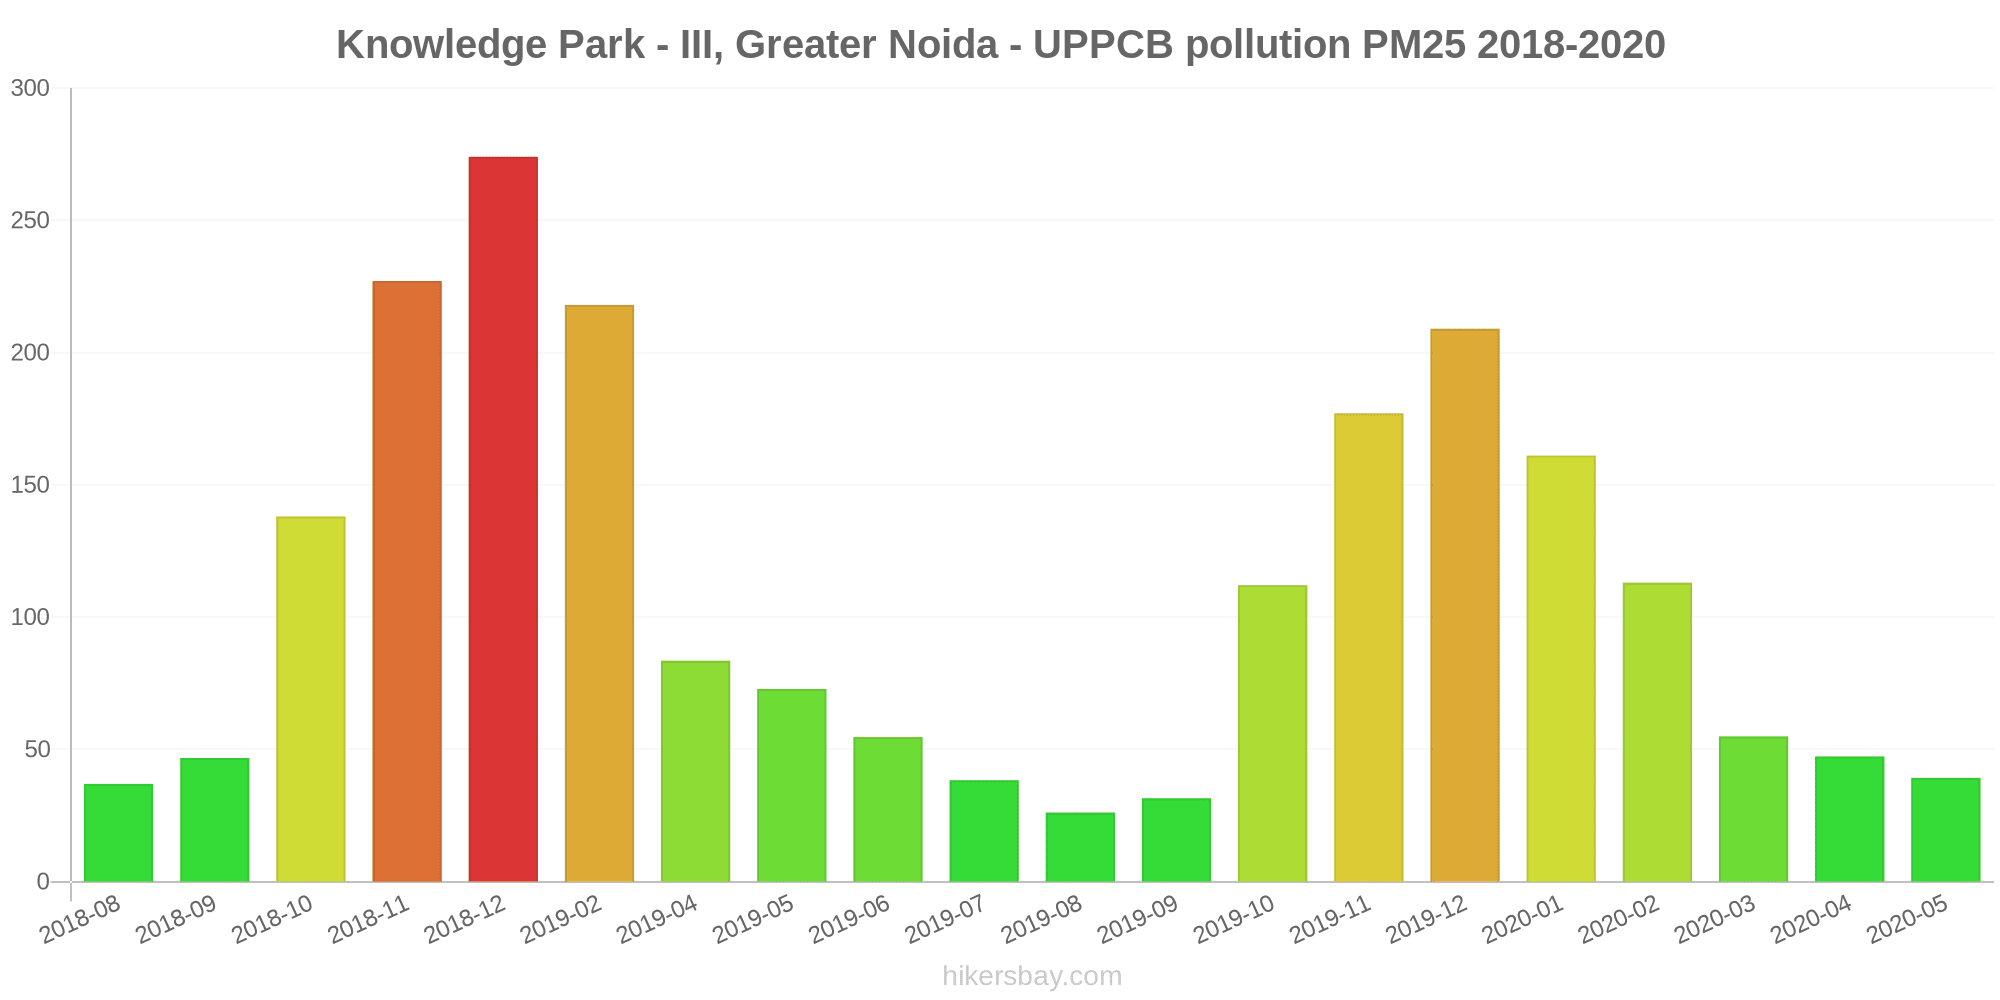
Knowledge Park - III, Greater Noida - UPPCB
Senin, 31 Oktober 2022 02.00
PM2,5 245 (Sangat buruk berbahaya)
partikulat Matter (PM 2.5) debu
PM10 329 (Sangat buruk berbahaya)
partikulat Matter (PM10) debu tersuspensi
SO2 4.6 (Bagus)
sulfur dioksida (SO2)
CO 2730 (Moderat)
karbon monoksida (CO)
O3 2.1 (Bagus)
ozon (O3)
NO2 36 (Bagus)
nitrogen dioksida (NO2)
Knowledge Park - III, Greater Noida - UPPCB
index
2022-10-31
pm25
245
pm10
333
so2
3.6
co
2550
o3
1.8
no2
34
Knowledge Park - III, Greater Noida - UPPCB
2018-08 2020-05

index
2020-05
2020-04
2020-03
2020-02
2020-01
2019-12
2019-11
2019-10
2019-09
2019-08
2019-07
2019-06
2019-05
2019-04
2019-02
2018-12
2018-11
2018-10
2018-09
2018-08
pm25
39
47
55
113
161
209
177
112
32
26
38
55
73
84
218
274
227
138
47
37
pm10
99
120
121
210
250
308
298
244
89
85
124
186
264
317
341
393
363
315
142
99
no2
18
13
37
68
64
81
195
123
24
27
26
33
42
56
80
113
67
51
36
21
so2
11
12
14
16
12
11
23
17
16
14
13
24
42
42
17
8.8
14
21
11
8.2
co
1
2
3
1
1
1
1
1
1
1
1
1
1
1
1
1
1
2
1
1
o3
74
60
42
40
21
27
43
43
26
24
35
63
76
76
-
28
63
28
16
20
* Pollution data source:
https://openaq.org
(caaqm)
The data is licensed under CC-By 4.0
PM2,5 245 (Sangat buruk berbahaya)
PM10 329 (Sangat buruk berbahaya)
SO2 5 (Bagus)
CO 2730 (Moderat)
O3 2 (Bagus)
NO2 36 (Bagus)
Data tentang polusi udara dari beberapa hari terakhir di Nāmoli
| index | 2022-10-31 |
|---|---|
| pm25 | 245 Very bad Hazardous |
| pm10 | 333 Very bad Hazardous |
| so2 | 4 Good |
| co | 2550 Moderate |
| o3 | 2 Good |
| no2 | 34 Good |
| index | 2020-05 | 2020-04 | 2020-03 | 2020-02 | 2020-01 | 2019-12 | 2019-11 | 2019-10 | 2019-09 | 2019-08 | 2019-07 | 2019-06 | 2019-05 | 2019-04 | 2019-02 | 2018-12 | 2018-11 | 2018-10 | 2018-09 | 2018-08 |
|---|---|---|---|---|---|---|---|---|---|---|---|---|---|---|---|---|---|---|---|---|
| pm25 | 39 (Unhealthy for Sensitive Groups) | 47 (Unhealthy for Sensitive Groups) | 55 (Unhealthy for Sensitive Groups) | 113 (Very bad Hazardous) | 161 (Very bad Hazardous) | 209 (Very bad Hazardous) | 177 (Very bad Hazardous) | 112 (Very bad Hazardous) | 32 (Moderate) | 26 (Moderate) | 38 (Unhealthy for Sensitive Groups) | 55 (Unhealthy for Sensitive Groups) | 73 (Unhealthy) | 84 (Very Unhealthy) | 218 (Very bad Hazardous) | 274 (Very bad Hazardous) | 227 (Very bad Hazardous) | 138 (Very bad Hazardous) | 47 (Unhealthy for Sensitive Groups) | 37 (Unhealthy for Sensitive Groups) |
| pm10 | 99 (Unhealthy) | 120 (Very Unhealthy) | 121 (Very Unhealthy) | 210 (Very bad Hazardous) | 250 (Very bad Hazardous) | 308 (Very bad Hazardous) | 298 (Very bad Hazardous) | 244 (Very bad Hazardous) | 89 (Unhealthy) | 85 (Unhealthy) | 124 (Very Unhealthy) | 186 (Very bad Hazardous) | 264 (Very bad Hazardous) | 317 (Very bad Hazardous) | 341 (Very bad Hazardous) | 393 (Very bad Hazardous) | 363 (Very bad Hazardous) | 315 (Very bad Hazardous) | 142 (Very Unhealthy) | 99 (Unhealthy) |
| no2 | 18 (Good) | 13 (Good) | 37 (Good) | 68 (Moderate) | 64 (Moderate) | 81 (Moderate) | 195 (Unhealthy) | 123 (Unhealthy for Sensitive Groups) | 24 (Good) | 27 (Good) | 26 (Good) | 33 (Good) | 42 (Moderate) | 56 (Moderate) | 80 (Moderate) | 113 (Unhealthy for Sensitive Groups) | 67 (Moderate) | 51 (Moderate) | 36 (Good) | 21 (Good) |
| so2 | 11 (Good) | 12 (Good) | 14 (Good) | 16 (Good) | 12 (Good) | 11 (Good) | 23 (Good) | 17 (Good) | 16 (Good) | 14 (Good) | 13 (Good) | 24 (Good) | 42 (Good) | 42 (Good) | 17 (Good) | 8.8 (Good) | 14 (Good) | 21 (Good) | 11 (Good) | 8.2 (Good) |
| o3 | 74 (Moderate) | 60 (Good) | 42 (Good) | 40 (Good) | 21 (Good) | 27 (Good) | 43 (Good) | 43 (Good) | 26 (Good) | 24 (Good) | 35 (Good) | 63 (Good) | 76 (Moderate) | 76 (Moderate) | - (Good) | 28 (Good) | 63 (Good) | 28 (Good) | 16 (Good) | 20 (Good) |
| co | 1 (Good) | 2 (Good) | 3 (Good) | 1 (Good) | 1 (Good) | 1 (Good) | 1 (Good) | 1 (Good) | 1 (Good) | 1 (Good) | 1 (Good) | 1 (Good) | 1 (Good) | 1 (Good) | 1 (Good) | 1 (Good) | 1 (Good) | 2 (Good) | 1 (Good) | 1 (Good) |
PM2,5 245 (Sangat buruk berbahaya)
partikulat Matter (PM 2.5) debuPM10 329 (Sangat buruk berbahaya)
partikulat Matter (PM10) debu tersuspensiSO2 4.6 (Bagus)
sulfur dioksida (SO2)CO 2730 (Moderat)
karbon monoksida (CO)O3 2.1 (Bagus)
ozon (O3)NO2 36 (Bagus)
nitrogen dioksida (NO2)Knowledge Park - III, Greater Noida - UPPCB
| index | 2022-10-31 |
|---|---|
| pm25 | 245 |
| pm10 | 333 |
| so2 | 3.6 |
| co | 2550 |
| o3 | 1.8 |
| no2 | 34 |
Knowledge Park - III, Greater Noida - UPPCB
| index | 2020-05 | 2020-04 | 2020-03 | 2020-02 | 2020-01 | 2019-12 | 2019-11 | 2019-10 | 2019-09 | 2019-08 | 2019-07 | 2019-06 | 2019-05 | 2019-04 | 2019-02 | 2018-12 | 2018-11 | 2018-10 | 2018-09 | 2018-08 |
|---|---|---|---|---|---|---|---|---|---|---|---|---|---|---|---|---|---|---|---|---|
| pm25 | 39 | 47 | 55 | 113 | 161 | 209 | 177 | 112 | 32 | 26 | 38 | 55 | 73 | 84 | 218 | 274 | 227 | 138 | 47 | 37 |
| pm10 | 99 | 120 | 121 | 210 | 250 | 308 | 298 | 244 | 89 | 85 | 124 | 186 | 264 | 317 | 341 | 393 | 363 | 315 | 142 | 99 |
| no2 | 18 | 13 | 37 | 68 | 64 | 81 | 195 | 123 | 24 | 27 | 26 | 33 | 42 | 56 | 80 | 113 | 67 | 51 | 36 | 21 |
| so2 | 11 | 12 | 14 | 16 | 12 | 11 | 23 | 17 | 16 | 14 | 13 | 24 | 42 | 42 | 17 | 8.8 | 14 | 21 | 11 | 8.2 |
| co | 1 | 2 | 3 | 1 | 1 | 1 | 1 | 1 | 1 | 1 | 1 | 1 | 1 | 1 | 1 | 1 | 1 | 2 | 1 | 1 |
| o3 | 74 | 60 | 42 | 40 | 21 | 27 | 43 | 43 | 26 | 24 | 35 | 63 | 76 | 76 | - | 28 | 63 | 28 | 16 | 20 |