Polusi udara di Chilla Soroda Bāngar: indeks kualitas udara real-time dan siaga asap.
Perkiraan kualitas polusi dan udara untuk Chilla Soroda Bāngar. Hari ini Rabu, 13 Mei 2026. Nilai polusi udara berikut telah tercatat untuk Chilla Soroda Bāngar:- partikulat Matter (PM 2.5) debu - 54 (Tidak sehat untuk kelompok sensitif)
- nitrogen dioksida (NO2) - 29 (Bagus)
- ozon (O3) - 124 (Tidak sehat untuk kelompok sensitif)
- sulfur dioksida (SO2) - 30 (Bagus)
- partikulat Matter (PM10) debu tersuspensi - 186 (Sangat buruk berbahaya)
- karbon monoksida (CO) - 8970 (Tidak sehat untuk kelompok sensitif)

Apa kualitas udara di Chilla Soroda Bāngar hari ini? Apakah udara tercemar di Chilla Soroda Bāngar?. Apakah ada Smog?
Apa tingkat saat PM 2,5 in Chilla Soroda Bāngar? (partikulat Matter (PM 2.5) debu)
Hari ini PM 2.5 tingkat:
54 (Tidak sehat untuk kelompok sensitif)
Sebagai perbandingan, tingkat tertinggi PM 2,5 in Chilla Soroda Bāngar dalam 7 hari terakhir adalah: 69 (Jumat, 14 Oktober 2022) dan Terendah: 5 (Minggu, 9 Oktober 2022).
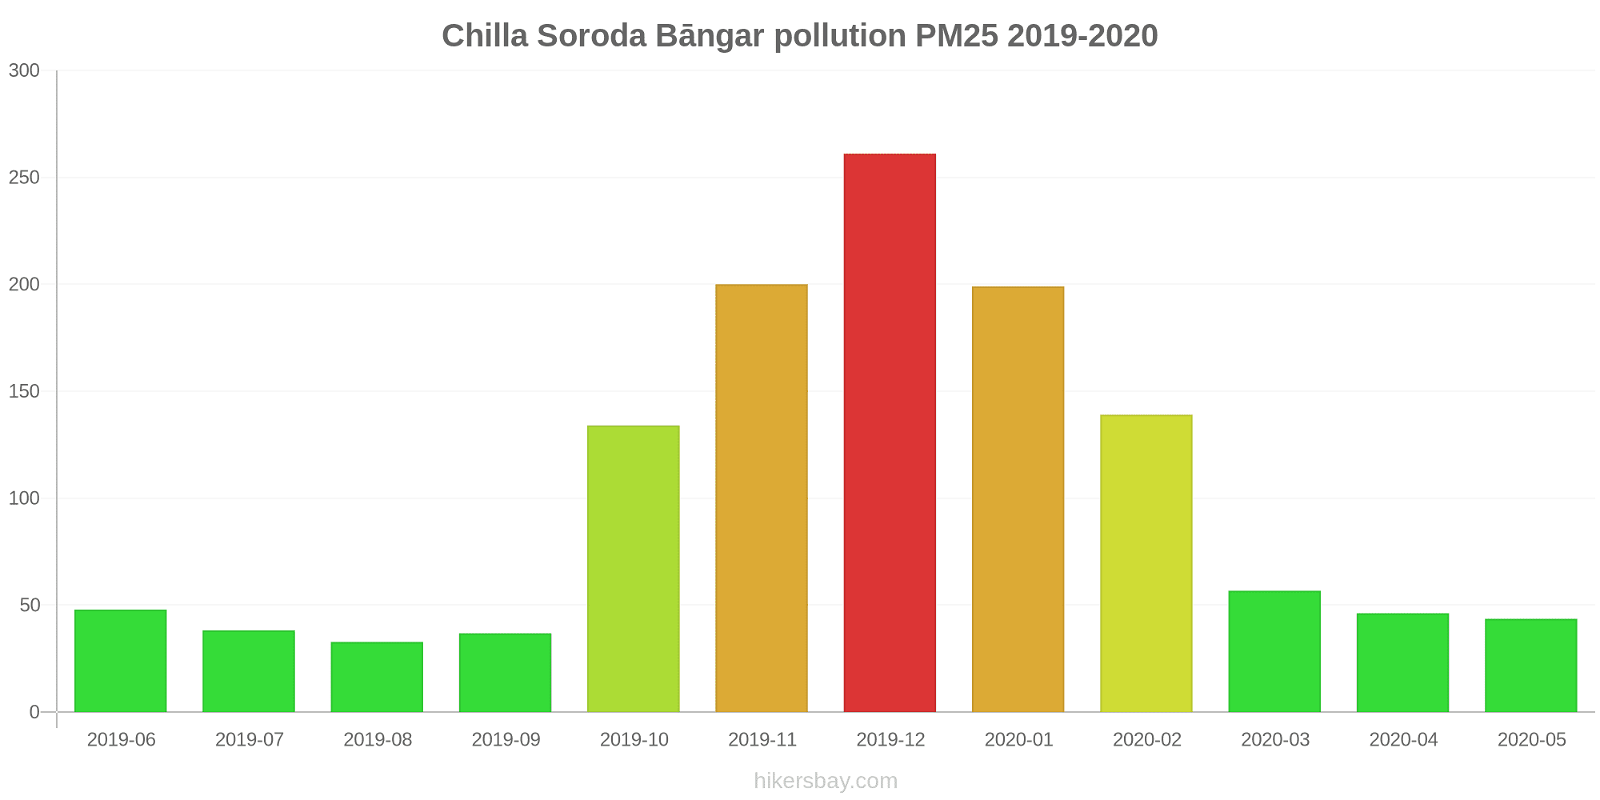
Nilai tertinggi PM 2.5 direkam: 261 (Desember 2019).
Tingkat terendah dari partikulat Matter PM 2.5 polusi terjadi di bulan: Agustus (33).
Seberapa tinggi tingkat NO2? (nitrogen dioksida (NO2))
29 (Bagus)
Bagaimana tingkat O3 hari ini di Chilla Soroda Bāngar? (ozon (O3))
124 (Tidak sehat untuk kelompok sensitif)
Apa tingkat polusi SO2? (sulfur dioksida (SO2))
30 (Bagus)
Apa tingkat PM10 hari ini di Chilla Soroda Bāngar? (partikulat Matter (PM10) debu tersuspensi)
Level saat ini dari partikulat Matter PM10 di Chilla Soroda Bāngar adalah:
186 (Sangat buruk berbahaya)
Nilai PM10 tertinggi biasanya terjadi di bulan: 344 (Desember 2019).
Nilai terendah dari partikulat PM10 pencemaran Chilla Soroda Bāngar biasanya dicatat di: Agustus (83).
Seberapa tinggi tingkat CO? (karbon monoksida (CO))
8970 (Tidak sehat untuk kelompok sensitif)
Data saat ini Jumat, 14 Oktober 2022 06.00
PM2,5 54 (Tidak sehat untuk kelompok sensitif)
NO2 29 (Bagus)
O3 124 (Tidak sehat untuk kelompok sensitif)
SO2 30 (Bagus)
PM10 186 (Sangat buruk berbahaya)
CO 8970 (Tidak sehat untuk kelompok sensitif)
Data tentang polusi udara dari beberapa hari terakhir di Chilla Soroda Bāngar
index
2022-10-07
2022-10-08
2022-10-09
2022-10-10
2022-10-11
2022-10-12
2022-10-13
2022-10-14
so2
24
Good
38
Good
21
Good
28
Good
20
Good
19
Good
57
Moderate
26
Good
pm25
11
Good
8
Good
5
Good
7
Good
27
Moderate
59
Unhealthy
48
Unhealthy for Sensitive Groups
69
Unhealthy
pm10
34
Moderate
19
Good
13
Good
21
Moderate
82
Unhealthy
164
Very bad Hazardous
183
Very bad Hazardous
201
Very bad Hazardous
o3
19
Good
16
Good
16
Good
18
Good
48
Good
61
Good
38
Good
49
Good
no2
15
Good
17
Good
14
Good
14
Good
30
Good
34
Good
34
Good
31
Good
co
-
Good
-
Good
-
Good
-
Good
-
Good
6190
Unhealthy for Sensitive Groups
8800
Unhealthy for Sensitive Groups
-
Good
data source »
Polusi udara di Chilla Soroda Bāngar dari Juni 2019 ke Mei 2020
index
2020-05
2020-04
2020-03
2020-02
2020-01
2019-12
2019-11
2019-10
2019-09
2019-08
2019-07
2019-06
pm25
44 (Unhealthy for Sensitive Groups)
46 (Unhealthy for Sensitive Groups)
57 (Unhealthy)
139 (Very bad Hazardous)
199 (Very bad Hazardous)
261 (Very bad Hazardous)
200 (Very bad Hazardous)
134 (Very bad Hazardous)
37 (Unhealthy for Sensitive Groups)
33 (Moderate)
38 (Unhealthy for Sensitive Groups)
48 (Unhealthy for Sensitive Groups)
pm10
113 (Very Unhealthy)
123 (Very Unhealthy)
127 (Very Unhealthy)
223 (Very bad Hazardous)
264 (Very bad Hazardous)
344 (Very bad Hazardous)
289 (Very bad Hazardous)
237 (Very bad Hazardous)
84 (Unhealthy)
83 (Unhealthy)
153 (Very bad Hazardous)
318 (Very bad Hazardous)
no2
13 (Good)
17 (Good)
45 (Moderate)
72 (Moderate)
74 (Moderate)
87 (Moderate)
97 (Moderate)
78 (Moderate)
31 (Good)
33 (Good)
36 (Good)
47 (Moderate)
so2
14 (Good)
15 (Good)
13 (Good)
14 (Good)
11 (Good)
9.2 (Good)
13 (Good)
13 (Good)
12 (Good)
7.7 (Good)
6.4 (Good)
6.6 (Good)
o3
75 (Moderate)
67 (Good)
50 (Good)
55 (Good)
29 (Good)
24 (Good)
40 (Good)
54 (Good)
54 (Good)
43 (Good)
53 (Good)
77 (Moderate)
co
1 (Good)
2 (Good)
2 (Good)
2 (Good)
1 (Good)
1 (Good)
2 (Good)
1 (Good)
781 (Good)
789 (Good)
638 (Good)
815 (Good)
data source »
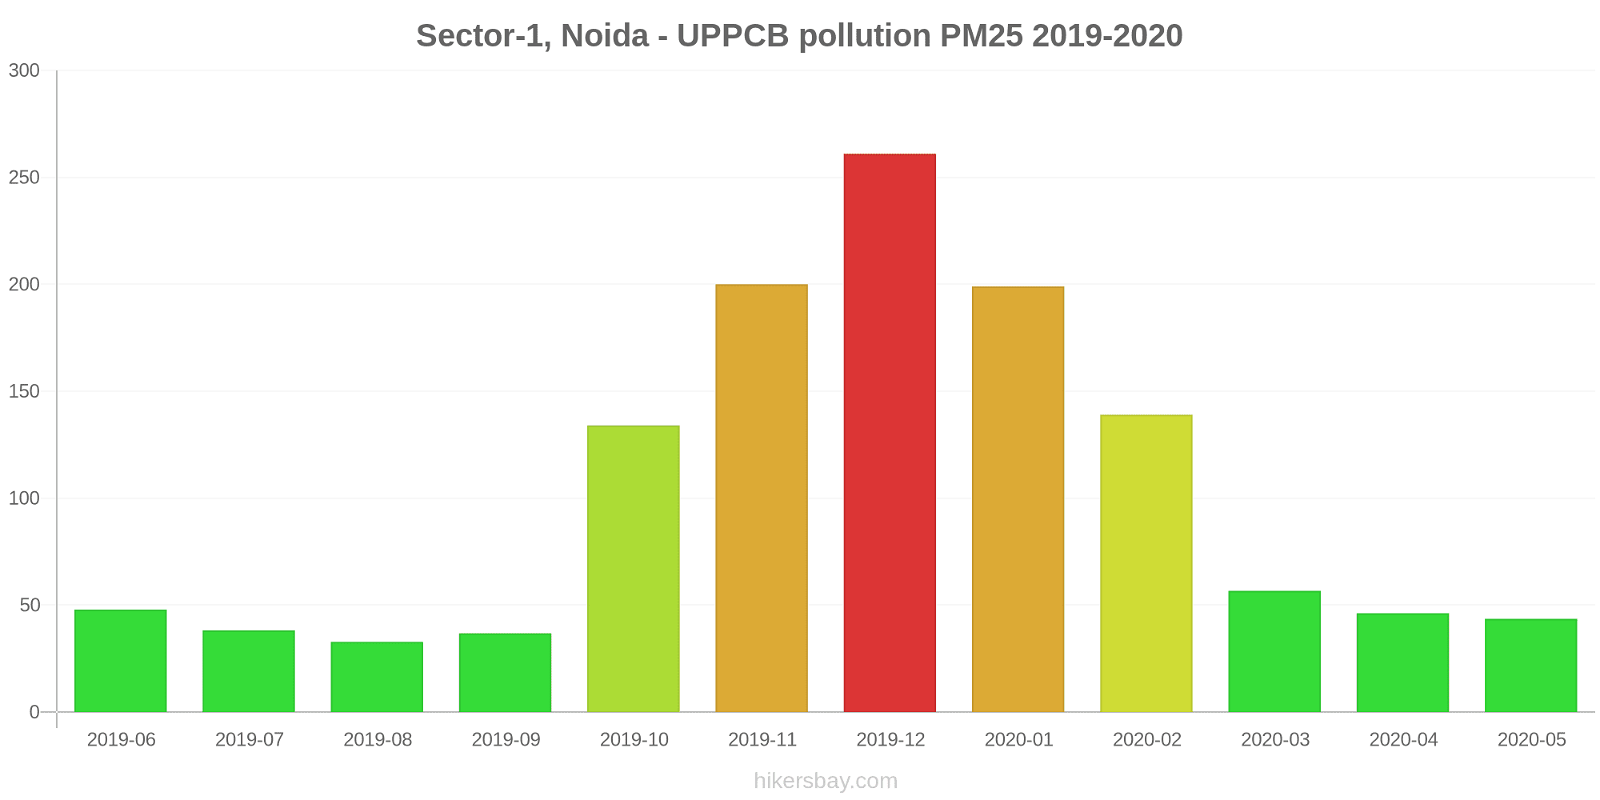
Sector-1, Noida - UPPCB
Jumat, 14 Oktober 2022 06.00
PM2,5 54 (Tidak sehat untuk kelompok sensitif)
partikulat Matter (PM 2.5) debu
NO2 29 (Bagus)
nitrogen dioksida (NO2)
O3 124 (Tidak sehat untuk kelompok sensitif)
ozon (O3)
SO2 30 (Bagus)
sulfur dioksida (SO2)
PM10 186 (Sangat buruk berbahaya)
partikulat Matter (PM10) debu tersuspensi
CO 8970 (Tidak sehat untuk kelompok sensitif)
karbon monoksida (CO)
Sector-1, Noida - UPPCB
index
2022-10-14
2022-10-13
2022-10-12
2022-10-11
2022-10-10
2022-10-09
2022-10-08
2022-10-07
so2
26
57
19
20
28
21
38
24
pm25
69
48
59
27
6.9
5.4
8.2
11
pm10
201
183
164
82
21
13
19
34
o3
49
38
61
48
18
16
16
19
no2
31
34
34
30
14
14
17
15
co
-
8800
6190
-
-
-
-
-
Sector-1, Noida - UPPCB
2019-06 2020-05
index
2020-05
2020-04
2020-03
2020-02
2020-01
2019-12
2019-11
2019-10
2019-09
2019-08
2019-07
2019-06
pm25
44
46
57
139
199
261
200
134
37
33
38
48
pm10
113
123
127
223
264
344
289
237
84
83
153
318
no2
13
17
45
72
74
87
97
78
31
33
36
47
so2
14
15
13
14
11
9.2
13
13
12
7.7
6.4
6.6
o3
75
67
50
55
29
24
40
54
54
43
53
77
co
1
2
2
2
1
1
2
1
781
789
638
815
* Pollution data source:
https://openaq.org
(caaqm)
The data is licensed under CC-By 4.0
PM2,5 54 (Tidak sehat untuk kelompok sensitif)
NO2 29 (Bagus)
O3 124 (Tidak sehat untuk kelompok sensitif)
SO2 30 (Bagus)
PM10 186 (Sangat buruk berbahaya)
CO 8970 (Tidak sehat untuk kelompok sensitif)
Data tentang polusi udara dari beberapa hari terakhir di Chilla Soroda Bāngar
| index | 2022-10-07 | 2022-10-08 | 2022-10-09 | 2022-10-10 | 2022-10-11 | 2022-10-12 | 2022-10-13 | 2022-10-14 |
|---|---|---|---|---|---|---|---|---|
| so2 | 24 Good |
38 Good |
21 Good |
28 Good |
20 Good |
19 Good |
57 Moderate |
26 Good |
| pm25 | 11 Good |
8 Good |
5 Good |
7 Good |
27 Moderate |
59 Unhealthy |
48 Unhealthy for Sensitive Groups |
69 Unhealthy |
| pm10 | 34 Moderate |
19 Good |
13 Good |
21 Moderate |
82 Unhealthy |
164 Very bad Hazardous |
183 Very bad Hazardous |
201 Very bad Hazardous |
| o3 | 19 Good |
16 Good |
16 Good |
18 Good |
48 Good |
61 Good |
38 Good |
49 Good |
| no2 | 15 Good |
17 Good |
14 Good |
14 Good |
30 Good |
34 Good |
34 Good |
31 Good |
| co | - Good |
- Good |
- Good |
- Good |
- Good |
6190 Unhealthy for Sensitive Groups |
8800 Unhealthy for Sensitive Groups |
- Good |

| index | 2020-05 | 2020-04 | 2020-03 | 2020-02 | 2020-01 | 2019-12 | 2019-11 | 2019-10 | 2019-09 | 2019-08 | 2019-07 | 2019-06 |
|---|---|---|---|---|---|---|---|---|---|---|---|---|
| pm25 | 44 (Unhealthy for Sensitive Groups) | 46 (Unhealthy for Sensitive Groups) | 57 (Unhealthy) | 139 (Very bad Hazardous) | 199 (Very bad Hazardous) | 261 (Very bad Hazardous) | 200 (Very bad Hazardous) | 134 (Very bad Hazardous) | 37 (Unhealthy for Sensitive Groups) | 33 (Moderate) | 38 (Unhealthy for Sensitive Groups) | 48 (Unhealthy for Sensitive Groups) |
| pm10 | 113 (Very Unhealthy) | 123 (Very Unhealthy) | 127 (Very Unhealthy) | 223 (Very bad Hazardous) | 264 (Very bad Hazardous) | 344 (Very bad Hazardous) | 289 (Very bad Hazardous) | 237 (Very bad Hazardous) | 84 (Unhealthy) | 83 (Unhealthy) | 153 (Very bad Hazardous) | 318 (Very bad Hazardous) |
| no2 | 13 (Good) | 17 (Good) | 45 (Moderate) | 72 (Moderate) | 74 (Moderate) | 87 (Moderate) | 97 (Moderate) | 78 (Moderate) | 31 (Good) | 33 (Good) | 36 (Good) | 47 (Moderate) |
| so2 | 14 (Good) | 15 (Good) | 13 (Good) | 14 (Good) | 11 (Good) | 9.2 (Good) | 13 (Good) | 13 (Good) | 12 (Good) | 7.7 (Good) | 6.4 (Good) | 6.6 (Good) |
| o3 | 75 (Moderate) | 67 (Good) | 50 (Good) | 55 (Good) | 29 (Good) | 24 (Good) | 40 (Good) | 54 (Good) | 54 (Good) | 43 (Good) | 53 (Good) | 77 (Moderate) |
| co | 1 (Good) | 2 (Good) | 2 (Good) | 2 (Good) | 1 (Good) | 1 (Good) | 2 (Good) | 1 (Good) | 781 (Good) | 789 (Good) | 638 (Good) | 815 (Good) |
PM2,5 54 (Tidak sehat untuk kelompok sensitif)
partikulat Matter (PM 2.5) debuNO2 29 (Bagus)
nitrogen dioksida (NO2)O3 124 (Tidak sehat untuk kelompok sensitif)
ozon (O3)SO2 30 (Bagus)
sulfur dioksida (SO2)PM10 186 (Sangat buruk berbahaya)
partikulat Matter (PM10) debu tersuspensiCO 8970 (Tidak sehat untuk kelompok sensitif)
karbon monoksida (CO)Sector-1, Noida - UPPCB
| index | 2022-10-14 | 2022-10-13 | 2022-10-12 | 2022-10-11 | 2022-10-10 | 2022-10-09 | 2022-10-08 | 2022-10-07 |
|---|---|---|---|---|---|---|---|---|
| so2 | 26 | 57 | 19 | 20 | 28 | 21 | 38 | 24 |
| pm25 | 69 | 48 | 59 | 27 | 6.9 | 5.4 | 8.2 | 11 |
| pm10 | 201 | 183 | 164 | 82 | 21 | 13 | 19 | 34 |
| o3 | 49 | 38 | 61 | 48 | 18 | 16 | 16 | 19 |
| no2 | 31 | 34 | 34 | 30 | 14 | 14 | 17 | 15 |
| co | - | 8800 | 6190 | - | - | - | - | - |
Sector-1, Noida - UPPCB

| index | 2020-05 | 2020-04 | 2020-03 | 2020-02 | 2020-01 | 2019-12 | 2019-11 | 2019-10 | 2019-09 | 2019-08 | 2019-07 | 2019-06 |
|---|---|---|---|---|---|---|---|---|---|---|---|---|
| pm25 | 44 | 46 | 57 | 139 | 199 | 261 | 200 | 134 | 37 | 33 | 38 | 48 |
| pm10 | 113 | 123 | 127 | 223 | 264 | 344 | 289 | 237 | 84 | 83 | 153 | 318 |
| no2 | 13 | 17 | 45 | 72 | 74 | 87 | 97 | 78 | 31 | 33 | 36 | 47 |
| so2 | 14 | 15 | 13 | 14 | 11 | 9.2 | 13 | 13 | 12 | 7.7 | 6.4 | 6.6 |
| o3 | 75 | 67 | 50 | 55 | 29 | 24 | 40 | 54 | 54 | 43 | 53 | 77 |
| co | 1 | 2 | 2 | 2 | 1 | 1 | 2 | 1 | 781 | 789 | 638 | 815 |