Polusi udara di Indraprasiha: indeks kualitas udara real-time dan siaga asap.
Perkiraan kualitas polusi dan udara untuk Indraprasiha. Hari ini Kamis, 14 Mei 2026. Nilai polusi udara berikut telah tercatat untuk Indraprasiha:- partikulat Matter (PM 2.5) debu - 228 (Sangat buruk berbahaya)
- partikulat Matter (PM10) debu tersuspensi - 327 (Sangat buruk berbahaya)
- nitrogen dioksida (NO2) - 46 (Moderat)
- ozon (O3) - 1 (Bagus)
- sulfur dioksida (SO2) - 0 (Bagus)
- karbon monoksida (CO) - 300 (Bagus)

Apa kualitas udara di Indraprasiha hari ini? Apakah udara tercemar di Indraprasiha?. Apakah ada Smog?
Apa tingkat saat PM 2,5 in Indraprasiha? (partikulat Matter (PM 2.5) debu)
Hari ini PM 2.5 tingkat:
228 (Sangat buruk berbahaya)
Sebagai perbandingan, tingkat tertinggi PM 2,5 in Indraprasiha dalam 7 hari terakhir adalah: 228 (Senin, 31 Oktober 2022) dan Terendah: 228 (Senin, 31 Oktober 2022).
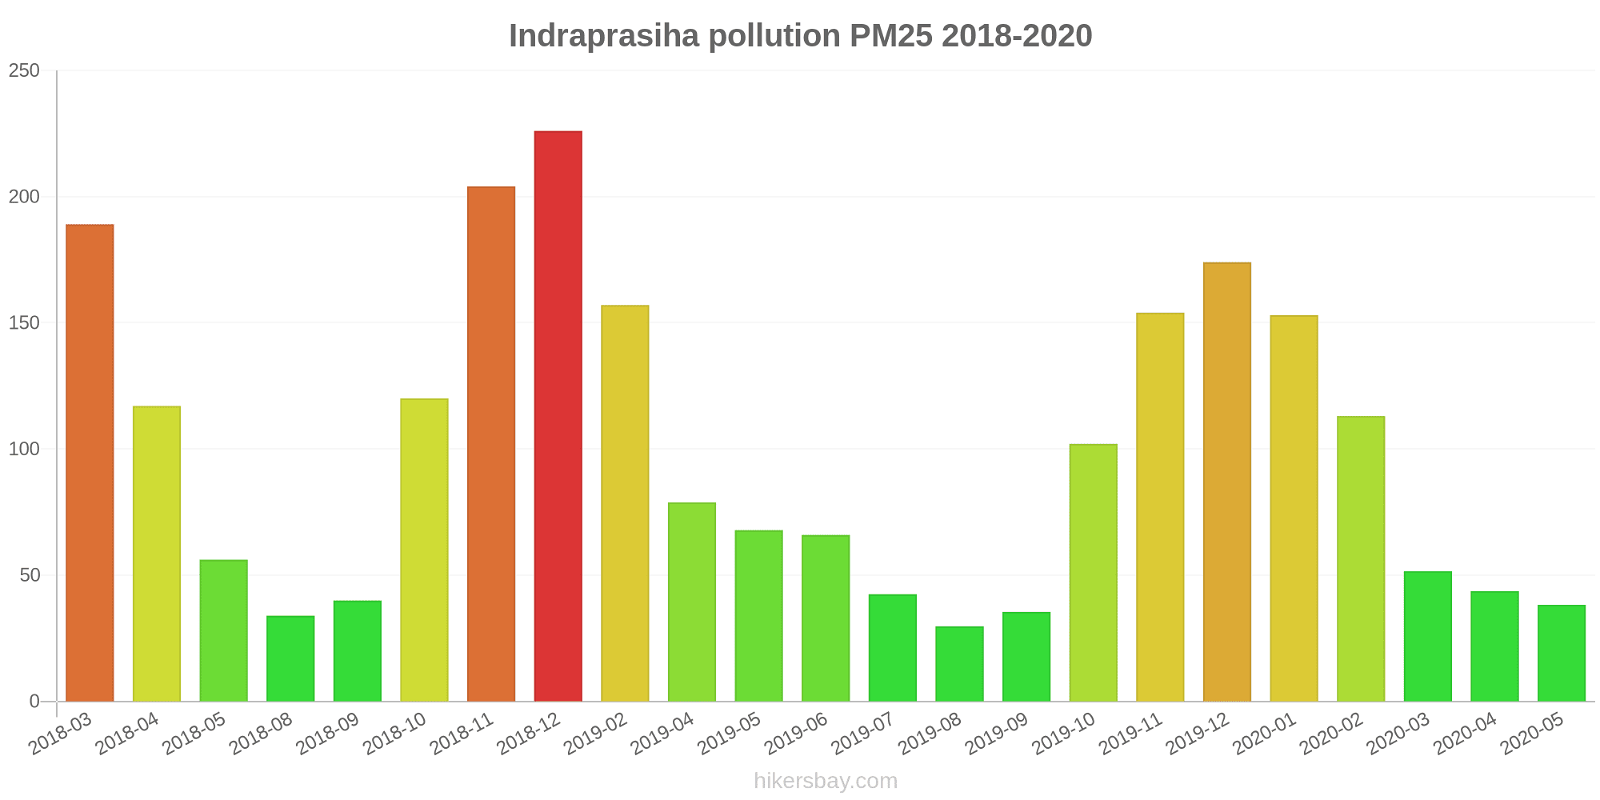
Nilai tertinggi PM 2.5 direkam: 226 (Desember 2018).
Tingkat terendah dari partikulat Matter PM 2.5 polusi terjadi di bulan: Agustus (30).
Apa tingkat PM10 hari ini di Indraprasiha? (partikulat Matter (PM10) debu tersuspensi)
Level saat ini dari partikulat Matter PM10 di Indraprasiha adalah:
327 (Sangat buruk berbahaya)
Nilai PM10 tertinggi biasanya terjadi di bulan: 413 (Desember 2018).
Nilai terendah dari partikulat PM10 pencemaran Indraprasiha biasanya dicatat di: Agustus (76).
Seberapa tinggi tingkat NO2? (nitrogen dioksida (NO2))
46 (Moderat)
Bagaimana tingkat O3 hari ini di Indraprasiha? (ozon (O3))
1 (Bagus)
Apa tingkat polusi SO2? (sulfur dioksida (SO2))
0 (Bagus)
Seberapa tinggi tingkat CO? (karbon monoksida (CO))
300 (Bagus)
Data saat ini Senin, 31 Oktober 2022 00.45
PM2,5 228 (Sangat buruk berbahaya)
PM10 327 (Sangat buruk berbahaya)
NO2 46 (Moderat)
O3 1 (Bagus)
SO2 0 (Bagus)
CO 300 (Bagus)
Data tentang polusi udara dari beberapa hari terakhir di Indraprasiha
index
2022-10-31
pm25
228
Very bad Hazardous
pm10
327
Very bad Hazardous
no2
46
Moderate
o3
1
Good
so2
0
Good
co
300
Good
data source »
Polusi udara di Indraprasiha dari Maret 2018 ke Mei 2020
index
2020-05
2020-04
2020-03
2020-02
2020-01
2019-12
2019-11
2019-10
2019-09
2019-08
2019-07
2019-06
2019-05
2019-04
2019-02
2018-12
2018-11
2018-10
2018-09
2018-08
2018-05
2018-04
2018-03
pm25
38 (Unhealthy for Sensitive Groups)
44 (Unhealthy for Sensitive Groups)
52 (Unhealthy for Sensitive Groups)
113 (Very bad Hazardous)
153 (Very bad Hazardous)
174 (Very bad Hazardous)
154 (Very bad Hazardous)
102 (Very Unhealthy)
35 (Unhealthy for Sensitive Groups)
30 (Moderate)
42 (Unhealthy for Sensitive Groups)
66 (Unhealthy)
68 (Unhealthy)
79 (Very Unhealthy)
157 (Very bad Hazardous)
226 (Very bad Hazardous)
204 (Very bad Hazardous)
120 (Very bad Hazardous)
40 (Unhealthy for Sensitive Groups)
34 (Moderate)
56 (Unhealthy)
117 (Very bad Hazardous)
189 (Very bad Hazardous)
pm10
86 (Unhealthy)
92 (Unhealthy)
108 (Unhealthy)
200 (Very bad Hazardous)
232 (Very bad Hazardous)
316 (Very bad Hazardous)
278 (Very bad Hazardous)
215 (Very bad Hazardous)
88 (Unhealthy)
76 (Unhealthy for Sensitive Groups)
136 (Very Unhealthy)
188 (Very bad Hazardous)
235 (Very bad Hazardous)
265 (Very bad Hazardous)
307 (Very bad Hazardous)
413 (Very bad Hazardous)
326 (Very bad Hazardous)
269 (Very bad Hazardous)
91 (Unhealthy)
81 (Unhealthy)
187 (Very bad Hazardous)
204 (Very bad Hazardous)
210 (Very bad Hazardous)
no2
15 (Good)
17 (Good)
36 (Good)
61 (Moderate)
61 (Moderate)
85 (Moderate)
98 (Moderate)
72 (Moderate)
36 (Good)
37 (Good)
38 (Good)
51 (Moderate)
69 (Moderate)
77 (Moderate)
91 (Moderate)
79 (Moderate)
83 (Moderate)
84 (Moderate)
39 (Good)
38 (Good)
51 (Moderate)
71 (Moderate)
82 (Moderate)
co
464 (Good)
452 (Good)
750 (Good)
1 (Good)
1 (Good)
1 (Good)
2 (Good)
1 (Good)
1 (Good)
1 (Good)
1 (Good)
1 (Good)
1 (Good)
1 (Good)
2 (Good)
3 (Good)
2 (Good)
2 (Good)
969 (Good)
824 (Good)
1 (Good)
39 (Good)
65 (Good)
o3
30 (Good)
25 (Good)
19 (Good)
19 (Good)
14 (Good)
15 (Good)
12 (Good)
17 (Good)
15 (Good)
14 (Good)
22 (Good)
52 (Good)
50 (Good)
34 (Good)
21 (Good)
11 (Good)
38 (Good)
49 (Good)
24 (Good)
26 (Good)
79 (Moderate)
59 (Good)
28 (Good)
so2
19 (Good)
19 (Good)
19 (Good)
18 (Good)
13 (Good)
12 (Good)
15 (Good)
13 (Good)
7.8 (Good)
9.1 (Good)
10 (Good)
12 (Good)
26 (Good)
23 (Good)
14 (Good)
12 (Good)
15 (Good)
17 (Good)
11 (Good)
10 (Good)
6.9 (Good)
21 (Good)
32 (Good)
data source »
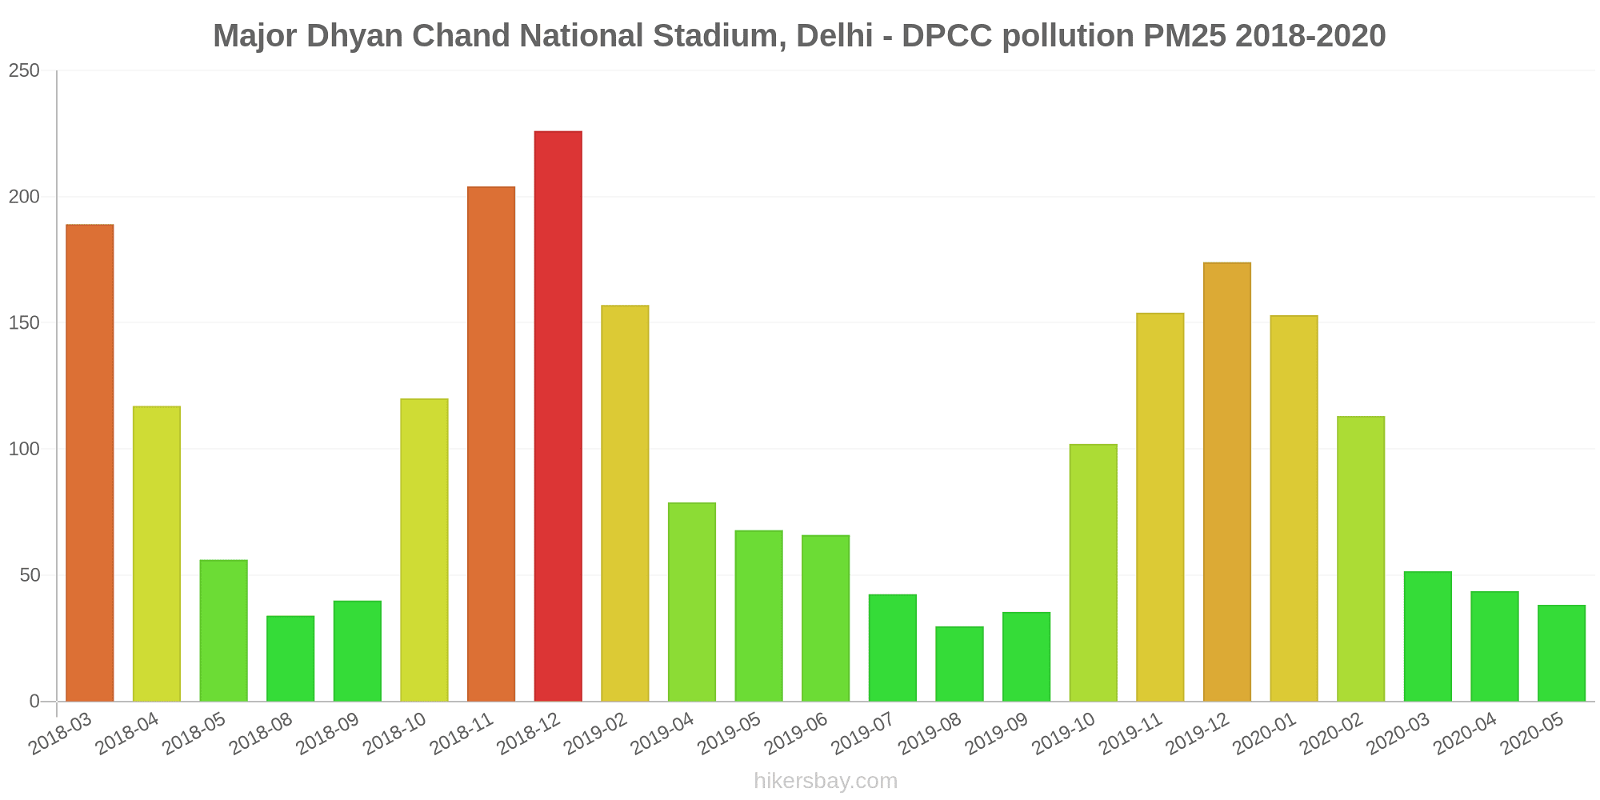
Major Dhyan Chand National Stadium, Delhi - DPCC
Senin, 31 Oktober 2022 00.45
PM2,5 228 (Sangat buruk berbahaya)
partikulat Matter (PM 2.5) debu
PM10 327 (Sangat buruk berbahaya)
partikulat Matter (PM10) debu tersuspensi
NO2 46 (Moderat)
nitrogen dioksida (NO2)
O3 1 (Bagus)
ozon (O3)
SO2 0.1 (Bagus)
sulfur dioksida (SO2)
CO 300 (Bagus)
karbon monoksida (CO)
Major Dhyan Chand National Stadium, Delhi - DPCC
index
2022-10-31
pm25
228
pm10
327
no2
46
o3
1
so2
0.1
co
300
Major Dhyan Chand National Stadium, Delhi - DPCC
2018-03 2020-05
index
2020-05
2020-04
2020-03
2020-02
2020-01
2019-12
2019-11
2019-10
2019-09
2019-08
2019-07
2019-06
2019-05
2019-04
2019-02
2018-12
2018-11
2018-10
2018-09
2018-08
2018-05
2018-04
2018-03
so2
19
19
19
18
13
12
15
13
7.8
9.1
10
12
26
23
14
12
15
17
11
10
6.9
21
32
pm25
38
44
52
113
153
174
154
102
35
30
42
66
68
79
157
226
204
120
40
34
56
117
189
pm10
86
92
108
200
232
316
278
215
88
76
136
188
235
265
307
413
326
269
91
81
187
204
210
no2
15
17
36
61
61
85
98
72
36
37
38
51
69
77
91
79
83
84
39
38
51
71
82
co
464
452
750
1
1
1
2
1
1
1
1
1
1
1
2
3
2
2
969
824
1
39
65
o3
30
25
19
19
14
15
12
17
15
14
22
52
50
34
21
11
38
49
24
26
79
59
28
* Pollution data source:
https://openaq.org
(caaqm)
The data is licensed under CC-By 4.0
PM2,5 228 (Sangat buruk berbahaya)
PM10 327 (Sangat buruk berbahaya)
NO2 46 (Moderat)
O3 1 (Bagus)
SO2 0 (Bagus)
CO 300 (Bagus)
Data tentang polusi udara dari beberapa hari terakhir di Indraprasiha
| index | 2022-10-31 |
|---|---|
| pm25 | 228 Very bad Hazardous |
| pm10 | 327 Very bad Hazardous |
| no2 | 46 Moderate |
| o3 | 1 Good |
| so2 | 0 Good |
| co | 300 Good |

| index | 2020-05 | 2020-04 | 2020-03 | 2020-02 | 2020-01 | 2019-12 | 2019-11 | 2019-10 | 2019-09 | 2019-08 | 2019-07 | 2019-06 | 2019-05 | 2019-04 | 2019-02 | 2018-12 | 2018-11 | 2018-10 | 2018-09 | 2018-08 | 2018-05 | 2018-04 | 2018-03 |
|---|---|---|---|---|---|---|---|---|---|---|---|---|---|---|---|---|---|---|---|---|---|---|---|
| pm25 | 38 (Unhealthy for Sensitive Groups) | 44 (Unhealthy for Sensitive Groups) | 52 (Unhealthy for Sensitive Groups) | 113 (Very bad Hazardous) | 153 (Very bad Hazardous) | 174 (Very bad Hazardous) | 154 (Very bad Hazardous) | 102 (Very Unhealthy) | 35 (Unhealthy for Sensitive Groups) | 30 (Moderate) | 42 (Unhealthy for Sensitive Groups) | 66 (Unhealthy) | 68 (Unhealthy) | 79 (Very Unhealthy) | 157 (Very bad Hazardous) | 226 (Very bad Hazardous) | 204 (Very bad Hazardous) | 120 (Very bad Hazardous) | 40 (Unhealthy for Sensitive Groups) | 34 (Moderate) | 56 (Unhealthy) | 117 (Very bad Hazardous) | 189 (Very bad Hazardous) |
| pm10 | 86 (Unhealthy) | 92 (Unhealthy) | 108 (Unhealthy) | 200 (Very bad Hazardous) | 232 (Very bad Hazardous) | 316 (Very bad Hazardous) | 278 (Very bad Hazardous) | 215 (Very bad Hazardous) | 88 (Unhealthy) | 76 (Unhealthy for Sensitive Groups) | 136 (Very Unhealthy) | 188 (Very bad Hazardous) | 235 (Very bad Hazardous) | 265 (Very bad Hazardous) | 307 (Very bad Hazardous) | 413 (Very bad Hazardous) | 326 (Very bad Hazardous) | 269 (Very bad Hazardous) | 91 (Unhealthy) | 81 (Unhealthy) | 187 (Very bad Hazardous) | 204 (Very bad Hazardous) | 210 (Very bad Hazardous) |
| no2 | 15 (Good) | 17 (Good) | 36 (Good) | 61 (Moderate) | 61 (Moderate) | 85 (Moderate) | 98 (Moderate) | 72 (Moderate) | 36 (Good) | 37 (Good) | 38 (Good) | 51 (Moderate) | 69 (Moderate) | 77 (Moderate) | 91 (Moderate) | 79 (Moderate) | 83 (Moderate) | 84 (Moderate) | 39 (Good) | 38 (Good) | 51 (Moderate) | 71 (Moderate) | 82 (Moderate) |
| co | 464 (Good) | 452 (Good) | 750 (Good) | 1 (Good) | 1 (Good) | 1 (Good) | 2 (Good) | 1 (Good) | 1 (Good) | 1 (Good) | 1 (Good) | 1 (Good) | 1 (Good) | 1 (Good) | 2 (Good) | 3 (Good) | 2 (Good) | 2 (Good) | 969 (Good) | 824 (Good) | 1 (Good) | 39 (Good) | 65 (Good) |
| o3 | 30 (Good) | 25 (Good) | 19 (Good) | 19 (Good) | 14 (Good) | 15 (Good) | 12 (Good) | 17 (Good) | 15 (Good) | 14 (Good) | 22 (Good) | 52 (Good) | 50 (Good) | 34 (Good) | 21 (Good) | 11 (Good) | 38 (Good) | 49 (Good) | 24 (Good) | 26 (Good) | 79 (Moderate) | 59 (Good) | 28 (Good) |
| so2 | 19 (Good) | 19 (Good) | 19 (Good) | 18 (Good) | 13 (Good) | 12 (Good) | 15 (Good) | 13 (Good) | 7.8 (Good) | 9.1 (Good) | 10 (Good) | 12 (Good) | 26 (Good) | 23 (Good) | 14 (Good) | 12 (Good) | 15 (Good) | 17 (Good) | 11 (Good) | 10 (Good) | 6.9 (Good) | 21 (Good) | 32 (Good) |
PM2,5 228 (Sangat buruk berbahaya)
partikulat Matter (PM 2.5) debuPM10 327 (Sangat buruk berbahaya)
partikulat Matter (PM10) debu tersuspensiNO2 46 (Moderat)
nitrogen dioksida (NO2)O3 1 (Bagus)
ozon (O3)SO2 0.1 (Bagus)
sulfur dioksida (SO2)CO 300 (Bagus)
karbon monoksida (CO)Major Dhyan Chand National Stadium, Delhi - DPCC
| index | 2022-10-31 |
|---|---|
| pm25 | 228 |
| pm10 | 327 |
| no2 | 46 |
| o3 | 1 |
| so2 | 0.1 |
| co | 300 |
Major Dhyan Chand National Stadium, Delhi - DPCC

| index | 2020-05 | 2020-04 | 2020-03 | 2020-02 | 2020-01 | 2019-12 | 2019-11 | 2019-10 | 2019-09 | 2019-08 | 2019-07 | 2019-06 | 2019-05 | 2019-04 | 2019-02 | 2018-12 | 2018-11 | 2018-10 | 2018-09 | 2018-08 | 2018-05 | 2018-04 | 2018-03 |
|---|---|---|---|---|---|---|---|---|---|---|---|---|---|---|---|---|---|---|---|---|---|---|---|
| so2 | 19 | 19 | 19 | 18 | 13 | 12 | 15 | 13 | 7.8 | 9.1 | 10 | 12 | 26 | 23 | 14 | 12 | 15 | 17 | 11 | 10 | 6.9 | 21 | 32 |
| pm25 | 38 | 44 | 52 | 113 | 153 | 174 | 154 | 102 | 35 | 30 | 42 | 66 | 68 | 79 | 157 | 226 | 204 | 120 | 40 | 34 | 56 | 117 | 189 |
| pm10 | 86 | 92 | 108 | 200 | 232 | 316 | 278 | 215 | 88 | 76 | 136 | 188 | 235 | 265 | 307 | 413 | 326 | 269 | 91 | 81 | 187 | 204 | 210 |
| no2 | 15 | 17 | 36 | 61 | 61 | 85 | 98 | 72 | 36 | 37 | 38 | 51 | 69 | 77 | 91 | 79 | 83 | 84 | 39 | 38 | 51 | 71 | 82 |
| co | 464 | 452 | 750 | 1 | 1 | 1 | 2 | 1 | 1 | 1 | 1 | 1 | 1 | 1 | 2 | 3 | 2 | 2 | 969 | 824 | 1 | 39 | 65 |
| o3 | 30 | 25 | 19 | 19 | 14 | 15 | 12 | 17 | 15 | 14 | 22 | 52 | 50 | 34 | 21 | 11 | 38 | 49 | 24 | 26 | 79 | 59 | 28 |