Polusi udara di Indrapuri: indeks kualitas udara real-time dan siaga asap.
Perkiraan kualitas polusi dan udara untuk Indrapuri. Hari ini Rabu, 13 Mei 2026. Nilai polusi udara berikut telah tercatat untuk Indrapuri:- nitrogen dioksida (NO2) - 26 (Bagus)
- karbon monoksida (CO) - 2345 (Moderat)
- ozon (O3) - 19 (Bagus)
- sulfur dioksida (SO2) - 11 (Bagus)
- partikulat Matter (PM 2.5) debu - 140 (Sangat buruk berbahaya)
- partikulat Matter (PM10) debu tersuspensi - 220 (Sangat buruk berbahaya)

Apa kualitas udara di Indrapuri hari ini? Apakah udara tercemar di Indrapuri?. Apakah ada Smog?
Seberapa tinggi tingkat NO2? (nitrogen dioksida (NO2))
26 (Bagus)
Seberapa tinggi tingkat CO? (karbon monoksida (CO))
2345 (Moderat)
Bagaimana tingkat O3 hari ini di Indrapuri? (ozon (O3))
19 (Bagus)
Apa tingkat polusi SO2? (sulfur dioksida (SO2))
11 (Bagus)
Apa tingkat saat PM 2,5 in Indrapuri? (partikulat Matter (PM 2.5) debu)
Hari ini PM 2.5 tingkat:
140 (Sangat buruk berbahaya)
Sebagai perbandingan, tingkat tertinggi PM 2,5 in Indrapuri dalam 7 hari terakhir adalah: 222 (Senin, 31 Oktober 2022) dan Terendah: 7 (Minggu, 9 Oktober 2022).
Nilai tertinggi PM 2.5 direkam: 223 (Desember 2018).
Tingkat terendah dari partikulat Matter PM 2.5 polusi terjadi di bulan: April (24).
Apa tingkat PM10 hari ini di Indrapuri? (partikulat Matter (PM10) debu tersuspensi)
Level saat ini dari partikulat Matter PM10 di Indrapuri adalah:
220 (Sangat buruk berbahaya)
Nilai PM10 tertinggi biasanya terjadi di bulan: 351 (Desember 2018).
Nilai terendah dari partikulat PM10 pencemaran Indrapuri biasanya dicatat di: September (8.4).
Data saat ini Jumat, 14 Oktober 2022 05.45
NO2 26 (Bagus)
CO 2345 (Moderat)
O3 19 (Bagus)
SO2 11 (Bagus)
PM2,5 140 (Sangat buruk berbahaya)
PM10 220 (Sangat buruk berbahaya)
Data tentang polusi udara dari beberapa hari terakhir di Indrapuri
index
2022-10-31
2022-10-07
2022-10-08
2022-10-09
2022-10-10
2022-10-11
2022-10-12
2022-10-13
2022-10-14
no2
36
Good
13
Good
24
Good
17
Good
22
Good
34
Good
50
Moderate
27
Good
23
Good
co
1800
Good
-
Good
1732
Good
1918
Good
1991
Good
2553
Moderate
2810
Moderate
2858
Moderate
2921
Moderate
o3
2
Good
29
Good
27
Good
23
Good
20
Good
29
Good
23
Good
26
Good
31
Good
so2
17
Good
7
Good
-
Good
10
Good
8
Good
7
Good
7
Good
4
Good
-
Good
pm25
222
Very bad Hazardous
10
Good
9
Good
7
Good
14
Moderate
21
Moderate
63
Unhealthy
44
Unhealthy for Sensitive Groups
59
Unhealthy
pm10
299
Very bad Hazardous
21
Moderate
11
Good
11
Good
25
Moderate
84
Unhealthy
192
Very bad Hazardous
81
Unhealthy
130
Very Unhealthy
data source »
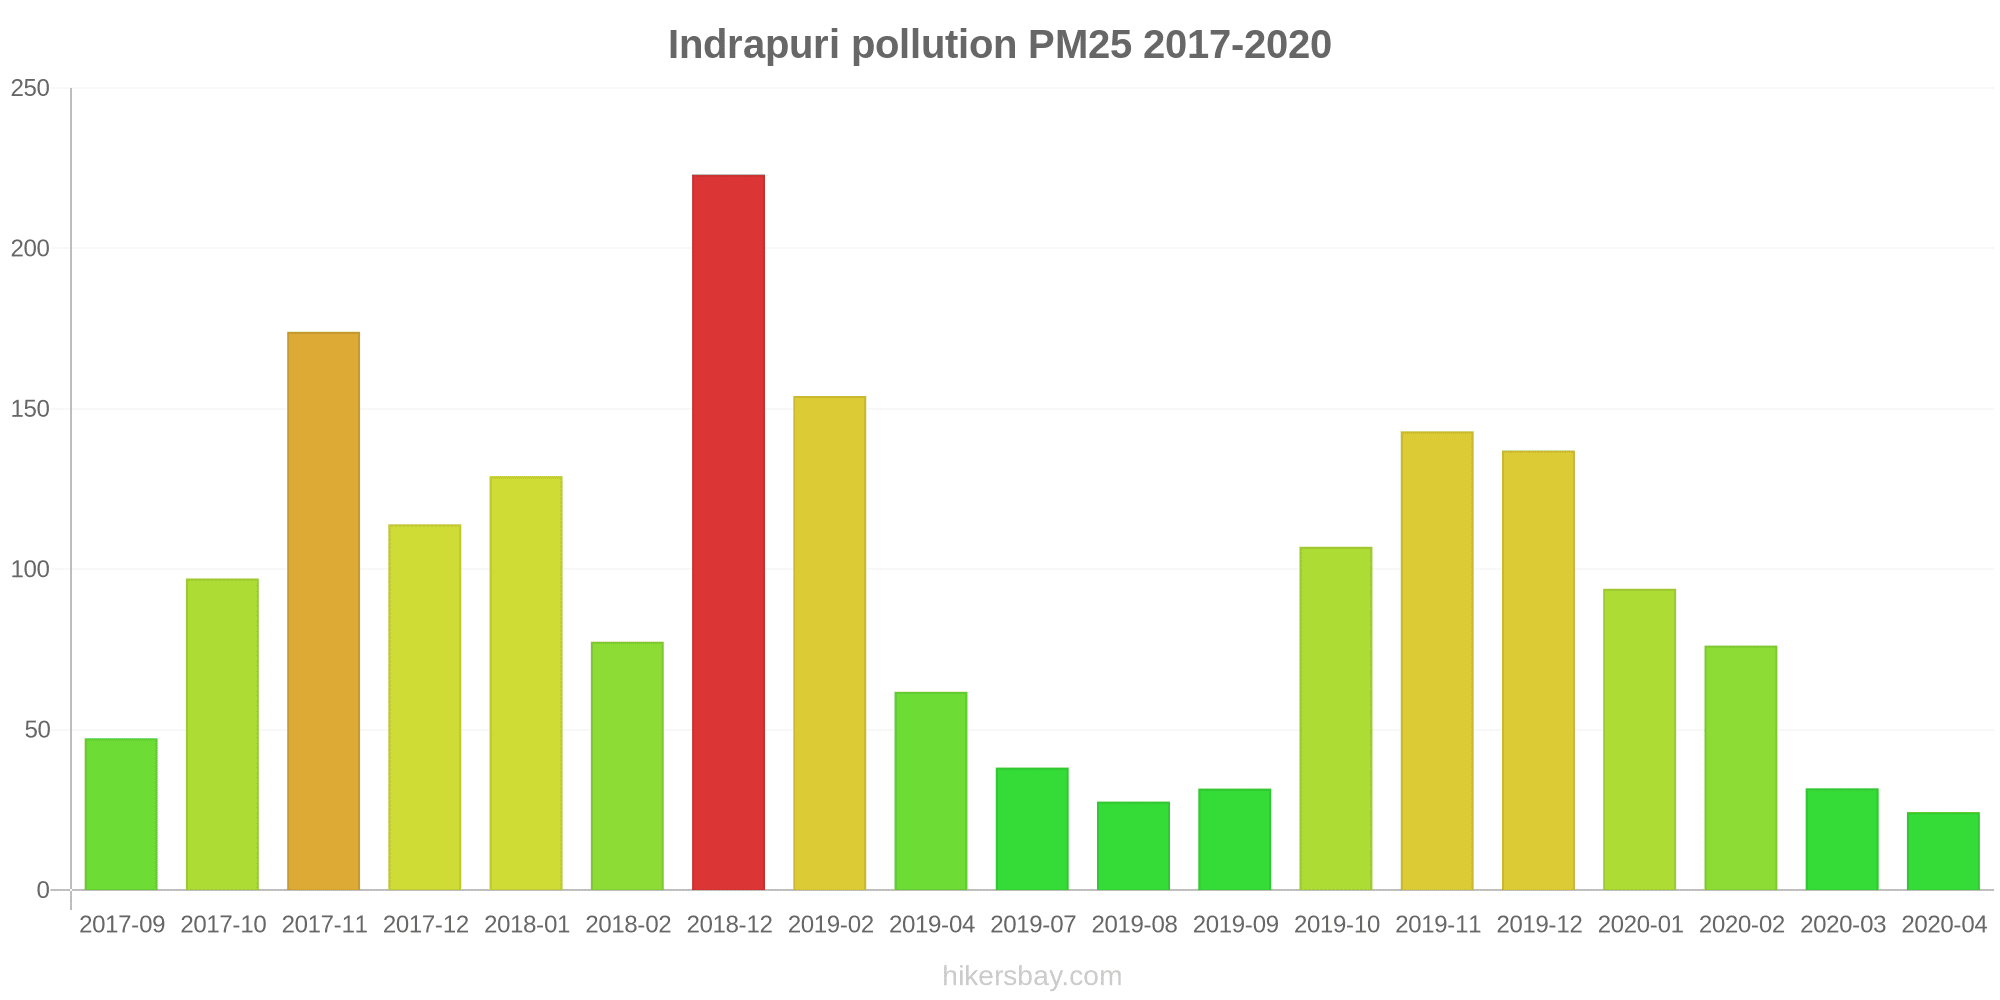
Polusi udara di Indrapuri dari September 2017 ke Mei 2020

index
2020-05
2020-04
2020-03
2020-02
2020-01
2019-12
2019-11
2019-10
2019-09
2019-08
2019-07
2019-05
2019-04
2019-02
2018-12
2018-02
2018-01
2017-12
2017-11
2017-10
2017-09
no2
30 (Good)
76 (Moderate)
37 (Good)
39 (Good)
81 (Moderate)
39 (Good)
49 (Moderate)
32 (Good)
22 (Good)
19 (Good)
42 (Moderate)
56 (Moderate)
50 (Moderate)
89 (Moderate)
67 (Moderate)
15 (Good)
38 (Good)
9.9 (Good)
15 (Good)
42 (Moderate)
9.3 (Good)
co
631 (Good)
582 (Good)
374 (Good)
1 (Good)
1.5 (Good)
1.5 (Good)
1.5 (Good)
1.5 (Good)
744 (Good)
354 (Good)
1 (Good)
874 (Good)
300 (Good)
1.5 (Good)
1.5 (Good)
1 (Good)
3 (Good)
3 (Good)
2 (Good)
1 (Good)
1 (Good)
o3
97 (Moderate)
46 (Good)
28 (Good)
29 (Good)
18 (Good)
17 (Good)
22 (Good)
42 (Good)
28 (Good)
21 (Good)
30 (Good)
57 (Good)
33 (Good)
22 (Good)
17 (Good)
- (Good)
- (Good)
- (Good)
- (Good)
- (Good)
- (Good)
so2
- (Good)
6.3 (Good)
15 (Good)
21 (Good)
17 (Good)
12 (Good)
15 (Good)
17 (Good)
12 (Good)
14 (Good)
10 (Good)
25 (Good)
28 (Good)
13 (Good)
12 (Good)
- (Good)
- (Good)
- (Good)
- (Good)
- (Good)
- (Good)
pm25
- (Good)
24 (Moderate)
32 (Moderate)
76 (Very Unhealthy)
94 (Very Unhealthy)
137 (Very bad Hazardous)
143 (Very bad Hazardous)
107 (Very Unhealthy)
32 (Moderate)
28 (Moderate)
38 (Unhealthy for Sensitive Groups)
- (Good)
62 (Unhealthy)
154 (Very bad Hazardous)
223 (Very bad Hazardous)
77 (Very Unhealthy)
129 (Very bad Hazardous)
114 (Very bad Hazardous)
174 (Very bad Hazardous)
97 (Very Unhealthy)
47 (Unhealthy for Sensitive Groups)
pm10
- (Good)
70 (Unhealthy for Sensitive Groups)
100 (Unhealthy)
150 (Very bad Hazardous)
166 (Very bad Hazardous)
248 (Very bad Hazardous)
246 (Very bad Hazardous)
186 (Very bad Hazardous)
62 (Unhealthy for Sensitive Groups)
55 (Unhealthy for Sensitive Groups)
109 (Unhealthy)
- (Good)
220 (Very bad Hazardous)
226 (Very bad Hazardous)
351 (Very bad Hazardous)
149 (Very Unhealthy)
230 (Very bad Hazardous)
213 (Very bad Hazardous)
295 (Very bad Hazardous)
188 (Very bad Hazardous)
8.4 (Good)
data source »
Pusa, New Delhi - IMD
Senin, 31 Oktober 2022 00.45
NO2 36 (Bagus)
nitrogen dioksida (NO2)
CO 1800 (Bagus)
karbon monoksida (CO)
O3 1.5 (Bagus)
ozon (O3)
SO2 17 (Bagus)
sulfur dioksida (SO2)
PM2,5 222 (Sangat buruk berbahaya)
partikulat Matter (PM 2.5) debu
PM10 299 (Sangat buruk berbahaya)
partikulat Matter (PM10) debu tersuspensi
Jumat, 14 Oktober 2022 05.45
NO2 15 (Bagus)
nitrogen dioksida (NO2)
PM10 141 (Sangat tidak sehat)
partikulat Matter (PM10) debu tersuspensi
O3 37 (Bagus)
ozon (O3)
CO 2890 (Moderat)
karbon monoksida (CO)
PM2,5 59 (Tidak sehat)
partikulat Matter (PM 2.5) debu
SO2 5.9 (Bagus)
sulfur dioksida (SO2)
Pusa, New Delhi - IMD
index
2022-10-31
no2
36
co
1800
o3
1.5
so2
17
pm25
222
pm10
299
index
2022-10-14
2022-10-13
2022-10-12
2022-10-11
2022-10-10
2022-10-09
2022-10-08
2022-10-07
no2
23
27
50
34
22
17
24
13
so2
-
3.6
6.9
7.3
8.3
9.5
-
7.4
pm25
59
44
63
21
14
7.1
8.9
10
o3
31
26
23
29
20
23
27
29
pm10
130
81
192
84
25
11
11
21
co
2921
2858
2810
2553
1991
1918
1732
-
Pusa, Delhi - DPCC
index
2020-05
2020-04
2020-03
2020-02
2020-01
2019-12
2019-11
2019-10
2019-09
2019-08
2019-07
2019-05
2019-04
2019-02
2018-12
no2
30
20
49
64
59
53
72
60
31
27
42
56
88
89
86
so2
-
6.3
15
21
17
12
15
17
12
14
10
25
28
13
12
co
631
426
747
1
2
2
2
1
915
1
1
874
1
1
2
o3
97
71
32
29
15
15
15
29
29
20
28
57
29
20
14
Pusa, Delhi - IMD
2017-09 2020-04

index
2020-04
2020-03
2020-02
2020-01
2019-12
2019-11
2019-10
2019-09
2019-08
2019-07
2019-04
2019-02
2018-12
2018-02
2018-01
2017-12
2017-11
2017-10
2017-09
no2
132
25
14
104
25
27
4
13
12
43
12
-
48
15
38
9.9
15
42
9.3
co
738
1
1
1
1
1
2
573
706
1
598
2
1
1
3
3
2
1
1
pm25
24
32
76
94
137
143
107
32
28
38
62
154
223
77
129
114
174
97
47
pm10
70
100
150
166
248
246
186
62
55
109
220
226
351
149
230
213
295
188
8.4
o3
22
23
29
22
19
28
55
27
23
32
38
23
20
-
-
-
-
-
-
* Pollution data source:
https://openaq.org
(caaqm)
The data is licensed under CC-By 4.0
NO2 26 (Bagus)
CO 2345 (Moderat)
O3 19 (Bagus)
SO2 11 (Bagus)
PM2,5 140 (Sangat buruk berbahaya)
PM10 220 (Sangat buruk berbahaya)
Data tentang polusi udara dari beberapa hari terakhir di Indrapuri
| index | 2022-10-31 | 2022-10-07 | 2022-10-08 | 2022-10-09 | 2022-10-10 | 2022-10-11 | 2022-10-12 | 2022-10-13 | 2022-10-14 |
|---|---|---|---|---|---|---|---|---|---|
| no2 | 36 Good |
13 Good |
24 Good |
17 Good |
22 Good |
34 Good |
50 Moderate |
27 Good |
23 Good |
| co | 1800 Good |
- Good |
1732 Good |
1918 Good |
1991 Good |
2553 Moderate |
2810 Moderate |
2858 Moderate |
2921 Moderate |
| o3 | 2 Good |
29 Good |
27 Good |
23 Good |
20 Good |
29 Good |
23 Good |
26 Good |
31 Good |
| so2 | 17 Good |
7 Good |
- Good |
10 Good |
8 Good |
7 Good |
7 Good |
4 Good |
- Good |
| pm25 | 222 Very bad Hazardous |
10 Good |
9 Good |
7 Good |
14 Moderate |
21 Moderate |
63 Unhealthy |
44 Unhealthy for Sensitive Groups |
59 Unhealthy |
| pm10 | 299 Very bad Hazardous |
21 Moderate |
11 Good |
11 Good |
25 Moderate |
84 Unhealthy |
192 Very bad Hazardous |
81 Unhealthy |
130 Very Unhealthy |
| index | 2020-05 | 2020-04 | 2020-03 | 2020-02 | 2020-01 | 2019-12 | 2019-11 | 2019-10 | 2019-09 | 2019-08 | 2019-07 | 2019-05 | 2019-04 | 2019-02 | 2018-12 | 2018-02 | 2018-01 | 2017-12 | 2017-11 | 2017-10 | 2017-09 |
|---|---|---|---|---|---|---|---|---|---|---|---|---|---|---|---|---|---|---|---|---|---|
| no2 | 30 (Good) | 76 (Moderate) | 37 (Good) | 39 (Good) | 81 (Moderate) | 39 (Good) | 49 (Moderate) | 32 (Good) | 22 (Good) | 19 (Good) | 42 (Moderate) | 56 (Moderate) | 50 (Moderate) | 89 (Moderate) | 67 (Moderate) | 15 (Good) | 38 (Good) | 9.9 (Good) | 15 (Good) | 42 (Moderate) | 9.3 (Good) |
| co | 631 (Good) | 582 (Good) | 374 (Good) | 1 (Good) | 1.5 (Good) | 1.5 (Good) | 1.5 (Good) | 1.5 (Good) | 744 (Good) | 354 (Good) | 1 (Good) | 874 (Good) | 300 (Good) | 1.5 (Good) | 1.5 (Good) | 1 (Good) | 3 (Good) | 3 (Good) | 2 (Good) | 1 (Good) | 1 (Good) |
| o3 | 97 (Moderate) | 46 (Good) | 28 (Good) | 29 (Good) | 18 (Good) | 17 (Good) | 22 (Good) | 42 (Good) | 28 (Good) | 21 (Good) | 30 (Good) | 57 (Good) | 33 (Good) | 22 (Good) | 17 (Good) | - (Good) | - (Good) | - (Good) | - (Good) | - (Good) | - (Good) |
| so2 | - (Good) | 6.3 (Good) | 15 (Good) | 21 (Good) | 17 (Good) | 12 (Good) | 15 (Good) | 17 (Good) | 12 (Good) | 14 (Good) | 10 (Good) | 25 (Good) | 28 (Good) | 13 (Good) | 12 (Good) | - (Good) | - (Good) | - (Good) | - (Good) | - (Good) | - (Good) |
| pm25 | - (Good) | 24 (Moderate) | 32 (Moderate) | 76 (Very Unhealthy) | 94 (Very Unhealthy) | 137 (Very bad Hazardous) | 143 (Very bad Hazardous) | 107 (Very Unhealthy) | 32 (Moderate) | 28 (Moderate) | 38 (Unhealthy for Sensitive Groups) | - (Good) | 62 (Unhealthy) | 154 (Very bad Hazardous) | 223 (Very bad Hazardous) | 77 (Very Unhealthy) | 129 (Very bad Hazardous) | 114 (Very bad Hazardous) | 174 (Very bad Hazardous) | 97 (Very Unhealthy) | 47 (Unhealthy for Sensitive Groups) |
| pm10 | - (Good) | 70 (Unhealthy for Sensitive Groups) | 100 (Unhealthy) | 150 (Very bad Hazardous) | 166 (Very bad Hazardous) | 248 (Very bad Hazardous) | 246 (Very bad Hazardous) | 186 (Very bad Hazardous) | 62 (Unhealthy for Sensitive Groups) | 55 (Unhealthy for Sensitive Groups) | 109 (Unhealthy) | - (Good) | 220 (Very bad Hazardous) | 226 (Very bad Hazardous) | 351 (Very bad Hazardous) | 149 (Very Unhealthy) | 230 (Very bad Hazardous) | 213 (Very bad Hazardous) | 295 (Very bad Hazardous) | 188 (Very bad Hazardous) | 8.4 (Good) |
NO2 36 (Bagus)
nitrogen dioksida (NO2)CO 1800 (Bagus)
karbon monoksida (CO)O3 1.5 (Bagus)
ozon (O3)SO2 17 (Bagus)
sulfur dioksida (SO2)PM2,5 222 (Sangat buruk berbahaya)
partikulat Matter (PM 2.5) debuPM10 299 (Sangat buruk berbahaya)
partikulat Matter (PM10) debu tersuspensiNO2 15 (Bagus)
nitrogen dioksida (NO2)PM10 141 (Sangat tidak sehat)
partikulat Matter (PM10) debu tersuspensiO3 37 (Bagus)
ozon (O3)CO 2890 (Moderat)
karbon monoksida (CO)PM2,5 59 (Tidak sehat)
partikulat Matter (PM 2.5) debuSO2 5.9 (Bagus)
sulfur dioksida (SO2)Pusa, New Delhi - IMD
| index | 2022-10-31 |
|---|---|
| no2 | 36 |
| co | 1800 |
| o3 | 1.5 |
| so2 | 17 |
| pm25 | 222 |
| pm10 | 299 |
| index | 2022-10-14 | 2022-10-13 | 2022-10-12 | 2022-10-11 | 2022-10-10 | 2022-10-09 | 2022-10-08 | 2022-10-07 |
|---|---|---|---|---|---|---|---|---|
| no2 | 23 | 27 | 50 | 34 | 22 | 17 | 24 | 13 |
| so2 | - | 3.6 | 6.9 | 7.3 | 8.3 | 9.5 | - | 7.4 |
| pm25 | 59 | 44 | 63 | 21 | 14 | 7.1 | 8.9 | 10 |
| o3 | 31 | 26 | 23 | 29 | 20 | 23 | 27 | 29 |
| pm10 | 130 | 81 | 192 | 84 | 25 | 11 | 11 | 21 |
| co | 2921 | 2858 | 2810 | 2553 | 1991 | 1918 | 1732 | - |
Pusa, Delhi - DPCC
| index | 2020-05 | 2020-04 | 2020-03 | 2020-02 | 2020-01 | 2019-12 | 2019-11 | 2019-10 | 2019-09 | 2019-08 | 2019-07 | 2019-05 | 2019-04 | 2019-02 | 2018-12 |
|---|---|---|---|---|---|---|---|---|---|---|---|---|---|---|---|
| no2 | 30 | 20 | 49 | 64 | 59 | 53 | 72 | 60 | 31 | 27 | 42 | 56 | 88 | 89 | 86 |
| so2 | - | 6.3 | 15 | 21 | 17 | 12 | 15 | 17 | 12 | 14 | 10 | 25 | 28 | 13 | 12 |
| co | 631 | 426 | 747 | 1 | 2 | 2 | 2 | 1 | 915 | 1 | 1 | 874 | 1 | 1 | 2 |
| o3 | 97 | 71 | 32 | 29 | 15 | 15 | 15 | 29 | 29 | 20 | 28 | 57 | 29 | 20 | 14 |
Pusa, Delhi - IMD
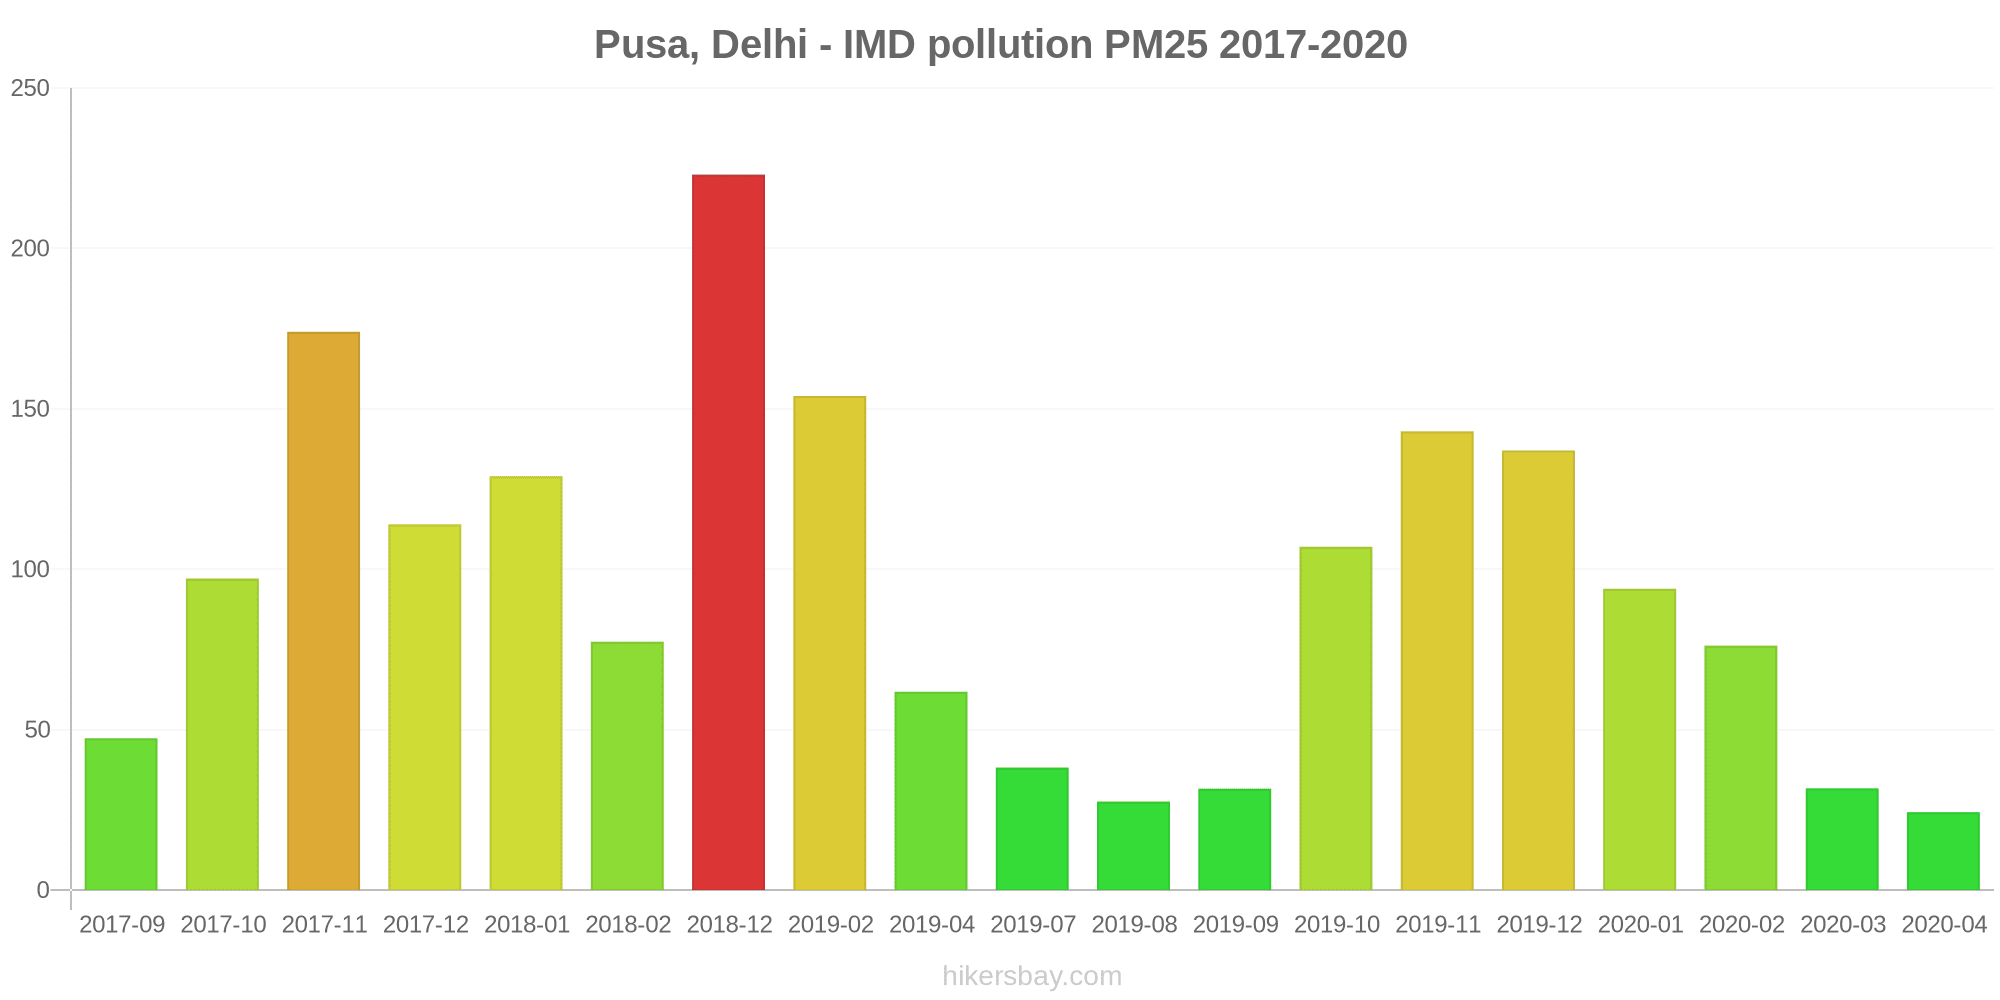
| index | 2020-04 | 2020-03 | 2020-02 | 2020-01 | 2019-12 | 2019-11 | 2019-10 | 2019-09 | 2019-08 | 2019-07 | 2019-04 | 2019-02 | 2018-12 | 2018-02 | 2018-01 | 2017-12 | 2017-11 | 2017-10 | 2017-09 |
|---|---|---|---|---|---|---|---|---|---|---|---|---|---|---|---|---|---|---|---|
| no2 | 132 | 25 | 14 | 104 | 25 | 27 | 4 | 13 | 12 | 43 | 12 | - | 48 | 15 | 38 | 9.9 | 15 | 42 | 9.3 |
| co | 738 | 1 | 1 | 1 | 1 | 1 | 2 | 573 | 706 | 1 | 598 | 2 | 1 | 1 | 3 | 3 | 2 | 1 | 1 |
| pm25 | 24 | 32 | 76 | 94 | 137 | 143 | 107 | 32 | 28 | 38 | 62 | 154 | 223 | 77 | 129 | 114 | 174 | 97 | 47 |
| pm10 | 70 | 100 | 150 | 166 | 248 | 246 | 186 | 62 | 55 | 109 | 220 | 226 | 351 | 149 | 230 | 213 | 295 | 188 | 8.4 |
| o3 | 22 | 23 | 29 | 22 | 19 | 28 | 55 | 27 | 23 | 32 | 38 | 23 | 20 | - | - | - | - | - | - |