Polusi udara di Bāgrola: indeks kualitas udara real-time dan siaga asap.
Perkiraan kualitas polusi dan udara untuk Bāgrola. Hari ini Rabu, 13 Mei 2026. Nilai polusi udara berikut telah tercatat untuk Bāgrola:- partikulat Matter (PM 2.5) debu - 22 (Moderat)
- karbon monoksida (CO) - 219 (Bagus)
- ozon (O3) - 0 (Bagus)
- nitrogen dioksida (NO2) - 7 (Bagus)
- partikulat Matter (PM10) debu tersuspensi - 36 (Moderat)
- sulfur dioksida (SO2) - 8 (Bagus)

Apa kualitas udara di Bāgrola hari ini? Apakah udara tercemar di Bāgrola?. Apakah ada Smog?
Apa tingkat saat PM 2,5 in Bāgrola? (partikulat Matter (PM 2.5) debu)
Hari ini PM 2.5 tingkat:
22 (Moderat)
Sebagai perbandingan, tingkat tertinggi PM 2,5 in Bāgrola dalam 7 hari terakhir adalah: 23 (Jumat, 27 Mei 2022) dan Terendah: 23 (Jumat, 27 Mei 2022).
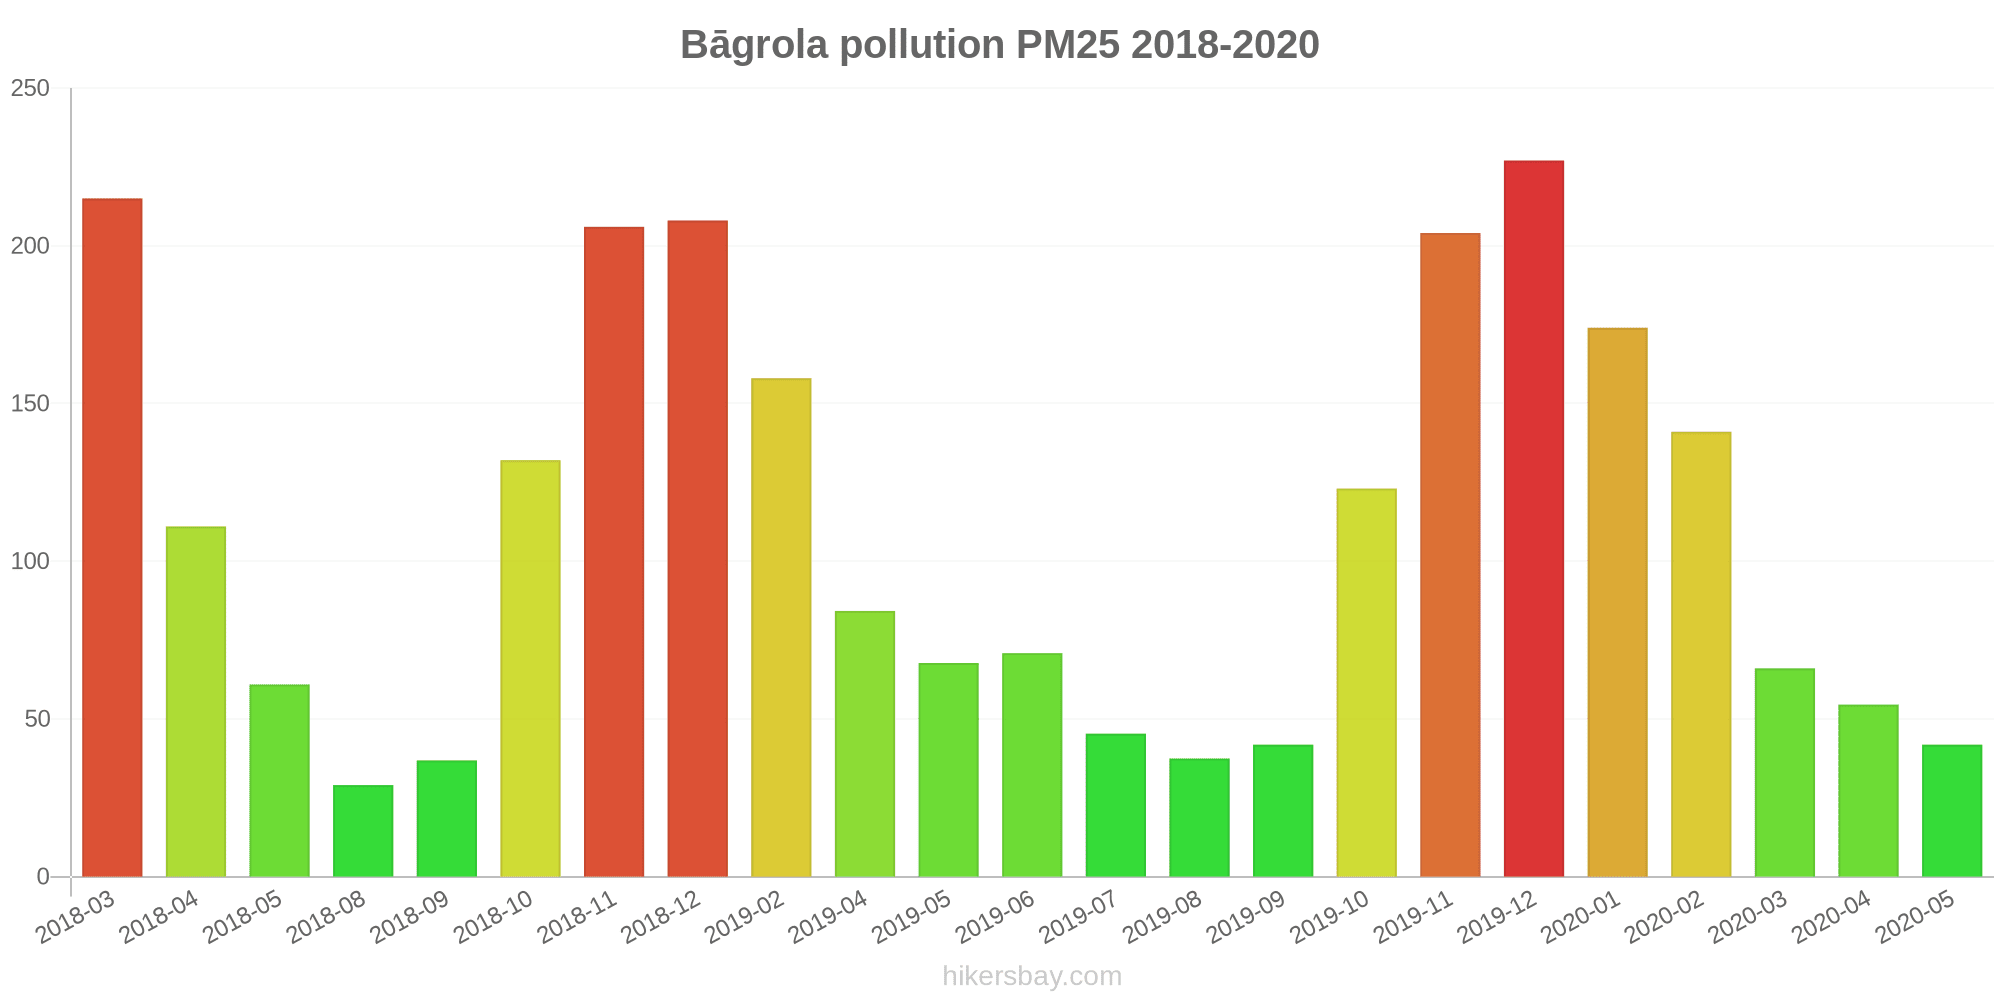
Nilai tertinggi PM 2.5 direkam: 227 (Desember 2019).
Tingkat terendah dari partikulat Matter PM 2.5 polusi terjadi di bulan: Agustus (29).
Seberapa tinggi tingkat CO? (karbon monoksida (CO))
219 (Bagus)
Bagaimana tingkat O3 hari ini di Bāgrola? (ozon (O3))
0 (Bagus)
Seberapa tinggi tingkat NO2? (nitrogen dioksida (NO2))
7 (Bagus)
Apa tingkat PM10 hari ini di Bāgrola? (partikulat Matter (PM10) debu tersuspensi)
Level saat ini dari partikulat Matter PM10 di Bāgrola adalah:
36 (Moderat)
Nilai PM10 tertinggi biasanya terjadi di bulan: 464 (Desember 2018).
Nilai terendah dari partikulat PM10 pencemaran Bāgrola biasanya dicatat di: Mei (117).
Apa tingkat polusi SO2? (sulfur dioksida (SO2))
8 (Bagus)
Data saat ini Jumat, 27 Mei 2022 15.00
PM2,5 22 (Moderat)
CO 219 (Bagus)
O3 0 (Bagus)
NO2 7 (Bagus)
PM10 36 (Moderat)
SO2 8 (Bagus)
Data tentang polusi udara dari beberapa hari terakhir di Bāgrola
index
2022-05-27
pm25
23
Moderate
co
475
Good
o3
25
Good
no2
21
Good
pm10
32
Moderate
so2
4
Good
data source »
Polusi udara di Bāgrola dari Maret 2018 ke Mei 2020

index
2020-05
2020-04
2020-03
2020-02
2020-01
2019-12
2019-11
2019-10
2019-09
2019-08
2019-07
2019-06
2019-05
2019-04
2019-02
2018-12
2018-11
2018-10
2018-09
2018-08
2018-05
2018-04
2018-03
pm25
42 (Unhealthy for Sensitive Groups)
55 (Unhealthy for Sensitive Groups)
66 (Unhealthy)
141 (Very bad Hazardous)
174 (Very bad Hazardous)
227 (Very bad Hazardous)
204 (Very bad Hazardous)
123 (Very bad Hazardous)
42 (Unhealthy for Sensitive Groups)
37 (Unhealthy for Sensitive Groups)
45 (Unhealthy for Sensitive Groups)
71 (Unhealthy)
68 (Unhealthy)
84 (Very Unhealthy)
158 (Very bad Hazardous)
208 (Very bad Hazardous)
206 (Very bad Hazardous)
132 (Very bad Hazardous)
37 (Unhealthy for Sensitive Groups)
29 (Moderate)
61 (Unhealthy)
111 (Very bad Hazardous)
215 (Very bad Hazardous)
pm10
117 (Very Unhealthy)
120 (Very Unhealthy)
185 (Very bad Hazardous)
359 (Very bad Hazardous)
353 (Very bad Hazardous)
433 (Very bad Hazardous)
433 (Very bad Hazardous)
370 (Very bad Hazardous)
174 (Very bad Hazardous)
139 (Very Unhealthy)
247 (Very bad Hazardous)
301 (Very bad Hazardous)
280 (Very bad Hazardous)
373 (Very bad Hazardous)
413 (Very bad Hazardous)
464 (Very bad Hazardous)
398 (Very bad Hazardous)
431 (Very bad Hazardous)
152 (Very bad Hazardous)
135 (Very Unhealthy)
183 (Very bad Hazardous)
202 (Very bad Hazardous)
267 (Very bad Hazardous)
no2
16 (Good)
18 (Good)
43 (Moderate)
65 (Moderate)
55 (Moderate)
55 (Moderate)
61 (Moderate)
44 (Moderate)
27 (Good)
27 (Good)
28 (Good)
36 (Good)
49 (Moderate)
57 (Moderate)
44 (Moderate)
48 (Moderate)
42 (Moderate)
51 (Moderate)
26 (Good)
26 (Good)
28 (Good)
25 (Good)
41 (Moderate)
so2
14 (Good)
19 (Good)
20 (Good)
20 (Good)
16 (Good)
14 (Good)
19 (Good)
13 (Good)
7.9 (Good)
16 (Good)
17 (Good)
22 (Good)
31 (Good)
39 (Good)
11 (Good)
19 (Good)
26 (Good)
19 (Good)
9.8 (Good)
11 (Good)
6.5 (Good)
7.2 (Good)
7.8 (Good)
co
535 (Good)
515 (Good)
545 (Good)
1 (Good)
1 (Good)
2 (Good)
2 (Good)
1 (Good)
1 (Good)
1 (Good)
1 (Good)
1 (Good)
1 (Good)
1 (Good)
2 (Good)
2 (Good)
2 (Good)
2 (Good)
1 (Good)
1 (Good)
1 (Good)
30 (Good)
56 (Good)
o3
84 (Moderate)
63 (Good)
38 (Good)
34 (Good)
19 (Good)
22 (Good)
36 (Good)
33 (Good)
36 (Good)
27 (Good)
39 (Good)
67 (Good)
72 (Moderate)
51 (Good)
22 (Good)
18 (Good)
41 (Good)
50 (Good)
23 (Good)
22 (Good)
90 (Moderate)
75 (Moderate)
40 (Good)
data source »
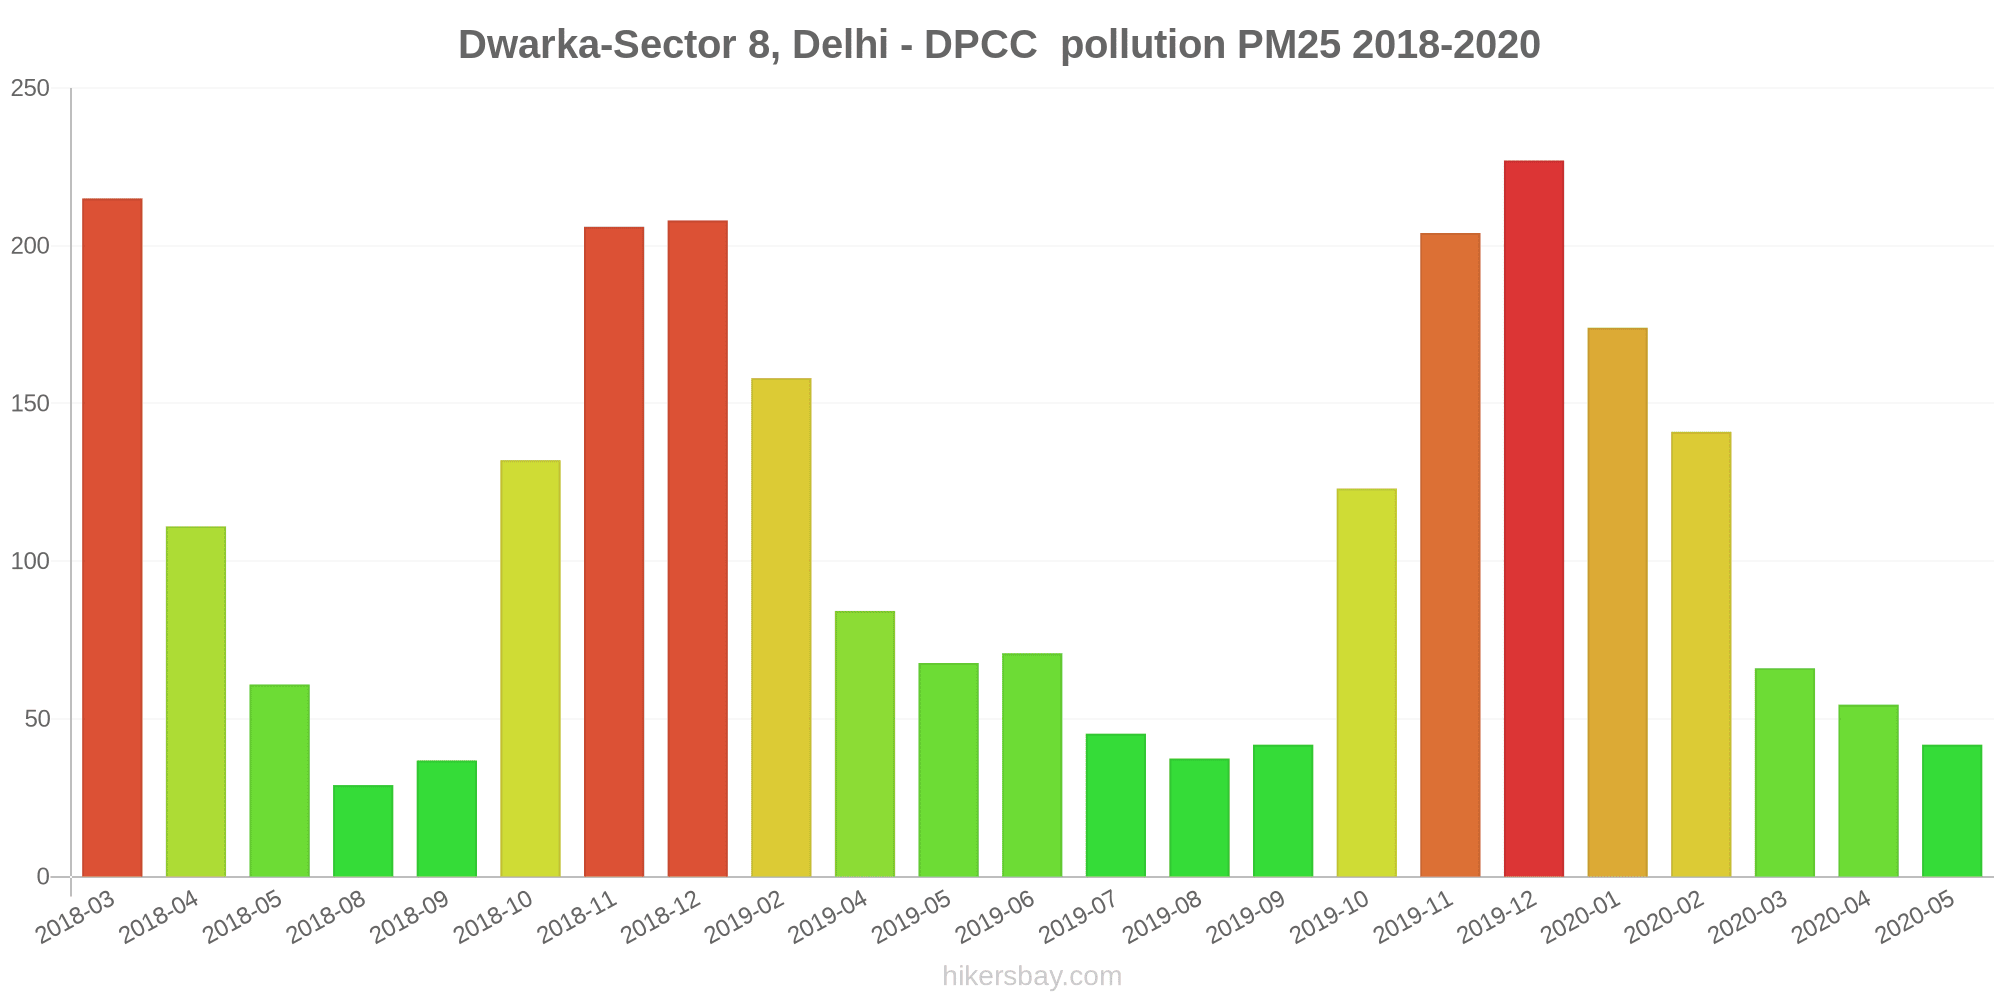
Dwarka-Sector 8, Delhi - DPCC
Jumat, 27 Mei 2022 15.00
PM2,5 22 (Moderat)
partikulat Matter (PM 2.5) debu
CO 219 (Bagus)
karbon monoksida (CO)
O3 0.05 (Bagus)
ozon (O3)
NO2 7 (Bagus)
nitrogen dioksida (NO2)
PM10 36 (Moderat)
partikulat Matter (PM10) debu tersuspensi
SO2 7.7 (Bagus)
sulfur dioksida (SO2)
Dwarka-Sector 8, Delhi - DPCC
index
2022-05-27
pm25
23
co
475
o3
25
no2
21
pm10
32
so2
4.4
Dwarka-Sector 8, Delhi - DPCC
2018-03 2020-05

index
2020-05
2020-04
2020-03
2020-02
2020-01
2019-12
2019-11
2019-10
2019-09
2019-08
2019-07
2019-06
2019-05
2019-04
2019-02
2018-12
2018-11
2018-10
2018-09
2018-08
2018-05
2018-04
2018-03
pm25
42
55
66
141
174
227
204
123
42
37
45
71
68
84
158
208
206
132
37
29
61
111
215
pm10
117
120
185
359
353
433
433
370
174
139
247
301
280
373
413
464
398
431
152
135
183
202
267
no2
16
18
43
65
55
55
61
44
27
27
28
36
49
57
44
48
42
51
26
26
28
25
41
so2
14
19
20
20
16
14
19
13
7.9
16
17
22
31
39
11
19
26
19
9.8
11
6.5
7.2
7.8
co
535
515
545
1
1
2
2
1
1
1
1
1
1
1
2
2
2
2
1
1
1
30
56
o3
84
63
38
34
19
22
36
33
36
27
39
67
72
51
22
18
41
50
23
22
90
75
40
* Pollution data source:
https://openaq.org
(caaqm)
The data is licensed under CC-By 4.0
PM2,5 22 (Moderat)
CO 219 (Bagus)
O3 0 (Bagus)
NO2 7 (Bagus)
PM10 36 (Moderat)
SO2 8 (Bagus)
Data tentang polusi udara dari beberapa hari terakhir di Bāgrola
| index | 2022-05-27 |
|---|---|
| pm25 | 23 Moderate |
| co | 475 Good |
| o3 | 25 Good |
| no2 | 21 Good |
| pm10 | 32 Moderate |
| so2 | 4 Good |
| index | 2020-05 | 2020-04 | 2020-03 | 2020-02 | 2020-01 | 2019-12 | 2019-11 | 2019-10 | 2019-09 | 2019-08 | 2019-07 | 2019-06 | 2019-05 | 2019-04 | 2019-02 | 2018-12 | 2018-11 | 2018-10 | 2018-09 | 2018-08 | 2018-05 | 2018-04 | 2018-03 |
|---|---|---|---|---|---|---|---|---|---|---|---|---|---|---|---|---|---|---|---|---|---|---|---|
| pm25 | 42 (Unhealthy for Sensitive Groups) | 55 (Unhealthy for Sensitive Groups) | 66 (Unhealthy) | 141 (Very bad Hazardous) | 174 (Very bad Hazardous) | 227 (Very bad Hazardous) | 204 (Very bad Hazardous) | 123 (Very bad Hazardous) | 42 (Unhealthy for Sensitive Groups) | 37 (Unhealthy for Sensitive Groups) | 45 (Unhealthy for Sensitive Groups) | 71 (Unhealthy) | 68 (Unhealthy) | 84 (Very Unhealthy) | 158 (Very bad Hazardous) | 208 (Very bad Hazardous) | 206 (Very bad Hazardous) | 132 (Very bad Hazardous) | 37 (Unhealthy for Sensitive Groups) | 29 (Moderate) | 61 (Unhealthy) | 111 (Very bad Hazardous) | 215 (Very bad Hazardous) |
| pm10 | 117 (Very Unhealthy) | 120 (Very Unhealthy) | 185 (Very bad Hazardous) | 359 (Very bad Hazardous) | 353 (Very bad Hazardous) | 433 (Very bad Hazardous) | 433 (Very bad Hazardous) | 370 (Very bad Hazardous) | 174 (Very bad Hazardous) | 139 (Very Unhealthy) | 247 (Very bad Hazardous) | 301 (Very bad Hazardous) | 280 (Very bad Hazardous) | 373 (Very bad Hazardous) | 413 (Very bad Hazardous) | 464 (Very bad Hazardous) | 398 (Very bad Hazardous) | 431 (Very bad Hazardous) | 152 (Very bad Hazardous) | 135 (Very Unhealthy) | 183 (Very bad Hazardous) | 202 (Very bad Hazardous) | 267 (Very bad Hazardous) |
| no2 | 16 (Good) | 18 (Good) | 43 (Moderate) | 65 (Moderate) | 55 (Moderate) | 55 (Moderate) | 61 (Moderate) | 44 (Moderate) | 27 (Good) | 27 (Good) | 28 (Good) | 36 (Good) | 49 (Moderate) | 57 (Moderate) | 44 (Moderate) | 48 (Moderate) | 42 (Moderate) | 51 (Moderate) | 26 (Good) | 26 (Good) | 28 (Good) | 25 (Good) | 41 (Moderate) |
| so2 | 14 (Good) | 19 (Good) | 20 (Good) | 20 (Good) | 16 (Good) | 14 (Good) | 19 (Good) | 13 (Good) | 7.9 (Good) | 16 (Good) | 17 (Good) | 22 (Good) | 31 (Good) | 39 (Good) | 11 (Good) | 19 (Good) | 26 (Good) | 19 (Good) | 9.8 (Good) | 11 (Good) | 6.5 (Good) | 7.2 (Good) | 7.8 (Good) |
| co | 535 (Good) | 515 (Good) | 545 (Good) | 1 (Good) | 1 (Good) | 2 (Good) | 2 (Good) | 1 (Good) | 1 (Good) | 1 (Good) | 1 (Good) | 1 (Good) | 1 (Good) | 1 (Good) | 2 (Good) | 2 (Good) | 2 (Good) | 2 (Good) | 1 (Good) | 1 (Good) | 1 (Good) | 30 (Good) | 56 (Good) |
| o3 | 84 (Moderate) | 63 (Good) | 38 (Good) | 34 (Good) | 19 (Good) | 22 (Good) | 36 (Good) | 33 (Good) | 36 (Good) | 27 (Good) | 39 (Good) | 67 (Good) | 72 (Moderate) | 51 (Good) | 22 (Good) | 18 (Good) | 41 (Good) | 50 (Good) | 23 (Good) | 22 (Good) | 90 (Moderate) | 75 (Moderate) | 40 (Good) |
PM2,5 22 (Moderat)
partikulat Matter (PM 2.5) debuCO 219 (Bagus)
karbon monoksida (CO)O3 0.05 (Bagus)
ozon (O3)NO2 7 (Bagus)
nitrogen dioksida (NO2)PM10 36 (Moderat)
partikulat Matter (PM10) debu tersuspensiSO2 7.7 (Bagus)
sulfur dioksida (SO2)Dwarka-Sector 8, Delhi - DPCC
| index | 2022-05-27 |
|---|---|
| pm25 | 23 |
| co | 475 |
| o3 | 25 |
| no2 | 21 |
| pm10 | 32 |
| so2 | 4.4 |
Dwarka-Sector 8, Delhi - DPCC
| index | 2020-05 | 2020-04 | 2020-03 | 2020-02 | 2020-01 | 2019-12 | 2019-11 | 2019-10 | 2019-09 | 2019-08 | 2019-07 | 2019-06 | 2019-05 | 2019-04 | 2019-02 | 2018-12 | 2018-11 | 2018-10 | 2018-09 | 2018-08 | 2018-05 | 2018-04 | 2018-03 |
|---|---|---|---|---|---|---|---|---|---|---|---|---|---|---|---|---|---|---|---|---|---|---|---|
| pm25 | 42 | 55 | 66 | 141 | 174 | 227 | 204 | 123 | 42 | 37 | 45 | 71 | 68 | 84 | 158 | 208 | 206 | 132 | 37 | 29 | 61 | 111 | 215 |
| pm10 | 117 | 120 | 185 | 359 | 353 | 433 | 433 | 370 | 174 | 139 | 247 | 301 | 280 | 373 | 413 | 464 | 398 | 431 | 152 | 135 | 183 | 202 | 267 |
| no2 | 16 | 18 | 43 | 65 | 55 | 55 | 61 | 44 | 27 | 27 | 28 | 36 | 49 | 57 | 44 | 48 | 42 | 51 | 26 | 26 | 28 | 25 | 41 |
| so2 | 14 | 19 | 20 | 20 | 16 | 14 | 19 | 13 | 7.9 | 16 | 17 | 22 | 31 | 39 | 11 | 19 | 26 | 19 | 9.8 | 11 | 6.5 | 7.2 | 7.8 |
| co | 535 | 515 | 545 | 1 | 1 | 2 | 2 | 1 | 1 | 1 | 1 | 1 | 1 | 1 | 2 | 2 | 2 | 2 | 1 | 1 | 1 | 30 | 56 |
| o3 | 84 | 63 | 38 | 34 | 19 | 22 | 36 | 33 | 36 | 27 | 39 | 67 | 72 | 51 | 22 | 18 | 41 | 50 | 23 | 22 | 90 | 75 | 40 |