Polusi udara di Landkreis Oberspreewald-Lausitz: indeks kualitas udara real-time dan siaga asap.
Perkiraan kualitas polusi dan udara untuk Landkreis Oberspreewald-Lausitz. Hari ini Minggu, 21 Juni 2026. Nilai polusi udara berikut telah tercatat untuk Landkreis Oberspreewald-Lausitz:- partikulat Matter (PM 2.5) debu - 14 (Moderat)
- nitrogen dioksida (NO2) - 9 (Bagus)
- partikulat Matter (PM10) debu tersuspensi - 17 (Bagus)
- sulfur dioksida (SO2) - 2 (Bagus)
- ozon (O3) - 46 (Bagus)

Apa kualitas udara di Landkreis Oberspreewald-Lausitz hari ini? Apakah udara tercemar di Landkreis Oberspreewald-Lausitz?. Apakah ada Smog?
Apa tingkat saat PM 2,5 in Landkreis Oberspreewald-Lausitz? (partikulat Matter (PM 2.5) debu)
Hari ini PM 2.5 tingkat:
14 (Moderat)
Sebagai perbandingan, tingkat tertinggi PM 2,5 in Landkreis Oberspreewald-Lausitz dalam 7 hari terakhir adalah: 47 (Rabu, 10 Januari 2024) dan Terendah: 5 (Minggu, 14 Januari 2024).
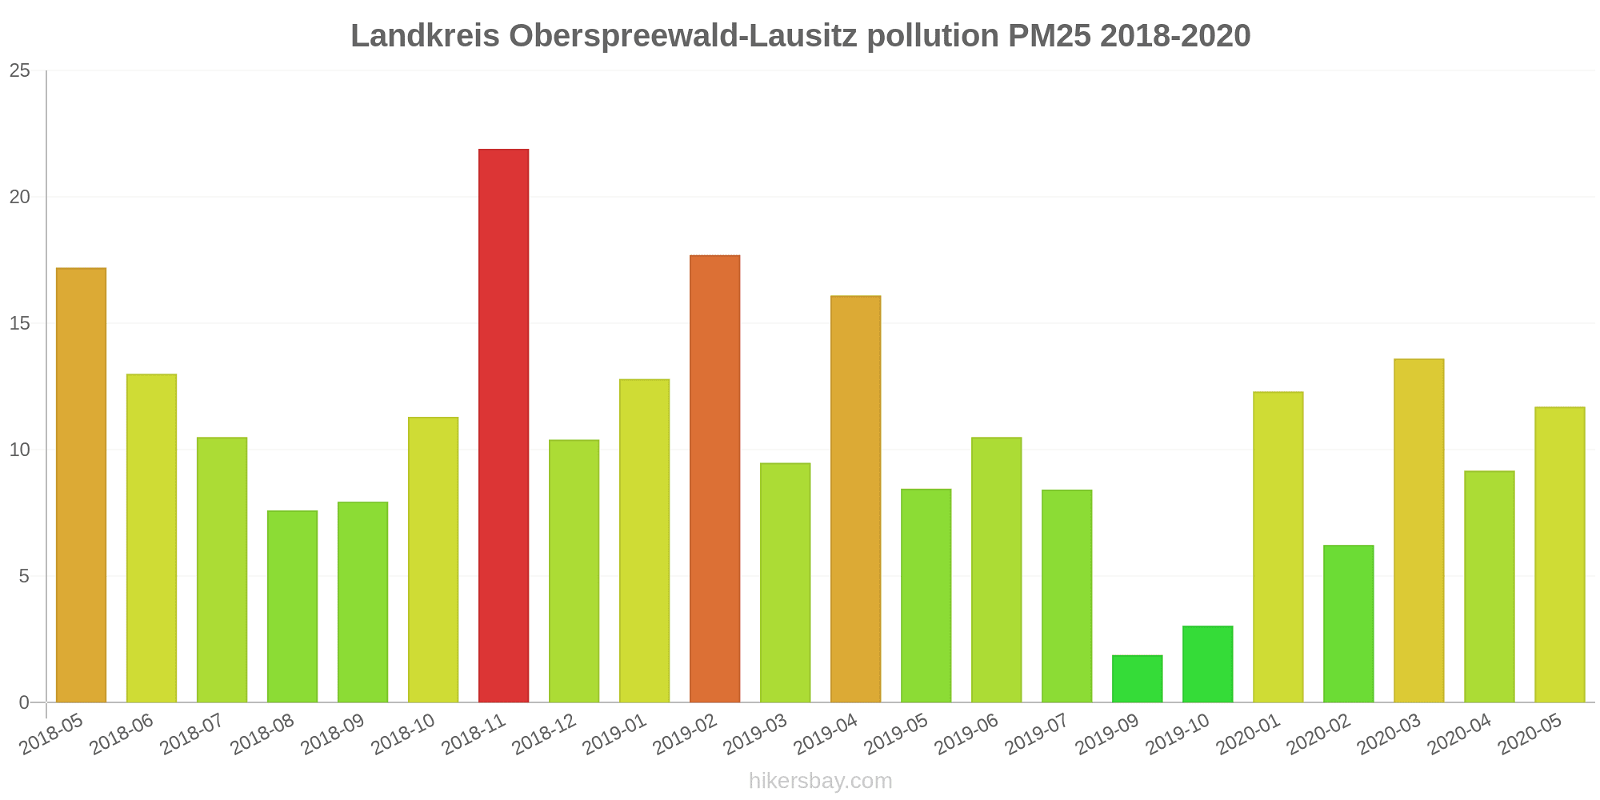
Nilai tertinggi PM 2.5 direkam: 22 (November 2018).
Tingkat terendah dari partikulat Matter PM 2.5 polusi terjadi di bulan: September (1.9).
Seberapa tinggi tingkat NO2? (nitrogen dioksida (NO2))
9 (Bagus)
Apa tingkat PM10 hari ini di Landkreis Oberspreewald-Lausitz? (partikulat Matter (PM10) debu tersuspensi)
Level saat ini dari partikulat Matter PM10 di Landkreis Oberspreewald-Lausitz adalah:
17 (Bagus)
Nilai PM10 tertinggi biasanya terjadi di bulan: 27 (Februari 2018).
Nilai terendah dari partikulat PM10 pencemaran Landkreis Oberspreewald-Lausitz biasanya dicatat di: September (2.6).
Apa tingkat polusi SO2? (sulfur dioksida (SO2))
2 (Bagus)
Bagaimana tingkat O3 hari ini di Landkreis Oberspreewald-Lausitz? (ozon (O3))
46 (Bagus)
Data saat ini Rabu, 17 Januari 2024 09.00
PM2,5 14 (Moderat)
3 (Bagus)
NO2 9 (Bagus)
PM10 17 (Bagus)
SO2 2 (Bagus)
O3 46 (Bagus)
Data tentang polusi udara dari beberapa hari terakhir di Landkreis Oberspreewald-Lausitz
index
2024-01-10
2024-01-11
2024-01-12
2024-01-13
2024-01-14
2024-01-15
2024-01-16
2024-01-17
pm10
56
Unhealthy for Sensitive Groups
28
Moderate
13
Good
11
Good
7
Good
9
Good
7
Good
13
Good
no
3
Good
2
Good
2
Good
2
Good
2
Good
2
Good
2
Good
2
Good
pm25
47
Unhealthy for Sensitive Groups
25
Moderate
10
Good
9
Good
5
Good
7
Good
5
Good
11
Good
no2
16
Good
14
Good
7
Good
5
Good
4
Good
5
Good
5
Good
8
Good
o3
25
Good
26
Good
41
Good
49
Good
53
Good
53
Good
60
Good
44
Good
so2
2
Good
1
Good
1
Good
1
Good
2
Good
1
Good
2
Good
2
Good
data source »
Polusi udara di Landkreis Oberspreewald-Lausitz dari September 2017 ke Mei 2020
index
2020-05
2020-04
2020-03
2020-02
2020-01
2019-10
2019-09
2019-07
2019-06
2019-05
2019-04
2019-03
2019-02
2019-01
2018-12
2018-11
2018-10
2018-09
2018-08
2018-07
2018-06
2018-05
2018-04
2018-03
2018-02
2018-01
2017-12
2017-11
2017-10
2017-09
pm25
12 (Good)
9.2 (Good)
14 (Moderate)
6.2 (Good)
12 (Good)
3 (Good)
1.9 (Good)
8.4 (Good)
11 (Good)
8.5 (Good)
16 (Moderate)
9.5 (Good)
18 (Moderate)
13 (Good)
10 (Good)
22 (Moderate)
11 (Good)
7.9 (Good)
7.6 (Good)
11 (Good)
13 (Moderate)
17 (Moderate)
- (Good)
- (Good)
- (Good)
- (Good)
- (Good)
- (Good)
- (Good)
- (Good)
o3
41 (Good)
54 (Good)
49 (Good)
58 (Good)
40 (Good)
6 (Good)
24 (Good)
60 (Good)
65 (Good)
48 (Good)
62 (Good)
52 (Good)
32 (Good)
43 (Good)
36 (Good)
19 (Good)
26 (Good)
27 (Good)
40 (Good)
44 (Good)
48 (Good)
54 (Good)
61 (Good)
56 (Good)
44 (Good)
40 (Good)
39 (Good)
33 (Good)
39 (Good)
32 (Good)
so2
1.3 (Good)
2.8 (Good)
3.7 (Good)
1.3 (Good)
1.3 (Good)
0.74 (Good)
0.64 (Good)
- (Good)
1.5 (Good)
2.5 (Good)
4.2 (Good)
1.6 (Good)
1.7 (Good)
1.8 (Good)
- (Good)
1.5 (Good)
1.3 (Good)
1.3 (Good)
1.3 (Good)
1.3 (Good)
1.6 (Good)
2.2 (Good)
2.1 (Good)
3.4 (Good)
2.3 (Good)
1.8 (Good)
1.4 (Good)
1.4 (Good)
1.3 (Good)
2.6 (Good)
pm10
17 (Good)
15 (Good)
16 (Good)
6.8 (Good)
14 (Good)
3.9 (Good)
2.6 (Good)
15 (Good)
14 (Good)
10 (Good)
20 (Moderate)
11 (Good)
21 (Moderate)
15 (Good)
12 (Good)
26 (Moderate)
15 (Good)
11 (Good)
12 (Good)
15 (Good)
18 (Good)
21 (Moderate)
19 (Good)
20 (Moderate)
27 (Moderate)
15 (Good)
9.3 (Good)
13 (Good)
14 (Good)
23 (Moderate)
no2
5.3 (Good)
4.1 (Good)
5.6 (Good)
4.6 (Good)
9 (Good)
1.9 (Good)
1.5 (Good)
3.9 (Good)
6.4 (Good)
5.1 (Good)
6.7 (Good)
6.6 (Good)
11 (Good)
8.7 (Good)
8.5 (Good)
12 (Good)
8.1 (Good)
8.5 (Good)
8 (Good)
7.3 (Good)
7.5 (Good)
7.4 (Good)
7.7 (Good)
7.8 (Good)
11 (Good)
9.2 (Good)
10 (Good)
9.7 (Good)
4.6 (Good)
5.8 (Good)
data source »
Spreewald
Rabu, 17 Januari 2024 09.00
PM2,5 14 (Moderat)
partikulat Matter (PM 2.5) debu
3 (Bagus)
index_name_no
NO2 9 (Bagus)
nitrogen dioksida (NO2)
PM10 17 (Bagus)
partikulat Matter (PM10) debu tersuspensi
SO2 2 (Bagus)
sulfur dioksida (SO2)
O3 46 (Bagus)
ozon (O3)
Spreewald
index
2024-01-17
2024-01-16
2024-01-15
2024-01-14
2024-01-13
2024-01-12
2024-01-11
2024-01-10
pm10
13
7.3
8.6
6.8
11
13
28
56
no
2.1
2
2
2
2
2
2.2
2.8
pm25
11
5.2
6.7
5
8.5
10
25
47
no2
7.6
4.5
5
4.5
5.3
6.7
14
16
o3
44
60
53
53
49
41
26
25
so2
2
1.5
1.3
2
1.3
1
1
1.8
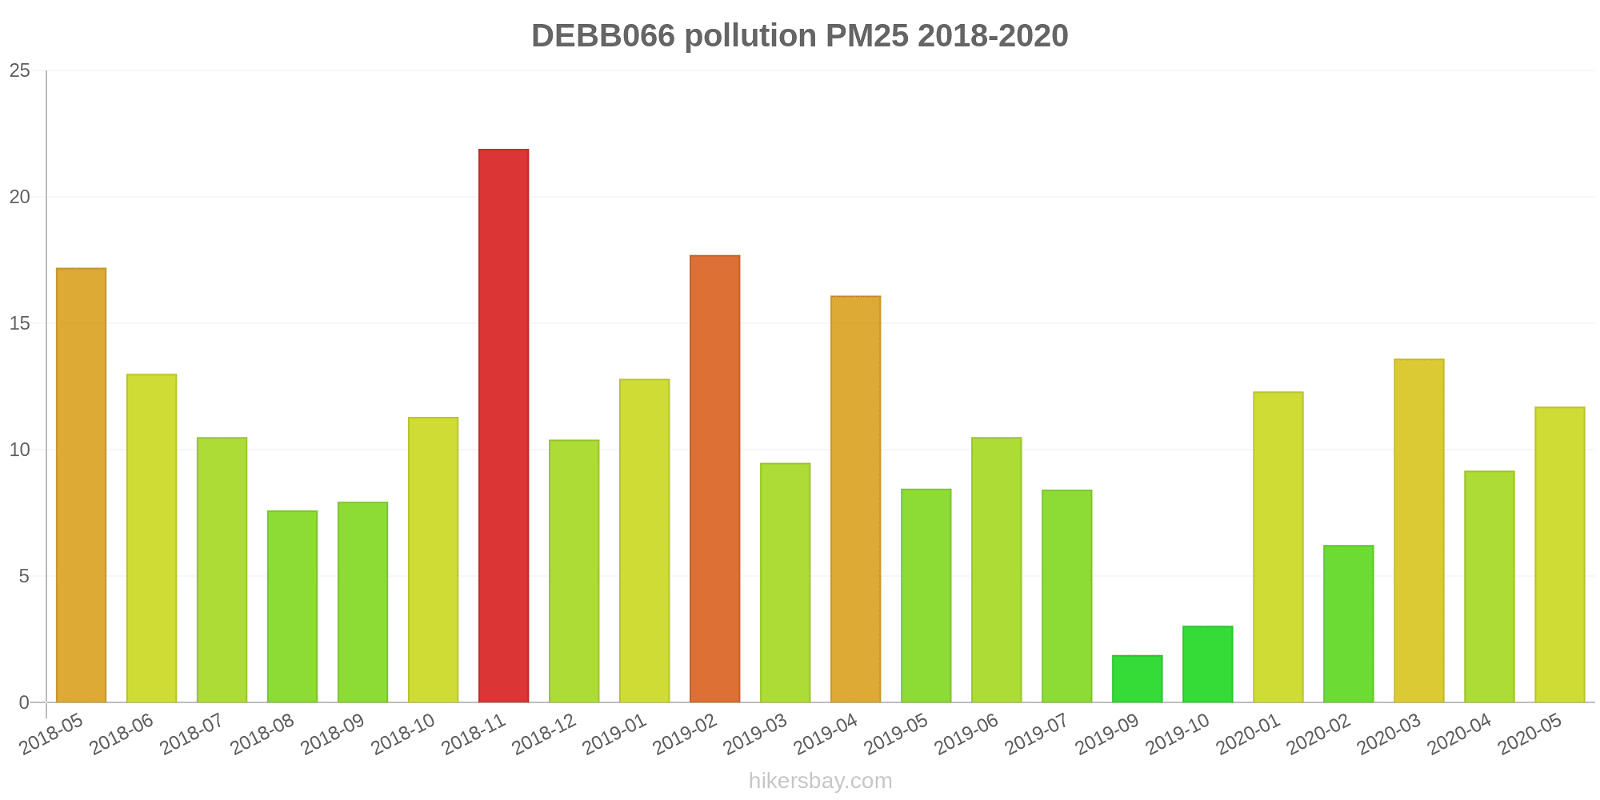
DEBB066
2017-09 2020-05
index
2020-05
2020-04
2020-03
2020-02
2020-01
2019-10
2019-09
2019-07
2019-06
2019-05
2019-04
2019-03
2019-02
2019-01
2018-12
2018-11
2018-10
2018-09
2018-08
2018-07
2018-06
2018-05
2018-04
2018-03
2018-02
2018-01
2017-12
2017-11
2017-10
2017-09
pm10
17
15
16
6.8
14
3.9
2.6
15
14
10
20
11
21
15
12
26
15
11
12
15
18
21
19
20
27
15
9.3
13
14
23
so2
1.3
2.8
3.7
1.3
1.3
0.74
0.64
-
1.5
2.5
4.2
1.6
1.7
1.8
-
1.5
1.3
1.3
1.3
1.3
1.6
2.2
2.1
3.4
2.3
1.8
1.4
1.4
1.3
2.6
no2
5.3
4.1
5.6
4.6
9
1.9
1.5
3.9
6.4
5.1
6.7
6.6
11
8.7
8.5
12
8.1
8.5
8
7.3
7.5
7.4
7.7
7.8
11
9.2
10
9.7
4.6
5.8
o3
41
54
49
58
40
6
24
60
65
48
62
52
32
43
36
19
26
27
40
44
48
54
61
56
44
40
39
33
39
32
pm25
12
9.2
14
6.2
12
3
1.9
8.4
11
8.5
16
9.5
18
13
10
22
11
7.9
7.6
11
13
17
-
-
-
-
-
-
-
-
* Pollution data source:
https://openaq.org
(EEA Germany)
The data is licensed under CC-By 4.0
PM2,5 14 (Moderat)
3 (Bagus)
NO2 9 (Bagus)
PM10 17 (Bagus)
SO2 2 (Bagus)
O3 46 (Bagus)
Data tentang polusi udara dari beberapa hari terakhir di Landkreis Oberspreewald-Lausitz
| index | 2024-01-10 | 2024-01-11 | 2024-01-12 | 2024-01-13 | 2024-01-14 | 2024-01-15 | 2024-01-16 | 2024-01-17 |
|---|---|---|---|---|---|---|---|---|
| pm10 | 56 Unhealthy for Sensitive Groups |
28 Moderate |
13 Good |
11 Good |
7 Good |
9 Good |
7 Good |
13 Good |
| no | 3 Good |
2 Good |
2 Good |
2 Good |
2 Good |
2 Good |
2 Good |
2 Good |
| pm25 | 47 Unhealthy for Sensitive Groups |
25 Moderate |
10 Good |
9 Good |
5 Good |
7 Good |
5 Good |
11 Good |
| no2 | 16 Good |
14 Good |
7 Good |
5 Good |
4 Good |
5 Good |
5 Good |
8 Good |
| o3 | 25 Good |
26 Good |
41 Good |
49 Good |
53 Good |
53 Good |
60 Good |
44 Good |
| so2 | 2 Good |
1 Good |
1 Good |
1 Good |
2 Good |
1 Good |
2 Good |
2 Good |

| index | 2020-05 | 2020-04 | 2020-03 | 2020-02 | 2020-01 | 2019-10 | 2019-09 | 2019-07 | 2019-06 | 2019-05 | 2019-04 | 2019-03 | 2019-02 | 2019-01 | 2018-12 | 2018-11 | 2018-10 | 2018-09 | 2018-08 | 2018-07 | 2018-06 | 2018-05 | 2018-04 | 2018-03 | 2018-02 | 2018-01 | 2017-12 | 2017-11 | 2017-10 | 2017-09 |
|---|---|---|---|---|---|---|---|---|---|---|---|---|---|---|---|---|---|---|---|---|---|---|---|---|---|---|---|---|---|---|
| pm25 | 12 (Good) | 9.2 (Good) | 14 (Moderate) | 6.2 (Good) | 12 (Good) | 3 (Good) | 1.9 (Good) | 8.4 (Good) | 11 (Good) | 8.5 (Good) | 16 (Moderate) | 9.5 (Good) | 18 (Moderate) | 13 (Good) | 10 (Good) | 22 (Moderate) | 11 (Good) | 7.9 (Good) | 7.6 (Good) | 11 (Good) | 13 (Moderate) | 17 (Moderate) | - (Good) | - (Good) | - (Good) | - (Good) | - (Good) | - (Good) | - (Good) | - (Good) |
| o3 | 41 (Good) | 54 (Good) | 49 (Good) | 58 (Good) | 40 (Good) | 6 (Good) | 24 (Good) | 60 (Good) | 65 (Good) | 48 (Good) | 62 (Good) | 52 (Good) | 32 (Good) | 43 (Good) | 36 (Good) | 19 (Good) | 26 (Good) | 27 (Good) | 40 (Good) | 44 (Good) | 48 (Good) | 54 (Good) | 61 (Good) | 56 (Good) | 44 (Good) | 40 (Good) | 39 (Good) | 33 (Good) | 39 (Good) | 32 (Good) |
| so2 | 1.3 (Good) | 2.8 (Good) | 3.7 (Good) | 1.3 (Good) | 1.3 (Good) | 0.74 (Good) | 0.64 (Good) | - (Good) | 1.5 (Good) | 2.5 (Good) | 4.2 (Good) | 1.6 (Good) | 1.7 (Good) | 1.8 (Good) | - (Good) | 1.5 (Good) | 1.3 (Good) | 1.3 (Good) | 1.3 (Good) | 1.3 (Good) | 1.6 (Good) | 2.2 (Good) | 2.1 (Good) | 3.4 (Good) | 2.3 (Good) | 1.8 (Good) | 1.4 (Good) | 1.4 (Good) | 1.3 (Good) | 2.6 (Good) |
| pm10 | 17 (Good) | 15 (Good) | 16 (Good) | 6.8 (Good) | 14 (Good) | 3.9 (Good) | 2.6 (Good) | 15 (Good) | 14 (Good) | 10 (Good) | 20 (Moderate) | 11 (Good) | 21 (Moderate) | 15 (Good) | 12 (Good) | 26 (Moderate) | 15 (Good) | 11 (Good) | 12 (Good) | 15 (Good) | 18 (Good) | 21 (Moderate) | 19 (Good) | 20 (Moderate) | 27 (Moderate) | 15 (Good) | 9.3 (Good) | 13 (Good) | 14 (Good) | 23 (Moderate) |
| no2 | 5.3 (Good) | 4.1 (Good) | 5.6 (Good) | 4.6 (Good) | 9 (Good) | 1.9 (Good) | 1.5 (Good) | 3.9 (Good) | 6.4 (Good) | 5.1 (Good) | 6.7 (Good) | 6.6 (Good) | 11 (Good) | 8.7 (Good) | 8.5 (Good) | 12 (Good) | 8.1 (Good) | 8.5 (Good) | 8 (Good) | 7.3 (Good) | 7.5 (Good) | 7.4 (Good) | 7.7 (Good) | 7.8 (Good) | 11 (Good) | 9.2 (Good) | 10 (Good) | 9.7 (Good) | 4.6 (Good) | 5.8 (Good) |
PM2,5 14 (Moderat)
partikulat Matter (PM 2.5) debu3 (Bagus)
index_name_noNO2 9 (Bagus)
nitrogen dioksida (NO2)PM10 17 (Bagus)
partikulat Matter (PM10) debu tersuspensiSO2 2 (Bagus)
sulfur dioksida (SO2)O3 46 (Bagus)
ozon (O3)Spreewald
| index | 2024-01-17 | 2024-01-16 | 2024-01-15 | 2024-01-14 | 2024-01-13 | 2024-01-12 | 2024-01-11 | 2024-01-10 |
|---|---|---|---|---|---|---|---|---|
| pm10 | 13 | 7.3 | 8.6 | 6.8 | 11 | 13 | 28 | 56 |
| no | 2.1 | 2 | 2 | 2 | 2 | 2 | 2.2 | 2.8 |
| pm25 | 11 | 5.2 | 6.7 | 5 | 8.5 | 10 | 25 | 47 |
| no2 | 7.6 | 4.5 | 5 | 4.5 | 5.3 | 6.7 | 14 | 16 |
| o3 | 44 | 60 | 53 | 53 | 49 | 41 | 26 | 25 |
| so2 | 2 | 1.5 | 1.3 | 2 | 1.3 | 1 | 1 | 1.8 |
DEBB066

| index | 2020-05 | 2020-04 | 2020-03 | 2020-02 | 2020-01 | 2019-10 | 2019-09 | 2019-07 | 2019-06 | 2019-05 | 2019-04 | 2019-03 | 2019-02 | 2019-01 | 2018-12 | 2018-11 | 2018-10 | 2018-09 | 2018-08 | 2018-07 | 2018-06 | 2018-05 | 2018-04 | 2018-03 | 2018-02 | 2018-01 | 2017-12 | 2017-11 | 2017-10 | 2017-09 |
|---|---|---|---|---|---|---|---|---|---|---|---|---|---|---|---|---|---|---|---|---|---|---|---|---|---|---|---|---|---|---|
| pm10 | 17 | 15 | 16 | 6.8 | 14 | 3.9 | 2.6 | 15 | 14 | 10 | 20 | 11 | 21 | 15 | 12 | 26 | 15 | 11 | 12 | 15 | 18 | 21 | 19 | 20 | 27 | 15 | 9.3 | 13 | 14 | 23 |
| so2 | 1.3 | 2.8 | 3.7 | 1.3 | 1.3 | 0.74 | 0.64 | - | 1.5 | 2.5 | 4.2 | 1.6 | 1.7 | 1.8 | - | 1.5 | 1.3 | 1.3 | 1.3 | 1.3 | 1.6 | 2.2 | 2.1 | 3.4 | 2.3 | 1.8 | 1.4 | 1.4 | 1.3 | 2.6 |
| no2 | 5.3 | 4.1 | 5.6 | 4.6 | 9 | 1.9 | 1.5 | 3.9 | 6.4 | 5.1 | 6.7 | 6.6 | 11 | 8.7 | 8.5 | 12 | 8.1 | 8.5 | 8 | 7.3 | 7.5 | 7.4 | 7.7 | 7.8 | 11 | 9.2 | 10 | 9.7 | 4.6 | 5.8 |
| o3 | 41 | 54 | 49 | 58 | 40 | 6 | 24 | 60 | 65 | 48 | 62 | 52 | 32 | 43 | 36 | 19 | 26 | 27 | 40 | 44 | 48 | 54 | 61 | 56 | 44 | 40 | 39 | 33 | 39 | 32 |
| pm25 | 12 | 9.2 | 14 | 6.2 | 12 | 3 | 1.9 | 8.4 | 11 | 8.5 | 16 | 9.5 | 18 | 13 | 10 | 22 | 11 | 7.9 | 7.6 | 11 | 13 | 17 | - | - | - | - | - | - | - | - |