Polusi udara di Kreisfreie Stadt Koblenz: indeks kualitas udara real-time dan siaga asap.
Perkiraan kualitas polusi dan udara untuk Kreisfreie Stadt Koblenz. Hari ini Minggu, 21 Juni 2026. Nilai polusi udara berikut telah tercatat untuk Kreisfreie Stadt Koblenz:- partikulat Matter (PM 2.5) debu - 18 (Moderat)
- nitrogen dioksida (NO2) - 47 (Moderat)
- ozon (O3) - 6 (Bagus)
- karbon monoksida (CO) - 438 (Bagus)
- sulfur dioksida (SO2) - 1 (Bagus)
- partikulat Matter (PM10) debu tersuspensi - 25 (Moderat)

Apa kualitas udara di Kreisfreie Stadt Koblenz hari ini? Apakah udara tercemar di Kreisfreie Stadt Koblenz?. Apakah ada Smog?
Apa tingkat saat PM 2,5 in Kreisfreie Stadt Koblenz? (partikulat Matter (PM 2.5) debu)
Hari ini PM 2.5 tingkat:
18 (Moderat)
Sebagai perbandingan, tingkat tertinggi PM 2,5 in Kreisfreie Stadt Koblenz dalam 7 hari terakhir adalah: 44 (Kamis, 11 Januari 2024) dan Terendah: 8 (Selasa, 16 Januari 2024).
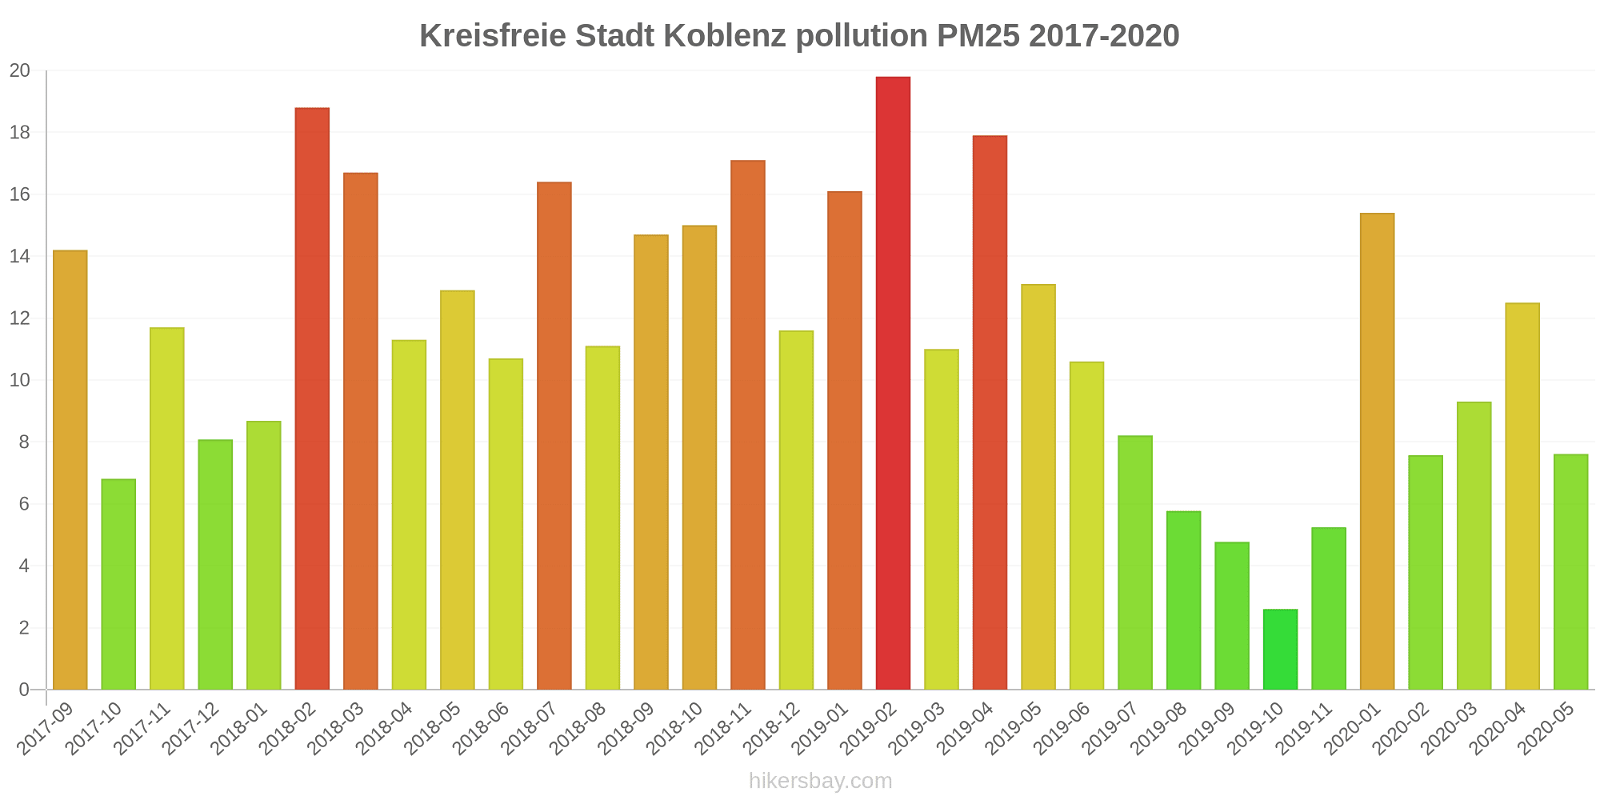
Nilai tertinggi PM 2.5 direkam: 20 (Februari 2019).
Tingkat terendah dari partikulat Matter PM 2.5 polusi terjadi di bulan: Oktober (2.6).
Seberapa tinggi tingkat NO2? (nitrogen dioksida (NO2))
47 (Moderat)
Bagaimana tingkat O3 hari ini di Kreisfreie Stadt Koblenz? (ozon (O3))
6 (Bagus)
Seberapa tinggi tingkat CO? (karbon monoksida (CO))
438 (Bagus)
Apa tingkat polusi SO2? (sulfur dioksida (SO2))
1 (Bagus)
Apa tingkat PM10 hari ini di Kreisfreie Stadt Koblenz? (partikulat Matter (PM10) debu tersuspensi)
Level saat ini dari partikulat Matter PM10 di Kreisfreie Stadt Koblenz adalah:
25 (Moderat)
Nilai PM10 tertinggi biasanya terjadi di bulan: 28 (Februari 2019).
Nilai terendah dari partikulat PM10 pencemaran Kreisfreie Stadt Koblenz biasanya dicatat di: Oktober (4.6).
Data saat ini Rabu, 17 Januari 2024 09.00
PM2,5 18 (Moderat)
NO2 47 (Moderat)
36 (Bagus)
O3 6 (Bagus)
CO 438 (Bagus)
SO2 1 (Bagus)
PM10 25 (Moderat)
Data tentang polusi udara dari beberapa hari terakhir di Kreisfreie Stadt Koblenz
index
2024-01-10
2024-01-11
2024-01-12
2024-01-13
2024-01-14
2024-01-15
2024-01-16
2024-01-17
o3
19
Good
3
Good
2
Good
25
Good
39
Good
28
Good
37
Good
13
Good
no
22
Good
51
Good
48
Good
8
Good
3
Good
8
Good
12
Good
16
Good
co
444
Good
704
Good
660
Good
357
Good
251
Good
336
Good
298
Good
371
Good
no2
32
Good
40
Moderate
46
Moderate
24
Good
10
Good
20
Good
25
Good
35
Good
so2
1
Good
2
Good
2
Good
1
Good
1
Good
1
Good
1
Good
1
Good
pm25
30
Moderate
44
Unhealthy for Sensitive Groups
42
Unhealthy for Sensitive Groups
18
Moderate
13
Moderate
13
Moderate
8
Good
15
Moderate
pm10
35
Moderate
51
Unhealthy for Sensitive Groups
51
Unhealthy for Sensitive Groups
20
Moderate
14
Good
14
Good
13
Good
24
Moderate
data source »
Polusi udara di Kreisfreie Stadt Koblenz dari September 2017 ke Mei 2020
index
2020-05
2020-04
2020-03
2020-02
2020-01
2019-11
2019-10
2019-09
2019-08
2019-07
2019-06
2019-05
2019-04
2019-03
2019-02
2019-01
2018-12
2018-11
2018-10
2018-09
2018-08
2018-07
2018-06
2018-05
2018-04
2018-03
2018-02
2018-01
2017-12
2017-11
2017-10
2017-09
pm25
7.6 (Good)
13 (Good)
9.3 (Good)
7.6 (Good)
15 (Moderate)
5.2 (Good)
2.6 (Good)
4.8 (Good)
5.8 (Good)
8.2 (Good)
11 (Good)
13 (Moderate)
18 (Moderate)
11 (Good)
20 (Moderate)
16 (Moderate)
12 (Good)
17 (Moderate)
15 (Moderate)
15 (Moderate)
11 (Good)
16 (Moderate)
11 (Good)
13 (Good)
11 (Good)
17 (Moderate)
19 (Moderate)
8.7 (Good)
8.1 (Good)
12 (Good)
6.8 (Good)
14 (Moderate)
o3
38 (Good)
41 (Good)
43 (Good)
50 (Good)
25 (Good)
3.6 (Good)
5.5 (Good)
17 (Good)
16 (Good)
27 (Good)
37 (Good)
35 (Good)
37 (Good)
41 (Good)
8.5 (Good)
31 (Good)
24 (Good)
14 (Good)
12 (Good)
17 (Good)
31 (Good)
40 (Good)
33 (Good)
33 (Good)
39 (Good)
34 (Good)
32 (Good)
31 (Good)
26 (Good)
18 (Good)
21 (Good)
12 (Good)
co
115 (Good)
152 (Good)
189 (Good)
187 (Good)
295 (Good)
108 (Good)
78 (Good)
55 (Good)
64 (Good)
68 (Good)
122 (Good)
151 (Good)
194 (Good)
146 (Good)
212 (Good)
188 (Good)
199 (Good)
185 (Good)
192 (Good)
235 (Good)
178 (Good)
189 (Good)
132 (Good)
209 (Good)
201 (Good)
255 (Good)
270 (Good)
221 (Good)
185 (Good)
172 (Good)
123 (Good)
201 (Good)
so2
1 (Good)
1.2 (Good)
1.1 (Good)
1.1 (Good)
1 (Good)
0.4 (Good)
0.34 (Good)
0.61 (Good)
0.59 (Good)
0.74 (Good)
1.1 (Good)
1.1 (Good)
1.1 (Good)
1.1 (Good)
1.7 (Good)
1 (Good)
1 (Good)
1.1 (Good)
1.1 (Good)
1.2 (Good)
1.4 (Good)
1.5 (Good)
1.2 (Good)
1.4 (Good)
1.5 (Good)
1.6 (Good)
1.6 (Good)
1.2 (Good)
1.2 (Good)
1.2 (Good)
1.4 (Good)
1.3 (Good)
no2
26 (Good)
32 (Good)
25 (Good)
17 (Good)
29 (Good)
12 (Good)
9.4 (Good)
9.7 (Good)
13 (Good)
14 (Good)
27 (Good)
26 (Good)
33 (Good)
24 (Good)
38 (Good)
25 (Good)
23 (Good)
28 (Good)
33 (Good)
39 (Good)
32 (Good)
34 (Good)
28 (Good)
35 (Good)
38 (Good)
40 (Moderate)
35 (Good)
32 (Good)
32 (Good)
34 (Good)
31 (Good)
42 (Moderate)
pm10
9.7 (Good)
16 (Good)
16 (Good)
15 (Good)
22 (Moderate)
7.5 (Good)
4.6 (Good)
6.8 (Good)
8.7 (Good)
13 (Good)
19 (Good)
20 (Good)
23 (Moderate)
17 (Good)
28 (Moderate)
21 (Moderate)
16 (Good)
23 (Moderate)
24 (Moderate)
21 (Moderate)
18 (Good)
22 (Moderate)
22 (Moderate)
22 (Moderate)
18 (Good)
19 (Good)
25 (Moderate)
14 (Good)
12 (Good)
19 (Good)
16 (Good)
25 (Moderate)
data source »
Kualitas hidup di Kreisfreie Stadt Koblenz
Hijau dan taman di kota
Kreisfreie Stadt Koblenz
50%
Luksemburg: 83%
Belanda: 82%
Ceko: 77%
Belgia: 64%
Liechtenstein: 88%
partikulat Matter PM 2.5
Kreisfreie Stadt Koblenz
12 (Good)
Kenikmatan menghabiskan waktu di kota
Kreisfreie Stadt Koblenz
75%
Luksemburg: 85%
Belanda: 88%
Ceko: 77%
Belgia: 64%
Liechtenstein: 94%
partikulat Matter PM10
Kreisfreie Stadt Koblenz
18 (Good)
Polusi udara
Kreisfreie Stadt Koblenz
32%
Luksemburg: 19%
Belanda: 21%
Ceko: 35%
Belgia: 45%
Liechtenstein: 6,3%
Pembuangan sampah
Kreisfreie Stadt Koblenz
67%
Luksemburg: 84%
Belanda: 79%
Ceko: 74%
Belgia: 54%
Liechtenstein: 100%
Ketersediaan dan kualitas air minum
Kreisfreie Stadt Koblenz
67%
Luksemburg: 83%
Belanda: 92%
Ceko: 84%
Belgia: 70%
Liechtenstein: 100%
Kebersihan dan kerasnya
Kreisfreie Stadt Koblenz
33%
Luksemburg: 82%
Belanda: 77%
Ceko: 65%
Belgia: 46%
Liechtenstein: 94%
Kebisingan dan polusi cahaya
Kreisfreie Stadt Koblenz
58%
Luksemburg: 29%
Belanda: 31%
Ceko: 44%
Belgia: 54%
Liechtenstein: 19%
Polusi air
Kreisfreie Stadt Koblenz
42%
Luksemburg: 19%
Belanda: 17%
Ceko: 28%
Belgia: 42%
Liechtenstein: 0%
Source: Numbeo
Koblenz-Friedrich-Ebert-Ring
Rabu, 17 Januari 2024 09.00
PM2,5 18 (Moderat)
partikulat Matter (PM 2.5) debu
NO2 41 (Moderat)
nitrogen dioksida (NO2)
25 (Bagus)
index_name_no
O3 5.9 (Bagus)
ozon (O3)
CO 438 (Bagus)
karbon monoksida (CO)
SO2 1 (Bagus)
sulfur dioksida (SO2)
Koblenz-Hohenfelder Straße
Rabu, 17 Januari 2024 09.00
47 (Bagus)
index_name_no
PM10 25 (Moderat)
partikulat Matter (PM10) debu tersuspensi
NO2 52 (Moderat)
nitrogen dioksida (NO2)
Koblenz-Friedrich-Ebert-Ring
index
2024-01-17
2024-01-16
2024-01-15
2024-01-14
2024-01-13
2024-01-12
2024-01-11
2024-01-10
o3
13
37
28
39
25
1.5
3.2
19
no
12
11
10
2.8
7.6
43
51
15
co
371
298
336
251
357
660
704
444
no2
31
24
21
9.8
23
43
38
26
so2
1
1
1
1
1
1.5
1.9
1
pm25
15
8.4
13
13
18
42
44
30
Koblenz-Hohenfelder Straße
index
2024-01-17
2024-01-16
2024-01-15
2024-01-14
2024-01-13
2024-01-12
2024-01-11
2024-01-10
pm10
24
13
14
14
20
51
51
35
no2
40
26
19
9.7
25
49
43
37
no
20
13
5.8
2.8
8.2
52
50
28
DERP024
2017-09 2020-05

index
2020-05
2020-04
2020-03
2020-02
2020-01
2019-11
2019-10
2019-09
2019-08
2019-07
2019-06
2019-05
2019-04
2019-03
2019-02
2019-01
2018-12
2018-11
2018-10
2018-09
2018-08
2018-07
2018-06
2018-05
2018-04
2018-03
2018-02
2018-01
2017-12
2017-11
2017-10
2017-09
pm25
7.6
13
9.3
7.6
15
5.2
2.6
4.8
5.8
8.2
11
13
18
11
20
16
12
17
15
15
11
16
11
13
11
17
19
8.7
8.1
12
6.8
14
co
115
152
189
187
295
108
78
55
64
68
122
151
194
146
212
188
199
185
192
235
178
189
132
209
201
255
270
221
185
172
123
201
so2
1
1.2
1.1
1.1
1
0.4
0.34
0.61
0.59
0.74
1.1
1.1
1.1
1.1
1.7
1
1
1.1
1.1
1.2
1.4
1.5
1.2
1.4
1.5
1.6
1.6
1.2
1.2
1.2
1.4
1.3
no2
26
33
25
17
30
11
9.4
10
14
14
27
26
30
22
35
25
22
26
32
37
30
30
27
34
35
36
32
29
30
33
30
36
o3
38
41
43
50
25
3.6
5.5
17
16
27
37
35
37
41
8.5
31
24
14
12
17
31
40
33
33
39
34
32
31
26
18
21
12
DERP045
index
2020-05
2020-04
2020-03
2020-02
2020-01
2019-11
2019-10
2019-09
2019-08
2019-07
2019-06
2019-05
2019-04
2019-03
2019-02
2019-01
2018-12
2018-11
2018-10
2018-09
2018-08
2018-07
2018-06
2018-05
2018-04
2018-03
2018-02
2018-01
2017-12
2017-11
2017-10
2017-09
pm10
9.7
16
16
15
22
7.5
4.6
6.8
8.7
13
19
20
23
17
28
21
16
23
24
21
18
22
22
22
18
19
25
14
12
19
16
25
no2
26
31
25
17
29
12
9.3
9.4
13
13
26
26
36
26
40
26
25
29
35
41
34
38
29
36
41
45
37
34
34
35
33
47
* Pollution data source:
https://openaq.org
(EEA Germany)
The data is licensed under CC-By 4.0
PM2,5 18 (Moderat)
NO2 47 (Moderat)
36 (Bagus)
O3 6 (Bagus)
CO 438 (Bagus)
SO2 1 (Bagus)
PM10 25 (Moderat)
Data tentang polusi udara dari beberapa hari terakhir di Kreisfreie Stadt Koblenz
| index | 2024-01-10 | 2024-01-11 | 2024-01-12 | 2024-01-13 | 2024-01-14 | 2024-01-15 | 2024-01-16 | 2024-01-17 |
|---|---|---|---|---|---|---|---|---|
| o3 | 19 Good |
3 Good |
2 Good |
25 Good |
39 Good |
28 Good |
37 Good |
13 Good |
| no | 22 Good |
51 Good |
48 Good |
8 Good |
3 Good |
8 Good |
12 Good |
16 Good |
| co | 444 Good |
704 Good |
660 Good |
357 Good |
251 Good |
336 Good |
298 Good |
371 Good |
| no2 | 32 Good |
40 Moderate |
46 Moderate |
24 Good |
10 Good |
20 Good |
25 Good |
35 Good |
| so2 | 1 Good |
2 Good |
2 Good |
1 Good |
1 Good |
1 Good |
1 Good |
1 Good |
| pm25 | 30 Moderate |
44 Unhealthy for Sensitive Groups |
42 Unhealthy for Sensitive Groups |
18 Moderate |
13 Moderate |
13 Moderate |
8 Good |
15 Moderate |
| pm10 | 35 Moderate |
51 Unhealthy for Sensitive Groups |
51 Unhealthy for Sensitive Groups |
20 Moderate |
14 Good |
14 Good |
13 Good |
24 Moderate |

| index | 2020-05 | 2020-04 | 2020-03 | 2020-02 | 2020-01 | 2019-11 | 2019-10 | 2019-09 | 2019-08 | 2019-07 | 2019-06 | 2019-05 | 2019-04 | 2019-03 | 2019-02 | 2019-01 | 2018-12 | 2018-11 | 2018-10 | 2018-09 | 2018-08 | 2018-07 | 2018-06 | 2018-05 | 2018-04 | 2018-03 | 2018-02 | 2018-01 | 2017-12 | 2017-11 | 2017-10 | 2017-09 |
|---|---|---|---|---|---|---|---|---|---|---|---|---|---|---|---|---|---|---|---|---|---|---|---|---|---|---|---|---|---|---|---|---|
| pm25 | 7.6 (Good) | 13 (Good) | 9.3 (Good) | 7.6 (Good) | 15 (Moderate) | 5.2 (Good) | 2.6 (Good) | 4.8 (Good) | 5.8 (Good) | 8.2 (Good) | 11 (Good) | 13 (Moderate) | 18 (Moderate) | 11 (Good) | 20 (Moderate) | 16 (Moderate) | 12 (Good) | 17 (Moderate) | 15 (Moderate) | 15 (Moderate) | 11 (Good) | 16 (Moderate) | 11 (Good) | 13 (Good) | 11 (Good) | 17 (Moderate) | 19 (Moderate) | 8.7 (Good) | 8.1 (Good) | 12 (Good) | 6.8 (Good) | 14 (Moderate) |
| o3 | 38 (Good) | 41 (Good) | 43 (Good) | 50 (Good) | 25 (Good) | 3.6 (Good) | 5.5 (Good) | 17 (Good) | 16 (Good) | 27 (Good) | 37 (Good) | 35 (Good) | 37 (Good) | 41 (Good) | 8.5 (Good) | 31 (Good) | 24 (Good) | 14 (Good) | 12 (Good) | 17 (Good) | 31 (Good) | 40 (Good) | 33 (Good) | 33 (Good) | 39 (Good) | 34 (Good) | 32 (Good) | 31 (Good) | 26 (Good) | 18 (Good) | 21 (Good) | 12 (Good) |
| co | 115 (Good) | 152 (Good) | 189 (Good) | 187 (Good) | 295 (Good) | 108 (Good) | 78 (Good) | 55 (Good) | 64 (Good) | 68 (Good) | 122 (Good) | 151 (Good) | 194 (Good) | 146 (Good) | 212 (Good) | 188 (Good) | 199 (Good) | 185 (Good) | 192 (Good) | 235 (Good) | 178 (Good) | 189 (Good) | 132 (Good) | 209 (Good) | 201 (Good) | 255 (Good) | 270 (Good) | 221 (Good) | 185 (Good) | 172 (Good) | 123 (Good) | 201 (Good) |
| so2 | 1 (Good) | 1.2 (Good) | 1.1 (Good) | 1.1 (Good) | 1 (Good) | 0.4 (Good) | 0.34 (Good) | 0.61 (Good) | 0.59 (Good) | 0.74 (Good) | 1.1 (Good) | 1.1 (Good) | 1.1 (Good) | 1.1 (Good) | 1.7 (Good) | 1 (Good) | 1 (Good) | 1.1 (Good) | 1.1 (Good) | 1.2 (Good) | 1.4 (Good) | 1.5 (Good) | 1.2 (Good) | 1.4 (Good) | 1.5 (Good) | 1.6 (Good) | 1.6 (Good) | 1.2 (Good) | 1.2 (Good) | 1.2 (Good) | 1.4 (Good) | 1.3 (Good) |
| no2 | 26 (Good) | 32 (Good) | 25 (Good) | 17 (Good) | 29 (Good) | 12 (Good) | 9.4 (Good) | 9.7 (Good) | 13 (Good) | 14 (Good) | 27 (Good) | 26 (Good) | 33 (Good) | 24 (Good) | 38 (Good) | 25 (Good) | 23 (Good) | 28 (Good) | 33 (Good) | 39 (Good) | 32 (Good) | 34 (Good) | 28 (Good) | 35 (Good) | 38 (Good) | 40 (Moderate) | 35 (Good) | 32 (Good) | 32 (Good) | 34 (Good) | 31 (Good) | 42 (Moderate) |
| pm10 | 9.7 (Good) | 16 (Good) | 16 (Good) | 15 (Good) | 22 (Moderate) | 7.5 (Good) | 4.6 (Good) | 6.8 (Good) | 8.7 (Good) | 13 (Good) | 19 (Good) | 20 (Good) | 23 (Moderate) | 17 (Good) | 28 (Moderate) | 21 (Moderate) | 16 (Good) | 23 (Moderate) | 24 (Moderate) | 21 (Moderate) | 18 (Good) | 22 (Moderate) | 22 (Moderate) | 22 (Moderate) | 18 (Good) | 19 (Good) | 25 (Moderate) | 14 (Good) | 12 (Good) | 19 (Good) | 16 (Good) | 25 (Moderate) |
Hijau dan taman di kota
Kreisfreie Stadt Koblenz 50%
Luksemburg: 83% Belanda: 82% Ceko: 77% Belgia: 64% Liechtenstein: 88%partikulat Matter PM 2.5
Kreisfreie Stadt Koblenz 12 (Good)
Kenikmatan menghabiskan waktu di kota
Kreisfreie Stadt Koblenz 75%
Luksemburg: 85% Belanda: 88% Ceko: 77% Belgia: 64% Liechtenstein: 94%partikulat Matter PM10
Kreisfreie Stadt Koblenz 18 (Good)
Polusi udara
Kreisfreie Stadt Koblenz 32%
Luksemburg: 19% Belanda: 21% Ceko: 35% Belgia: 45% Liechtenstein: 6,3%Pembuangan sampah
Kreisfreie Stadt Koblenz 67%
Luksemburg: 84% Belanda: 79% Ceko: 74% Belgia: 54% Liechtenstein: 100%Ketersediaan dan kualitas air minum
Kreisfreie Stadt Koblenz 67%
Luksemburg: 83% Belanda: 92% Ceko: 84% Belgia: 70% Liechtenstein: 100%Kebersihan dan kerasnya
Kreisfreie Stadt Koblenz 33%
Luksemburg: 82% Belanda: 77% Ceko: 65% Belgia: 46% Liechtenstein: 94%Kebisingan dan polusi cahaya
Kreisfreie Stadt Koblenz 58%
Luksemburg: 29% Belanda: 31% Ceko: 44% Belgia: 54% Liechtenstein: 19%Polusi air
Kreisfreie Stadt Koblenz 42%
Luksemburg: 19% Belanda: 17% Ceko: 28% Belgia: 42% Liechtenstein: 0%PM2,5 18 (Moderat)
partikulat Matter (PM 2.5) debuNO2 41 (Moderat)
nitrogen dioksida (NO2)25 (Bagus)
index_name_noO3 5.9 (Bagus)
ozon (O3)CO 438 (Bagus)
karbon monoksida (CO)SO2 1 (Bagus)
sulfur dioksida (SO2)47 (Bagus)
index_name_noPM10 25 (Moderat)
partikulat Matter (PM10) debu tersuspensiNO2 52 (Moderat)
nitrogen dioksida (NO2)Koblenz-Friedrich-Ebert-Ring
| index | 2024-01-17 | 2024-01-16 | 2024-01-15 | 2024-01-14 | 2024-01-13 | 2024-01-12 | 2024-01-11 | 2024-01-10 |
|---|---|---|---|---|---|---|---|---|
| o3 | 13 | 37 | 28 | 39 | 25 | 1.5 | 3.2 | 19 |
| no | 12 | 11 | 10 | 2.8 | 7.6 | 43 | 51 | 15 |
| co | 371 | 298 | 336 | 251 | 357 | 660 | 704 | 444 |
| no2 | 31 | 24 | 21 | 9.8 | 23 | 43 | 38 | 26 |
| so2 | 1 | 1 | 1 | 1 | 1 | 1.5 | 1.9 | 1 |
| pm25 | 15 | 8.4 | 13 | 13 | 18 | 42 | 44 | 30 |
Koblenz-Hohenfelder Straße
| index | 2024-01-17 | 2024-01-16 | 2024-01-15 | 2024-01-14 | 2024-01-13 | 2024-01-12 | 2024-01-11 | 2024-01-10 |
|---|---|---|---|---|---|---|---|---|
| pm10 | 24 | 13 | 14 | 14 | 20 | 51 | 51 | 35 |
| no2 | 40 | 26 | 19 | 9.7 | 25 | 49 | 43 | 37 |
| no | 20 | 13 | 5.8 | 2.8 | 8.2 | 52 | 50 | 28 |
DERP024
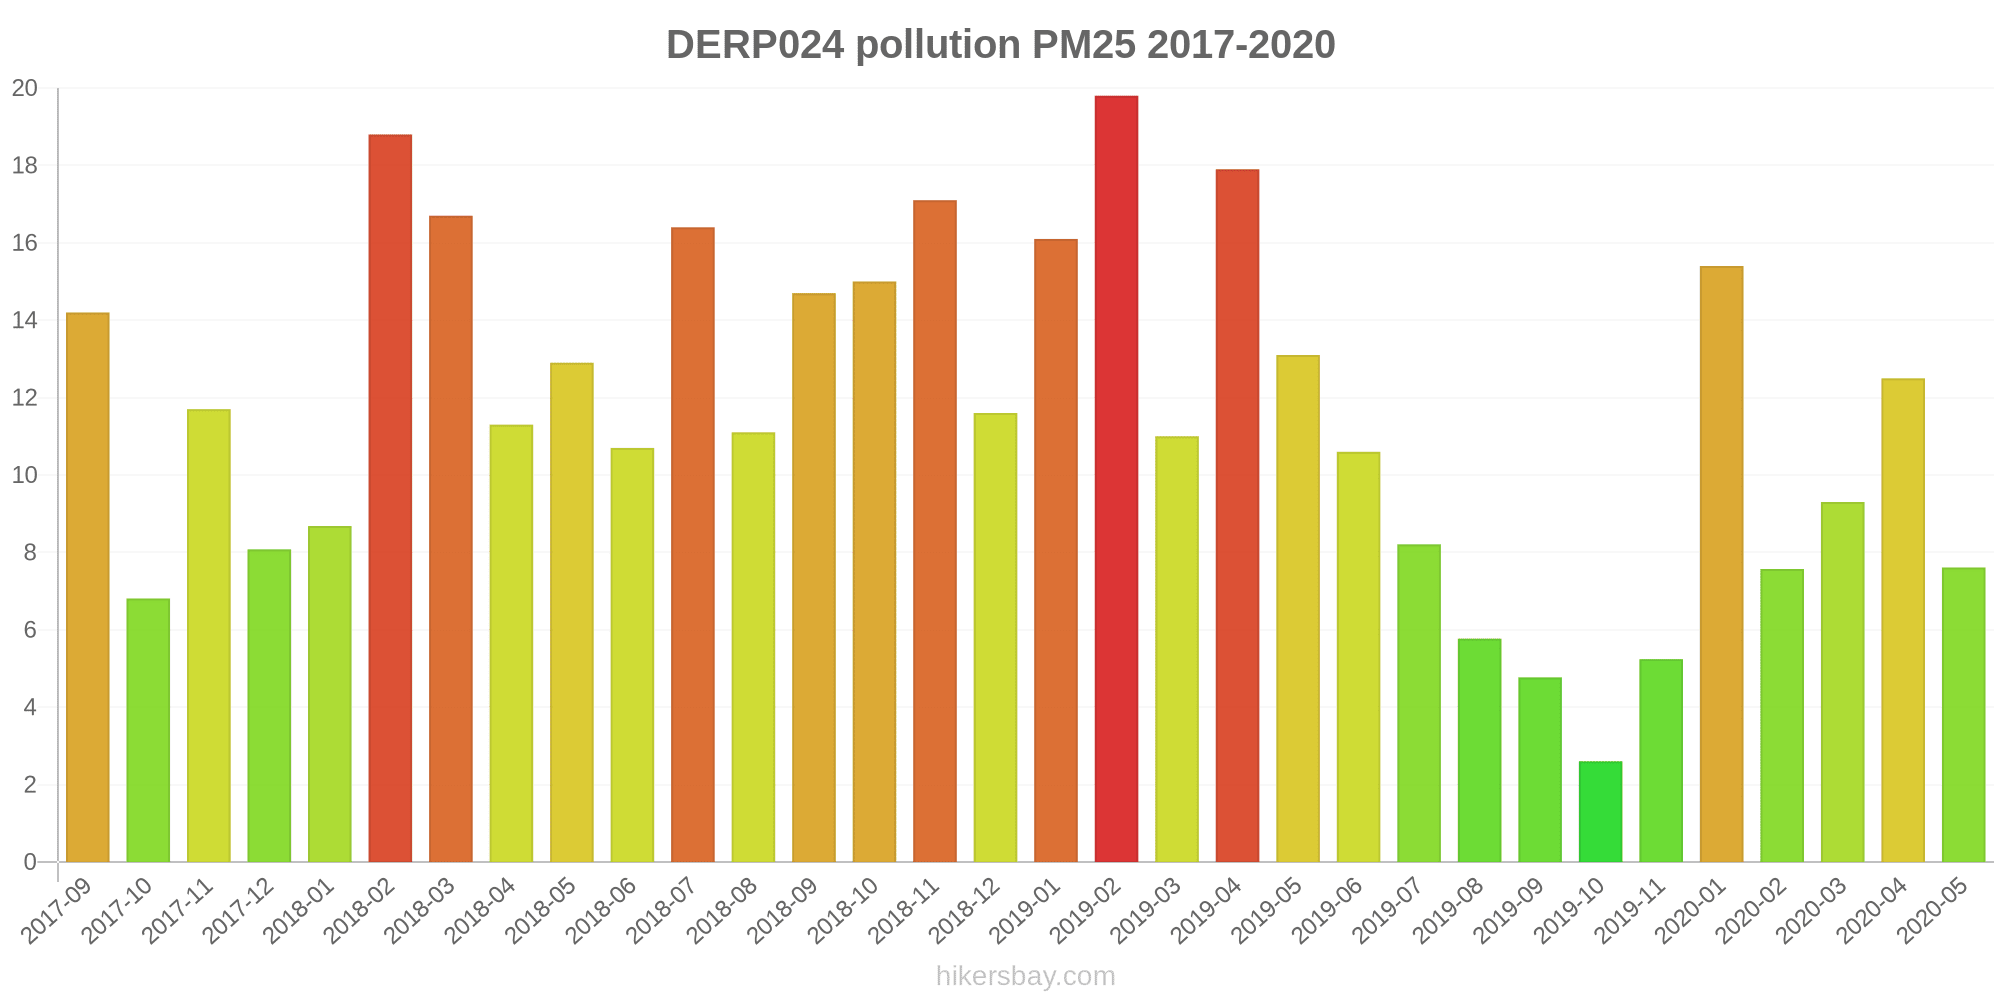
| index | 2020-05 | 2020-04 | 2020-03 | 2020-02 | 2020-01 | 2019-11 | 2019-10 | 2019-09 | 2019-08 | 2019-07 | 2019-06 | 2019-05 | 2019-04 | 2019-03 | 2019-02 | 2019-01 | 2018-12 | 2018-11 | 2018-10 | 2018-09 | 2018-08 | 2018-07 | 2018-06 | 2018-05 | 2018-04 | 2018-03 | 2018-02 | 2018-01 | 2017-12 | 2017-11 | 2017-10 | 2017-09 |
|---|---|---|---|---|---|---|---|---|---|---|---|---|---|---|---|---|---|---|---|---|---|---|---|---|---|---|---|---|---|---|---|---|
| pm25 | 7.6 | 13 | 9.3 | 7.6 | 15 | 5.2 | 2.6 | 4.8 | 5.8 | 8.2 | 11 | 13 | 18 | 11 | 20 | 16 | 12 | 17 | 15 | 15 | 11 | 16 | 11 | 13 | 11 | 17 | 19 | 8.7 | 8.1 | 12 | 6.8 | 14 |
| co | 115 | 152 | 189 | 187 | 295 | 108 | 78 | 55 | 64 | 68 | 122 | 151 | 194 | 146 | 212 | 188 | 199 | 185 | 192 | 235 | 178 | 189 | 132 | 209 | 201 | 255 | 270 | 221 | 185 | 172 | 123 | 201 |
| so2 | 1 | 1.2 | 1.1 | 1.1 | 1 | 0.4 | 0.34 | 0.61 | 0.59 | 0.74 | 1.1 | 1.1 | 1.1 | 1.1 | 1.7 | 1 | 1 | 1.1 | 1.1 | 1.2 | 1.4 | 1.5 | 1.2 | 1.4 | 1.5 | 1.6 | 1.6 | 1.2 | 1.2 | 1.2 | 1.4 | 1.3 |
| no2 | 26 | 33 | 25 | 17 | 30 | 11 | 9.4 | 10 | 14 | 14 | 27 | 26 | 30 | 22 | 35 | 25 | 22 | 26 | 32 | 37 | 30 | 30 | 27 | 34 | 35 | 36 | 32 | 29 | 30 | 33 | 30 | 36 |
| o3 | 38 | 41 | 43 | 50 | 25 | 3.6 | 5.5 | 17 | 16 | 27 | 37 | 35 | 37 | 41 | 8.5 | 31 | 24 | 14 | 12 | 17 | 31 | 40 | 33 | 33 | 39 | 34 | 32 | 31 | 26 | 18 | 21 | 12 |
DERP045
| index | 2020-05 | 2020-04 | 2020-03 | 2020-02 | 2020-01 | 2019-11 | 2019-10 | 2019-09 | 2019-08 | 2019-07 | 2019-06 | 2019-05 | 2019-04 | 2019-03 | 2019-02 | 2019-01 | 2018-12 | 2018-11 | 2018-10 | 2018-09 | 2018-08 | 2018-07 | 2018-06 | 2018-05 | 2018-04 | 2018-03 | 2018-02 | 2018-01 | 2017-12 | 2017-11 | 2017-10 | 2017-09 |
|---|---|---|---|---|---|---|---|---|---|---|---|---|---|---|---|---|---|---|---|---|---|---|---|---|---|---|---|---|---|---|---|---|
| pm10 | 9.7 | 16 | 16 | 15 | 22 | 7.5 | 4.6 | 6.8 | 8.7 | 13 | 19 | 20 | 23 | 17 | 28 | 21 | 16 | 23 | 24 | 21 | 18 | 22 | 22 | 22 | 18 | 19 | 25 | 14 | 12 | 19 | 16 | 25 |
| no2 | 26 | 31 | 25 | 17 | 29 | 12 | 9.3 | 9.4 | 13 | 13 | 26 | 26 | 36 | 26 | 40 | 26 | 25 | 29 | 35 | 41 | 34 | 38 | 29 | 36 | 41 | 45 | 37 | 34 | 34 | 35 | 33 | 47 |