Polusi udara di Landkreis Harz: indeks kualitas udara real-time dan siaga asap.
Perkiraan kualitas polusi dan udara untuk Landkreis Harz. Hari ini Minggu, 21 Juni 2026. Nilai polusi udara berikut telah tercatat untuk Landkreis Harz:- partikulat Matter (PM10) debu tersuspensi - 17 (Bagus)
- partikulat Matter (PM 2.5) debu - 11 (Bagus)
- nitrogen dioksida (NO2) - 12 (Bagus)
- karbon monoksida (CO) - 386 (Bagus)
- ozon (O3) - 50 (Bagus)
- sulfur dioksida (SO2) - 2 (Bagus)

Apa kualitas udara di Landkreis Harz hari ini? Apakah udara tercemar di Landkreis Harz?. Apakah ada Smog?
Apa tingkat PM10 hari ini di Landkreis Harz? (partikulat Matter (PM10) debu tersuspensi)
Level saat ini dari partikulat Matter PM10 di Landkreis Harz adalah:
17 (Bagus)
Nilai PM10 tertinggi biasanya terjadi di bulan: 22 (September 2017).
Nilai terendah dari partikulat PM10 pencemaran Landkreis Harz biasanya dicatat di: September (3.1).
Apa tingkat saat PM 2,5 in Landkreis Harz? (partikulat Matter (PM 2.5) debu)
Hari ini PM 2.5 tingkat:
11 (Bagus)
Sebagai perbandingan, tingkat tertinggi PM 2,5 in Landkreis Harz dalam 7 hari terakhir adalah: 32 (Rabu, 10 Januari 2024) dan Terendah: 5 (Sabtu, 13 Januari 2024).
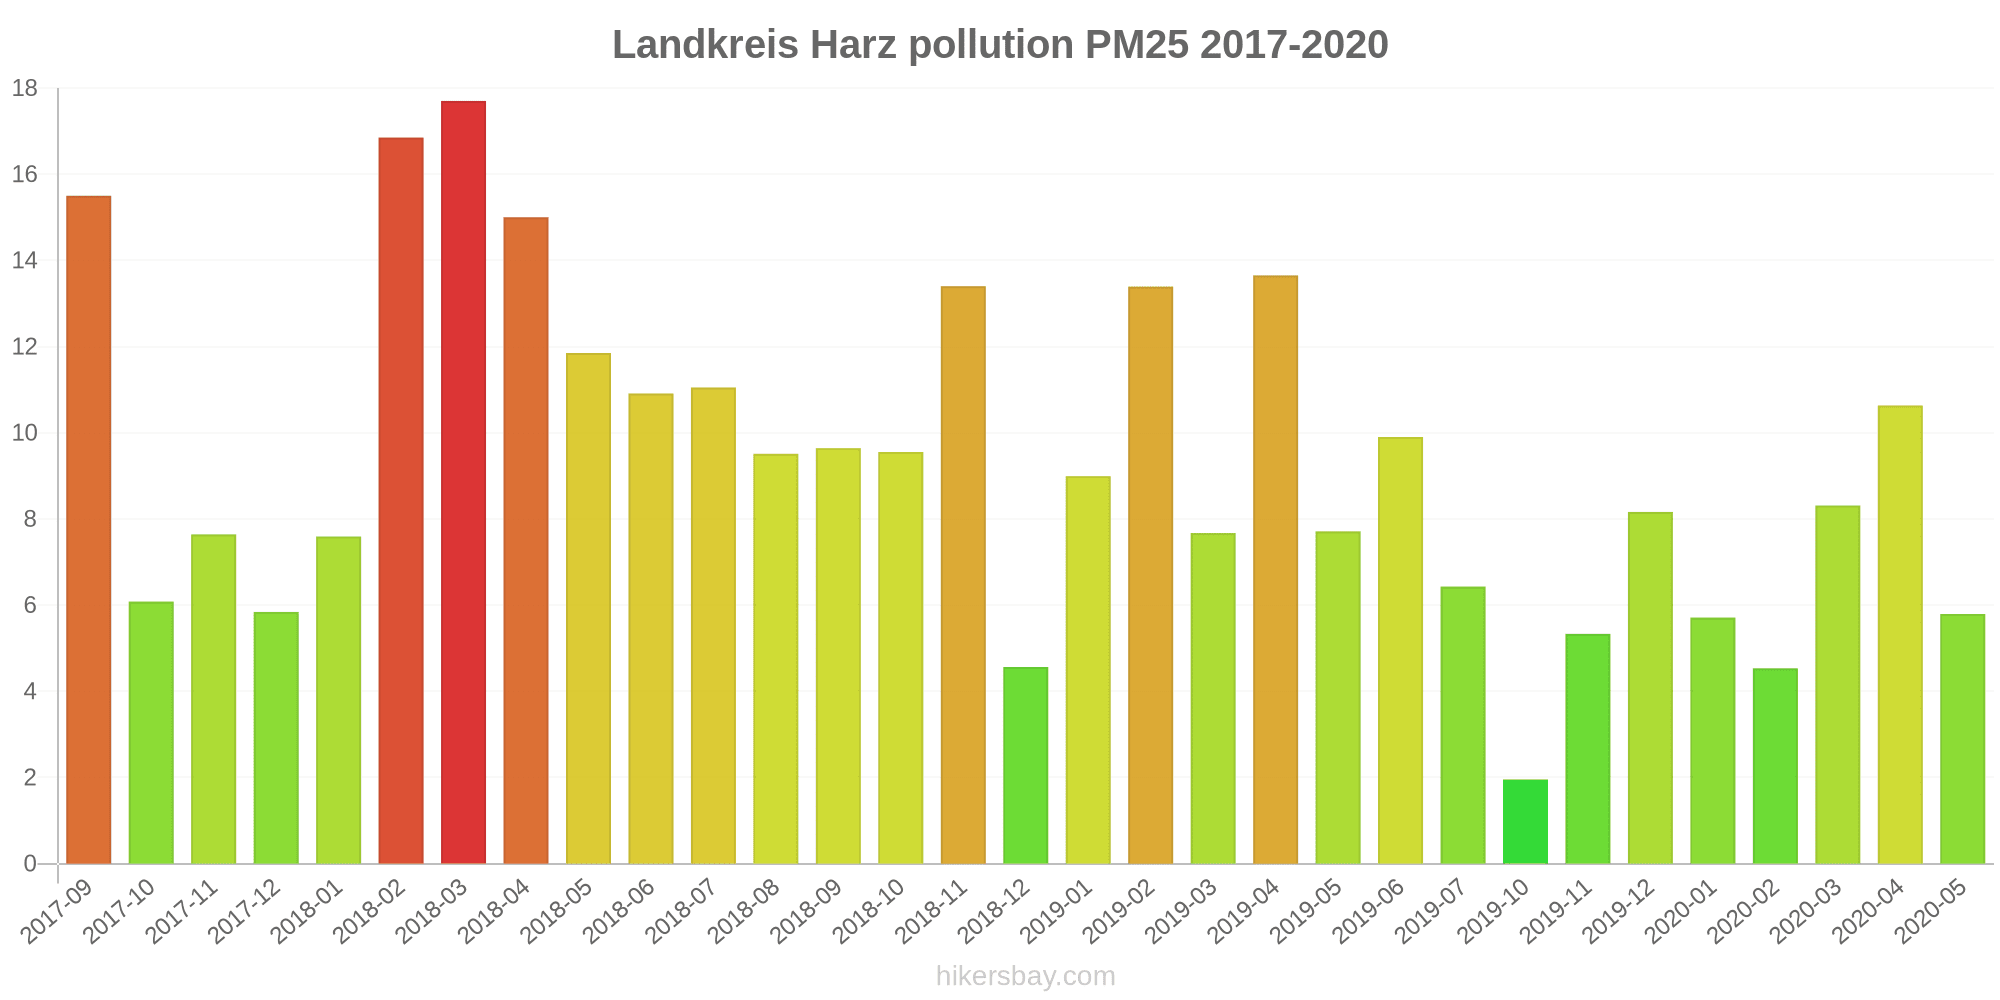
Nilai tertinggi PM 2.5 direkam: 18 (Maret 2018).
Tingkat terendah dari partikulat Matter PM 2.5 polusi terjadi di bulan: Oktober (1.9).
Seberapa tinggi tingkat NO2? (nitrogen dioksida (NO2))
12 (Bagus)
Seberapa tinggi tingkat CO? (karbon monoksida (CO))
386 (Bagus)
Bagaimana tingkat O3 hari ini di Landkreis Harz? (ozon (O3))
50 (Bagus)
Apa tingkat polusi SO2? (sulfur dioksida (SO2))
2 (Bagus)
Data saat ini Rabu, 17 Januari 2024 09.00
PM10 17 (Bagus)
2 (Bagus)
PM2,5 11 (Bagus)
NO2 12 (Bagus)
CO 386 (Bagus)
O3 50 (Bagus)
SO2 2 (Bagus)
Data tentang polusi udara dari beberapa hari terakhir di Landkreis Harz
index
2024-01-10
2024-01-11
2024-01-12
2024-01-13
2024-01-14
2024-01-15
2024-01-16
2024-01-17
2023-07-31
so2
1
Good
2
Good
2
Good
1
Good
2
Good
2
Good
2
Good
0
Good
-
Good
no2
26
Good
18
Good
11
Good
7
Good
7
Good
6
Good
7
Good
12
Good
1
Good
pm10
37
Moderate
19
Good
10
Good
6
Good
7
Good
8
Good
10
Good
11
Good
-
Good
o3
20
Good
33
Good
47
Good
53
Good
50
Good
63
Good
67
Good
45
Good
62
Good
no
15
Good
3
Good
2
Good
1
Good
1
Good
1
Good
1
Good
1
Good
0
Good
pm25
32
Moderate
16
Moderate
9
Good
5
Good
6
Good
7
Good
8
Good
8
Good
-
Good
co
631
Good
376
Good
312
Good
285
Good
298
Good
294
Good
325
Good
235
Good
-
Good
data source »
Polusi udara di Landkreis Harz dari September 2017 ke Mei 2020

index
2020-05
2020-04
2020-03
2020-02
2020-01
2019-12
2019-11
2019-10
2019-09
2019-07
2019-06
2019-05
2019-04
2019-03
2019-02
2019-01
2018-12
2018-11
2018-10
2018-09
2018-08
2018-07
2018-06
2018-05
2018-04
2018-03
2018-02
2018-01
2017-12
2017-11
2017-10
2017-09
co
215 (Good)
206 (Good)
230 (Good)
231 (Good)
269 (Good)
283 (Good)
268 (Good)
91 (Good)
72 (Good)
158 (Good)
216 (Good)
246 (Good)
290 (Good)
309 (Good)
424 (Good)
318 (Good)
317 (Good)
306 (Good)
274 (Good)
279 (Good)
261 (Good)
253 (Good)
237 (Good)
263 (Good)
287 (Good)
309 (Good)
283 (Good)
303 (Good)
297 (Good)
290 (Good)
286 (Good)
325 (Good)
pm10
8.3 (Good)
15 (Good)
12 (Good)
9.9 (Good)
11 (Good)
9 (Good)
7.1 (Good)
4.3 (Good)
3.1 (Good)
13 (Good)
14 (Good)
12 (Good)
18 (Good)
13 (Good)
16 (Good)
13 (Good)
9.6 (Good)
18 (Good)
15 (Good)
15 (Good)
16 (Good)
17 (Good)
18 (Good)
19 (Good)
20 (Moderate)
19 (Good)
20 (Moderate)
11 (Good)
8.7 (Good)
12 (Good)
13 (Good)
22 (Moderate)
so2
0.7 (Good)
1.4 (Good)
1.1 (Good)
1.5 (Good)
0.92 (Good)
0.72 (Good)
0.88 (Good)
0.49 (Good)
0.56 (Good)
1.9 (Good)
1.6 (Good)
1.7 (Good)
2 (Good)
1.6 (Good)
1.8 (Good)
1.7 (Good)
1.9 (Good)
1.4 (Good)
1.6 (Good)
1.5 (Good)
1.3 (Good)
1.3 (Good)
1.2 (Good)
1.6 (Good)
2.5 (Good)
2.1 (Good)
1.5 (Good)
1.6 (Good)
1.4 (Good)
1.7 (Good)
1.8 (Good)
1.8 (Good)
no2
5.7 (Good)
6.8 (Good)
7.5 (Good)
4.6 (Good)
8.2 (Good)
6.5 (Good)
7.5 (Good)
2.3 (Good)
1.6 (Good)
3.9 (Good)
5.5 (Good)
6 (Good)
11 (Good)
5.7 (Good)
11 (Good)
8.8 (Good)
7.8 (Good)
12 (Good)
9.6 (Good)
11 (Good)
9.3 (Good)
7.8 (Good)
6.1 (Good)
8.8 (Good)
8.8 (Good)
10 (Good)
13 (Good)
9 (Good)
9.2 (Good)
10 (Good)
7.8 (Good)
11 (Good)
o3
61 (Good)
68 (Good)
57 (Good)
64 (Good)
48 (Good)
44 (Good)
19 (Good)
14 (Good)
22 (Good)
67 (Good)
70 (Good)
62 (Good)
61 (Good)
64 (Good)
50 (Good)
52 (Good)
48 (Good)
31 (Good)
45 (Good)
50 (Good)
63 (Good)
66 (Good)
64 (Good)
63 (Good)
66 (Good)
58 (Good)
50 (Good)
47 (Good)
46 (Good)
41 (Good)
49 (Good)
38 (Good)
pm25
5.8 (Good)
11 (Good)
8.3 (Good)
4.5 (Good)
5.7 (Good)
8.2 (Good)
5.3 (Good)
1.9 (Good)
- (Good)
6.4 (Good)
9.9 (Good)
7.7 (Good)
14 (Moderate)
7.7 (Good)
13 (Moderate)
9 (Good)
4.6 (Good)
13 (Moderate)
9.6 (Good)
9.6 (Good)
9.5 (Good)
11 (Good)
11 (Good)
12 (Good)
15 (Moderate)
18 (Moderate)
17 (Moderate)
7.6 (Good)
5.8 (Good)
7.6 (Good)
6.1 (Good)
16 (Moderate)
data source »
Wernigerode/Bahnhof
Rabu, 17 Januari 2024 09.00
PM10 29 (Moderat)
partikulat Matter (PM10) debu tersuspensi
5.3 (Bagus)
index_name_no
PM2,5 19 (Moderat)
partikulat Matter (PM 2.5) debu
NO2 24 (Bagus)
nitrogen dioksida (NO2)
CO 386 (Bagus)
karbon monoksida (CO)
O3 48 (Bagus)
ozon (O3)
SO2 3.8 (Bagus)
sulfur dioksida (SO2)
Brocken
Senin, 31 Juli 2023 00.00
O3 63 (Bagus)
ozon (O3)
NO2 1.8 (Bagus)
nitrogen dioksida (NO2)
-0.02 (Bagus)
index_name_no
Halberstadt
Rabu, 17 Januari 2024 09.00
1.9 (Bagus)
index_name_no
O3 45 (Bagus)
ozon (O3)
PM2,5 8.1 (Bagus)
partikulat Matter (PM 2.5) debu
NO2 18 (Bagus)
nitrogen dioksida (NO2)
PM10 12 (Bagus)
partikulat Matter (PM10) debu tersuspensi
Unterharz / Friedrichsbrunn
Rabu, 17 Januari 2024 09.00
O3 44 (Bagus)
ozon (O3)
0.46 (Bagus)
index_name_no
PM2,5 4.8 (Bagus)
partikulat Matter (PM 2.5) debu
SO2 -0.72 (Bagus)
sulfur dioksida (SO2)
NO2 5.6 (Bagus)
nitrogen dioksida (NO2)
PM10 8 (Bagus)
partikulat Matter (PM10) debu tersuspensi
Wernigerode/Bahnhof
index
2024-01-17
2024-01-16
2024-01-15
2024-01-14
2024-01-13
2024-01-12
2024-01-11
2024-01-10
so2
0.9
3.8
4.6
3.2
2.8
3.1
2.9
1.6
no2
12
9.8
8
8.9
8.8
15
24
39
pm10
9.6
18
16
13
13
13
17
41
o3
52
65
62
51
53
45
34
13
no
1.5
1.9
2
1.8
1.4
4.5
6.1
20
pm25
8.8
16
14
11
10
12
13
35
co
235
325
294
298
285
312
376
631
Brocken
index
2023-07-31
o3
62
no2
1.1
no
0.06
Halberstadt
index
2024-01-17
2024-01-16
2024-01-15
2024-01-14
2024-01-13
2024-01-12
2024-01-11
2024-01-10
no
0.81
0.51
0.39
0.36
0.32
0.65
2.7
26
o3
43
66
65
52
56
47
20
7.2
no2
15
6.3
4.9
6.5
6.1
11
25
32
pm25
8.9
3.9
3.4
2.9
2.8
9.6
30
45
pm10
14
7.5
4
4.3
2.9
13
34
52
Unterharz / Friedrichsbrunn
index
2024-01-17
2024-01-16
2024-01-15
2024-01-14
2024-01-13
2024-01-12
2024-01-11
2024-01-10
no
0.08
0.11
0.24
0.19
0.11
0.2
0.3
0.49
pm25
6.4
4.1
2.6
3.1
1.6
4.4
5
15
no2
7.7
3.5
4.3
5.5
5.1
5.1
5.7
8.4
so2
-0.43
-0.21
-0.18
-0.05
-0.01
0.21
0.3
1.1
o3
41
69
63
48
51
49
46
40
pm10
8.9
5.5
3
3.5
2
5.2
7.2
19
DEST011
index
2020-05
2020-04
2020-03
2020-02
2020-01
2019-12
2019-11
2019-10
2019-09
2019-07
2019-06
2019-05
2019-04
2019-03
2019-02
2019-01
2018-12
2018-11
2018-10
2018-09
2018-08
2018-07
2018-06
2018-05
2018-04
2018-03
2018-02
2018-01
2017-12
2017-11
2017-10
2017-09
pm10
7.7
14
12
17
16
-
6.1
5.2
4.4
14
17
15
20
16
17
14
15
17
17
15
17
16
19
19
20
23
20
13
12
15
16
20
co
215
206
230
231
269
283
268
91
72
158
216
246
290
309
424
318
317
306
274
279
261
253
237
263
287
309
283
303
297
290
286
325
so2
1.1
1.5
1.6
2.7
1.3
1.3
0.99
0.77
0.79
2.9
1.9
1.8
1.5
2.7
2.7
3.2
4.7
1.1
2.9
2.8
2.4
2.5
2.3
1.1
2.8
2.3
1.6
2.9
3.1
2.1
3.8
1.9
no2
6.8
8
8.2
6.8
14
9.9
11
2.5
2.4
8.6
7.3
10
16
8
15
14
11
16
14
16
15
11
8.3
14
14
17
21
15
15
16
13
17
o3
63
69
57
63
39
40
14
13
20
61
68
59
51
63
47
47
45
24
43
46
59
59
58
56
61
51
42
42
42
36
46
24
DEST039
index
2020-05
2020-04
2020-03
2020-02
2020-01
2019-12
2019-11
2019-10
2019-09
2019-07
2019-06
2019-05
2019-04
2019-03
2019-02
2019-01
2018-12
2018-11
2018-10
2018-09
2018-08
2018-07
2018-06
2018-05
2018-04
2018-03
2018-02
2018-01
2017-12
2017-11
2017-10
2017-09
so2
0.34
1.2
1
1.2
0.75
0.42
0.78
0.53
0.75
1.4
2.4
1.9
3.1
1.6
1.9
1.3
0.93
1.7
1.3
1.4
1.1
1.1
0.92
1.5
1.7
1.9
1.1
0.56
0.95
0.76
0.5
2.3
no2
1.8
2.6
4.3
3.2
2.6
0.95
1.8
1.4
1.2
1.8
1.6
2.6
5.3
4.5
6.2
3.9
3.5
4.2
3
3.9
3
2.1
1.8
1.9
2.8
3
4.9
2.6
4
3.5
2.6
4.2
o3
88
97
74
68
74
62
49
21
27
77
107
85
95
77
75
67
63
59
72
82
90
104
94
104
98
76
67
60
59
59
68
72
DEST044
2017-09 2020-05
index
2020-05
2020-04
2020-03
2020-02
2020-01
2019-12
2019-11
2019-10
2019-09
2019-07
2019-06
2019-05
2019-04
2019-03
2019-02
2019-01
2018-12
2018-11
2018-10
2018-09
2018-08
2018-07
2018-06
2018-05
2018-04
2018-03
2018-02
2018-01
2017-12
2017-11
2017-10
2017-09
pm25
6.5
13
10
5.5
7.8
8.2
6.7
2.1
-
5.7
12
9.2
17
9.9
17
11
5.9
16
13
12
11
13
12
13
18
21
18
9.6
7.3
9.2
7.4
20
pm10
9.9
19
14
7.4
11
9
9.6
3.6
3
12
15
12
21
14
20
15
8.2
23
19
18
18
22
19
22
24
21
22
13
8.9
13
13
28
no2
11
12
13
4.7
12
13
14
3.7
1.7
2.6
9.3
8.2
19
7.8
17
13
10
19
16
18
14
13
9.9
17
15
15
18
13
12
15
12
18
o3
47
44
43
61
37
24
6.3
12
22
60
49
53
38
58
34
44
43
17
32
37
50
50
51
40
49
49
40
40
42
35
42
27
DEST098
2017-09 2020-05

index
2020-05
2020-04
2020-03
2020-02
2020-01
2019-12
2019-11
2019-10
2019-09
2019-07
2019-06
2019-05
2019-04
2019-03
2019-02
2019-01
2018-12
2018-11
2018-10
2018-09
2018-08
2018-07
2018-06
2018-05
2018-04
2018-03
2018-02
2018-01
2017-12
2017-11
2017-10
2017-09
pm25
5.1
8.4
6.2
3.6
3.6
-
4
1.8
-
7.2
8.3
6.2
11
5.4
9.8
6.7
3.3
10
6.3
7.6
8.3
9.6
9.7
11
12
15
15
5.6
4.4
6.1
4.8
11
pm10
7.2
12
9.2
5.3
7.6
-
5.6
4
1.8
13
11
9.6
14
9.7
12
9.6
5.3
14
10
11
12
14
16
16
17
14
19
7.7
5.6
8.8
8.8
18
so2
-
1.4
0.77
0.5
0.77
0.47
-
0.18
0.14
1.5
0.66
1.6
1.4
0.41
0.88
0.5
0.09
1.2
0.47
0.24
0.5
0.48
0.53
2.2
3
2.1
1.9
1.2
0.28
2.1
1.1
1
no2
3.6
4.7
4.8
3.8
4.8
1.9
3.8
1.5
0.96
2.8
3.9
3.3
4.2
2.6
7
5.2
6.6
8.4
5.5
6.9
5.6
5.6
4.4
2.6
2.9
5.2
8.4
5.2
6
6.1
3.7
4
o3
47
60
52
63
41
49
8.4
11
18
69
55
53
59
58
44
51
41
24
33
35
52
51
52
53
58
56
50
45
43
34
42
28
* Pollution data source:
https://openaq.org
(EEA Germany)
The data is licensed under CC-By 4.0
PM10 17 (Bagus)
2 (Bagus)
PM2,5 11 (Bagus)
NO2 12 (Bagus)
CO 386 (Bagus)
O3 50 (Bagus)
SO2 2 (Bagus)
Data tentang polusi udara dari beberapa hari terakhir di Landkreis Harz
| index | 2024-01-10 | 2024-01-11 | 2024-01-12 | 2024-01-13 | 2024-01-14 | 2024-01-15 | 2024-01-16 | 2024-01-17 | 2023-07-31 |
|---|---|---|---|---|---|---|---|---|---|
| so2 | 1 Good |
2 Good |
2 Good |
1 Good |
2 Good |
2 Good |
2 Good |
0 Good |
- Good |
| no2 | 26 Good |
18 Good |
11 Good |
7 Good |
7 Good |
6 Good |
7 Good |
12 Good |
1 Good |
| pm10 | 37 Moderate |
19 Good |
10 Good |
6 Good |
7 Good |
8 Good |
10 Good |
11 Good |
- Good |
| o3 | 20 Good |
33 Good |
47 Good |
53 Good |
50 Good |
63 Good |
67 Good |
45 Good |
62 Good |
| no | 15 Good |
3 Good |
2 Good |
1 Good |
1 Good |
1 Good |
1 Good |
1 Good |
0 Good |
| pm25 | 32 Moderate |
16 Moderate |
9 Good |
5 Good |
6 Good |
7 Good |
8 Good |
8 Good |
- Good |
| co | 631 Good |
376 Good |
312 Good |
285 Good |
298 Good |
294 Good |
325 Good |
235 Good |
- Good |
| index | 2020-05 | 2020-04 | 2020-03 | 2020-02 | 2020-01 | 2019-12 | 2019-11 | 2019-10 | 2019-09 | 2019-07 | 2019-06 | 2019-05 | 2019-04 | 2019-03 | 2019-02 | 2019-01 | 2018-12 | 2018-11 | 2018-10 | 2018-09 | 2018-08 | 2018-07 | 2018-06 | 2018-05 | 2018-04 | 2018-03 | 2018-02 | 2018-01 | 2017-12 | 2017-11 | 2017-10 | 2017-09 |
|---|---|---|---|---|---|---|---|---|---|---|---|---|---|---|---|---|---|---|---|---|---|---|---|---|---|---|---|---|---|---|---|---|
| co | 215 (Good) | 206 (Good) | 230 (Good) | 231 (Good) | 269 (Good) | 283 (Good) | 268 (Good) | 91 (Good) | 72 (Good) | 158 (Good) | 216 (Good) | 246 (Good) | 290 (Good) | 309 (Good) | 424 (Good) | 318 (Good) | 317 (Good) | 306 (Good) | 274 (Good) | 279 (Good) | 261 (Good) | 253 (Good) | 237 (Good) | 263 (Good) | 287 (Good) | 309 (Good) | 283 (Good) | 303 (Good) | 297 (Good) | 290 (Good) | 286 (Good) | 325 (Good) |
| pm10 | 8.3 (Good) | 15 (Good) | 12 (Good) | 9.9 (Good) | 11 (Good) | 9 (Good) | 7.1 (Good) | 4.3 (Good) | 3.1 (Good) | 13 (Good) | 14 (Good) | 12 (Good) | 18 (Good) | 13 (Good) | 16 (Good) | 13 (Good) | 9.6 (Good) | 18 (Good) | 15 (Good) | 15 (Good) | 16 (Good) | 17 (Good) | 18 (Good) | 19 (Good) | 20 (Moderate) | 19 (Good) | 20 (Moderate) | 11 (Good) | 8.7 (Good) | 12 (Good) | 13 (Good) | 22 (Moderate) |
| so2 | 0.7 (Good) | 1.4 (Good) | 1.1 (Good) | 1.5 (Good) | 0.92 (Good) | 0.72 (Good) | 0.88 (Good) | 0.49 (Good) | 0.56 (Good) | 1.9 (Good) | 1.6 (Good) | 1.7 (Good) | 2 (Good) | 1.6 (Good) | 1.8 (Good) | 1.7 (Good) | 1.9 (Good) | 1.4 (Good) | 1.6 (Good) | 1.5 (Good) | 1.3 (Good) | 1.3 (Good) | 1.2 (Good) | 1.6 (Good) | 2.5 (Good) | 2.1 (Good) | 1.5 (Good) | 1.6 (Good) | 1.4 (Good) | 1.7 (Good) | 1.8 (Good) | 1.8 (Good) |
| no2 | 5.7 (Good) | 6.8 (Good) | 7.5 (Good) | 4.6 (Good) | 8.2 (Good) | 6.5 (Good) | 7.5 (Good) | 2.3 (Good) | 1.6 (Good) | 3.9 (Good) | 5.5 (Good) | 6 (Good) | 11 (Good) | 5.7 (Good) | 11 (Good) | 8.8 (Good) | 7.8 (Good) | 12 (Good) | 9.6 (Good) | 11 (Good) | 9.3 (Good) | 7.8 (Good) | 6.1 (Good) | 8.8 (Good) | 8.8 (Good) | 10 (Good) | 13 (Good) | 9 (Good) | 9.2 (Good) | 10 (Good) | 7.8 (Good) | 11 (Good) |
| o3 | 61 (Good) | 68 (Good) | 57 (Good) | 64 (Good) | 48 (Good) | 44 (Good) | 19 (Good) | 14 (Good) | 22 (Good) | 67 (Good) | 70 (Good) | 62 (Good) | 61 (Good) | 64 (Good) | 50 (Good) | 52 (Good) | 48 (Good) | 31 (Good) | 45 (Good) | 50 (Good) | 63 (Good) | 66 (Good) | 64 (Good) | 63 (Good) | 66 (Good) | 58 (Good) | 50 (Good) | 47 (Good) | 46 (Good) | 41 (Good) | 49 (Good) | 38 (Good) |
| pm25 | 5.8 (Good) | 11 (Good) | 8.3 (Good) | 4.5 (Good) | 5.7 (Good) | 8.2 (Good) | 5.3 (Good) | 1.9 (Good) | - (Good) | 6.4 (Good) | 9.9 (Good) | 7.7 (Good) | 14 (Moderate) | 7.7 (Good) | 13 (Moderate) | 9 (Good) | 4.6 (Good) | 13 (Moderate) | 9.6 (Good) | 9.6 (Good) | 9.5 (Good) | 11 (Good) | 11 (Good) | 12 (Good) | 15 (Moderate) | 18 (Moderate) | 17 (Moderate) | 7.6 (Good) | 5.8 (Good) | 7.6 (Good) | 6.1 (Good) | 16 (Moderate) |
PM10 29 (Moderat)
partikulat Matter (PM10) debu tersuspensi5.3 (Bagus)
index_name_noPM2,5 19 (Moderat)
partikulat Matter (PM 2.5) debuNO2 24 (Bagus)
nitrogen dioksida (NO2)CO 386 (Bagus)
karbon monoksida (CO)O3 48 (Bagus)
ozon (O3)SO2 3.8 (Bagus)
sulfur dioksida (SO2)O3 63 (Bagus)
ozon (O3)NO2 1.8 (Bagus)
nitrogen dioksida (NO2)-0.02 (Bagus)
index_name_no1.9 (Bagus)
index_name_noO3 45 (Bagus)
ozon (O3)PM2,5 8.1 (Bagus)
partikulat Matter (PM 2.5) debuNO2 18 (Bagus)
nitrogen dioksida (NO2)PM10 12 (Bagus)
partikulat Matter (PM10) debu tersuspensiO3 44 (Bagus)
ozon (O3)0.46 (Bagus)
index_name_noPM2,5 4.8 (Bagus)
partikulat Matter (PM 2.5) debuSO2 -0.72 (Bagus)
sulfur dioksida (SO2)NO2 5.6 (Bagus)
nitrogen dioksida (NO2)PM10 8 (Bagus)
partikulat Matter (PM10) debu tersuspensiWernigerode/Bahnhof
| index | 2024-01-17 | 2024-01-16 | 2024-01-15 | 2024-01-14 | 2024-01-13 | 2024-01-12 | 2024-01-11 | 2024-01-10 |
|---|---|---|---|---|---|---|---|---|
| so2 | 0.9 | 3.8 | 4.6 | 3.2 | 2.8 | 3.1 | 2.9 | 1.6 |
| no2 | 12 | 9.8 | 8 | 8.9 | 8.8 | 15 | 24 | 39 |
| pm10 | 9.6 | 18 | 16 | 13 | 13 | 13 | 17 | 41 |
| o3 | 52 | 65 | 62 | 51 | 53 | 45 | 34 | 13 |
| no | 1.5 | 1.9 | 2 | 1.8 | 1.4 | 4.5 | 6.1 | 20 |
| pm25 | 8.8 | 16 | 14 | 11 | 10 | 12 | 13 | 35 |
| co | 235 | 325 | 294 | 298 | 285 | 312 | 376 | 631 |
Brocken
| index | 2023-07-31 |
|---|---|
| o3 | 62 |
| no2 | 1.1 |
| no | 0.06 |
Halberstadt
| index | 2024-01-17 | 2024-01-16 | 2024-01-15 | 2024-01-14 | 2024-01-13 | 2024-01-12 | 2024-01-11 | 2024-01-10 |
|---|---|---|---|---|---|---|---|---|
| no | 0.81 | 0.51 | 0.39 | 0.36 | 0.32 | 0.65 | 2.7 | 26 |
| o3 | 43 | 66 | 65 | 52 | 56 | 47 | 20 | 7.2 |
| no2 | 15 | 6.3 | 4.9 | 6.5 | 6.1 | 11 | 25 | 32 |
| pm25 | 8.9 | 3.9 | 3.4 | 2.9 | 2.8 | 9.6 | 30 | 45 |
| pm10 | 14 | 7.5 | 4 | 4.3 | 2.9 | 13 | 34 | 52 |
Unterharz / Friedrichsbrunn
| index | 2024-01-17 | 2024-01-16 | 2024-01-15 | 2024-01-14 | 2024-01-13 | 2024-01-12 | 2024-01-11 | 2024-01-10 |
|---|---|---|---|---|---|---|---|---|
| no | 0.08 | 0.11 | 0.24 | 0.19 | 0.11 | 0.2 | 0.3 | 0.49 |
| pm25 | 6.4 | 4.1 | 2.6 | 3.1 | 1.6 | 4.4 | 5 | 15 |
| no2 | 7.7 | 3.5 | 4.3 | 5.5 | 5.1 | 5.1 | 5.7 | 8.4 |
| so2 | -0.43 | -0.21 | -0.18 | -0.05 | -0.01 | 0.21 | 0.3 | 1.1 |
| o3 | 41 | 69 | 63 | 48 | 51 | 49 | 46 | 40 |
| pm10 | 8.9 | 5.5 | 3 | 3.5 | 2 | 5.2 | 7.2 | 19 |
DEST011
| index | 2020-05 | 2020-04 | 2020-03 | 2020-02 | 2020-01 | 2019-12 | 2019-11 | 2019-10 | 2019-09 | 2019-07 | 2019-06 | 2019-05 | 2019-04 | 2019-03 | 2019-02 | 2019-01 | 2018-12 | 2018-11 | 2018-10 | 2018-09 | 2018-08 | 2018-07 | 2018-06 | 2018-05 | 2018-04 | 2018-03 | 2018-02 | 2018-01 | 2017-12 | 2017-11 | 2017-10 | 2017-09 |
|---|---|---|---|---|---|---|---|---|---|---|---|---|---|---|---|---|---|---|---|---|---|---|---|---|---|---|---|---|---|---|---|---|
| pm10 | 7.7 | 14 | 12 | 17 | 16 | - | 6.1 | 5.2 | 4.4 | 14 | 17 | 15 | 20 | 16 | 17 | 14 | 15 | 17 | 17 | 15 | 17 | 16 | 19 | 19 | 20 | 23 | 20 | 13 | 12 | 15 | 16 | 20 |
| co | 215 | 206 | 230 | 231 | 269 | 283 | 268 | 91 | 72 | 158 | 216 | 246 | 290 | 309 | 424 | 318 | 317 | 306 | 274 | 279 | 261 | 253 | 237 | 263 | 287 | 309 | 283 | 303 | 297 | 290 | 286 | 325 |
| so2 | 1.1 | 1.5 | 1.6 | 2.7 | 1.3 | 1.3 | 0.99 | 0.77 | 0.79 | 2.9 | 1.9 | 1.8 | 1.5 | 2.7 | 2.7 | 3.2 | 4.7 | 1.1 | 2.9 | 2.8 | 2.4 | 2.5 | 2.3 | 1.1 | 2.8 | 2.3 | 1.6 | 2.9 | 3.1 | 2.1 | 3.8 | 1.9 |
| no2 | 6.8 | 8 | 8.2 | 6.8 | 14 | 9.9 | 11 | 2.5 | 2.4 | 8.6 | 7.3 | 10 | 16 | 8 | 15 | 14 | 11 | 16 | 14 | 16 | 15 | 11 | 8.3 | 14 | 14 | 17 | 21 | 15 | 15 | 16 | 13 | 17 |
| o3 | 63 | 69 | 57 | 63 | 39 | 40 | 14 | 13 | 20 | 61 | 68 | 59 | 51 | 63 | 47 | 47 | 45 | 24 | 43 | 46 | 59 | 59 | 58 | 56 | 61 | 51 | 42 | 42 | 42 | 36 | 46 | 24 |
DEST039
| index | 2020-05 | 2020-04 | 2020-03 | 2020-02 | 2020-01 | 2019-12 | 2019-11 | 2019-10 | 2019-09 | 2019-07 | 2019-06 | 2019-05 | 2019-04 | 2019-03 | 2019-02 | 2019-01 | 2018-12 | 2018-11 | 2018-10 | 2018-09 | 2018-08 | 2018-07 | 2018-06 | 2018-05 | 2018-04 | 2018-03 | 2018-02 | 2018-01 | 2017-12 | 2017-11 | 2017-10 | 2017-09 |
|---|---|---|---|---|---|---|---|---|---|---|---|---|---|---|---|---|---|---|---|---|---|---|---|---|---|---|---|---|---|---|---|---|
| so2 | 0.34 | 1.2 | 1 | 1.2 | 0.75 | 0.42 | 0.78 | 0.53 | 0.75 | 1.4 | 2.4 | 1.9 | 3.1 | 1.6 | 1.9 | 1.3 | 0.93 | 1.7 | 1.3 | 1.4 | 1.1 | 1.1 | 0.92 | 1.5 | 1.7 | 1.9 | 1.1 | 0.56 | 0.95 | 0.76 | 0.5 | 2.3 |
| no2 | 1.8 | 2.6 | 4.3 | 3.2 | 2.6 | 0.95 | 1.8 | 1.4 | 1.2 | 1.8 | 1.6 | 2.6 | 5.3 | 4.5 | 6.2 | 3.9 | 3.5 | 4.2 | 3 | 3.9 | 3 | 2.1 | 1.8 | 1.9 | 2.8 | 3 | 4.9 | 2.6 | 4 | 3.5 | 2.6 | 4.2 |
| o3 | 88 | 97 | 74 | 68 | 74 | 62 | 49 | 21 | 27 | 77 | 107 | 85 | 95 | 77 | 75 | 67 | 63 | 59 | 72 | 82 | 90 | 104 | 94 | 104 | 98 | 76 | 67 | 60 | 59 | 59 | 68 | 72 |
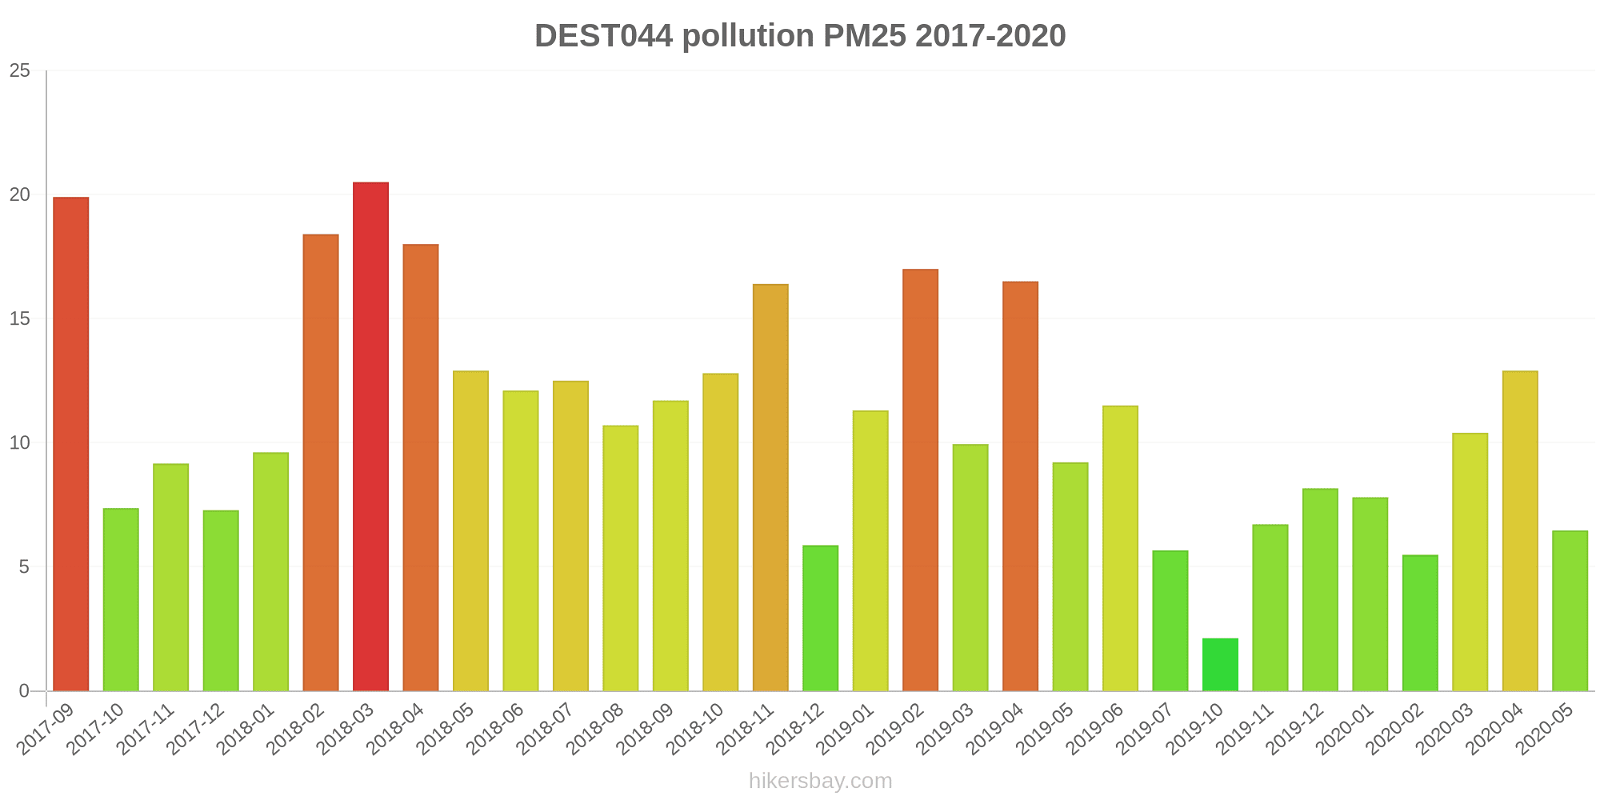
DEST044

| index | 2020-05 | 2020-04 | 2020-03 | 2020-02 | 2020-01 | 2019-12 | 2019-11 | 2019-10 | 2019-09 | 2019-07 | 2019-06 | 2019-05 | 2019-04 | 2019-03 | 2019-02 | 2019-01 | 2018-12 | 2018-11 | 2018-10 | 2018-09 | 2018-08 | 2018-07 | 2018-06 | 2018-05 | 2018-04 | 2018-03 | 2018-02 | 2018-01 | 2017-12 | 2017-11 | 2017-10 | 2017-09 |
|---|---|---|---|---|---|---|---|---|---|---|---|---|---|---|---|---|---|---|---|---|---|---|---|---|---|---|---|---|---|---|---|---|
| pm25 | 6.5 | 13 | 10 | 5.5 | 7.8 | 8.2 | 6.7 | 2.1 | - | 5.7 | 12 | 9.2 | 17 | 9.9 | 17 | 11 | 5.9 | 16 | 13 | 12 | 11 | 13 | 12 | 13 | 18 | 21 | 18 | 9.6 | 7.3 | 9.2 | 7.4 | 20 |
| pm10 | 9.9 | 19 | 14 | 7.4 | 11 | 9 | 9.6 | 3.6 | 3 | 12 | 15 | 12 | 21 | 14 | 20 | 15 | 8.2 | 23 | 19 | 18 | 18 | 22 | 19 | 22 | 24 | 21 | 22 | 13 | 8.9 | 13 | 13 | 28 |
| no2 | 11 | 12 | 13 | 4.7 | 12 | 13 | 14 | 3.7 | 1.7 | 2.6 | 9.3 | 8.2 | 19 | 7.8 | 17 | 13 | 10 | 19 | 16 | 18 | 14 | 13 | 9.9 | 17 | 15 | 15 | 18 | 13 | 12 | 15 | 12 | 18 |
| o3 | 47 | 44 | 43 | 61 | 37 | 24 | 6.3 | 12 | 22 | 60 | 49 | 53 | 38 | 58 | 34 | 44 | 43 | 17 | 32 | 37 | 50 | 50 | 51 | 40 | 49 | 49 | 40 | 40 | 42 | 35 | 42 | 27 |
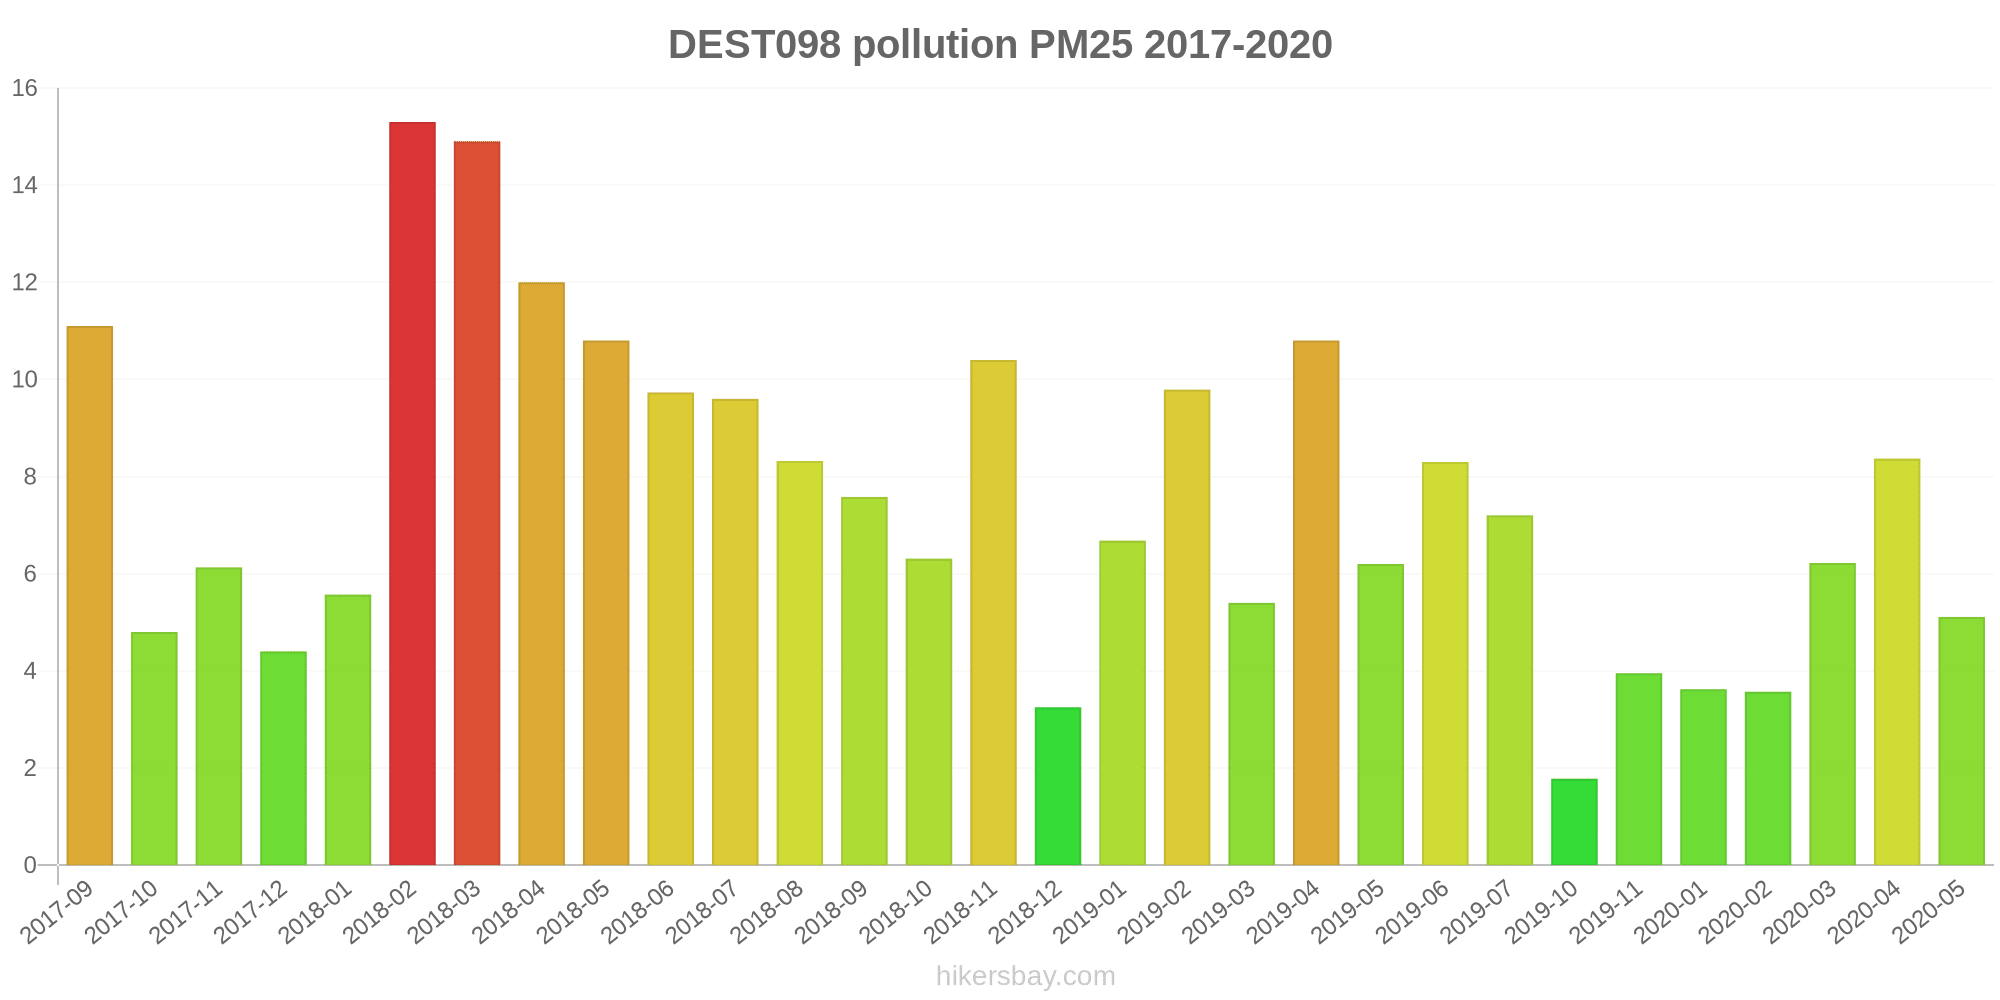
DEST098
| index | 2020-05 | 2020-04 | 2020-03 | 2020-02 | 2020-01 | 2019-12 | 2019-11 | 2019-10 | 2019-09 | 2019-07 | 2019-06 | 2019-05 | 2019-04 | 2019-03 | 2019-02 | 2019-01 | 2018-12 | 2018-11 | 2018-10 | 2018-09 | 2018-08 | 2018-07 | 2018-06 | 2018-05 | 2018-04 | 2018-03 | 2018-02 | 2018-01 | 2017-12 | 2017-11 | 2017-10 | 2017-09 |
|---|---|---|---|---|---|---|---|---|---|---|---|---|---|---|---|---|---|---|---|---|---|---|---|---|---|---|---|---|---|---|---|---|
| pm25 | 5.1 | 8.4 | 6.2 | 3.6 | 3.6 | - | 4 | 1.8 | - | 7.2 | 8.3 | 6.2 | 11 | 5.4 | 9.8 | 6.7 | 3.3 | 10 | 6.3 | 7.6 | 8.3 | 9.6 | 9.7 | 11 | 12 | 15 | 15 | 5.6 | 4.4 | 6.1 | 4.8 | 11 |
| pm10 | 7.2 | 12 | 9.2 | 5.3 | 7.6 | - | 5.6 | 4 | 1.8 | 13 | 11 | 9.6 | 14 | 9.7 | 12 | 9.6 | 5.3 | 14 | 10 | 11 | 12 | 14 | 16 | 16 | 17 | 14 | 19 | 7.7 | 5.6 | 8.8 | 8.8 | 18 |
| so2 | - | 1.4 | 0.77 | 0.5 | 0.77 | 0.47 | - | 0.18 | 0.14 | 1.5 | 0.66 | 1.6 | 1.4 | 0.41 | 0.88 | 0.5 | 0.09 | 1.2 | 0.47 | 0.24 | 0.5 | 0.48 | 0.53 | 2.2 | 3 | 2.1 | 1.9 | 1.2 | 0.28 | 2.1 | 1.1 | 1 |
| no2 | 3.6 | 4.7 | 4.8 | 3.8 | 4.8 | 1.9 | 3.8 | 1.5 | 0.96 | 2.8 | 3.9 | 3.3 | 4.2 | 2.6 | 7 | 5.2 | 6.6 | 8.4 | 5.5 | 6.9 | 5.6 | 5.6 | 4.4 | 2.6 | 2.9 | 5.2 | 8.4 | 5.2 | 6 | 6.1 | 3.7 | 4 |
| o3 | 47 | 60 | 52 | 63 | 41 | 49 | 8.4 | 11 | 18 | 69 | 55 | 53 | 59 | 58 | 44 | 51 | 41 | 24 | 33 | 35 | 52 | 51 | 52 | 53 | 58 | 56 | 50 | 45 | 43 | 34 | 42 | 28 |