Polusi udara di Altmarkkreis Salzwedel: indeks kualitas udara real-time dan siaga asap.
Perkiraan kualitas polusi dan udara untuk Altmarkkreis Salzwedel. Hari ini Minggu, 21 Juni 2026. Nilai polusi udara berikut telah tercatat untuk Altmarkkreis Salzwedel:- sulfur dioksida (SO2) - 0 (Bagus)
- nitrogen dioksida (NO2) - 9 (Bagus)
- partikulat Matter (PM 2.5) debu - 10 (Bagus)
- ozon (O3) - 42 (Bagus)
- partikulat Matter (PM10) debu tersuspensi - 11 (Bagus)

Apa kualitas udara di Altmarkkreis Salzwedel hari ini? Apakah udara tercemar di Altmarkkreis Salzwedel?. Apakah ada Smog?
Apa tingkat polusi SO2? (sulfur dioksida (SO2))
0 (Bagus)
Seberapa tinggi tingkat NO2? (nitrogen dioksida (NO2))
9 (Bagus)
Apa tingkat saat PM 2,5 in Altmarkkreis Salzwedel? (partikulat Matter (PM 2.5) debu)
Hari ini PM 2.5 tingkat:
10 (Bagus)
Sebagai perbandingan, tingkat tertinggi PM 2,5 in Altmarkkreis Salzwedel dalam 7 hari terakhir adalah: 18 (Rabu, 10 Januari 2024) dan Terendah: 2 (Senin, 15 Januari 2024).
Nilai tertinggi PM 2.5 direkam: 16 (Februari 2019).
Tingkat terendah dari partikulat Matter PM 2.5 polusi terjadi di bulan: Februari (3.9).
Bagaimana tingkat O3 hari ini di Altmarkkreis Salzwedel? (ozon (O3))
42 (Bagus)
Apa tingkat PM10 hari ini di Altmarkkreis Salzwedel? (partikulat Matter (PM10) debu tersuspensi)
Level saat ini dari partikulat Matter PM10 di Altmarkkreis Salzwedel adalah:
11 (Bagus)
Nilai PM10 tertinggi biasanya terjadi di bulan: 24 (September 2017).
Nilai terendah dari partikulat PM10 pencemaran Altmarkkreis Salzwedel biasanya dicatat di: Desember (4.3).
Data saat ini Rabu, 17 Januari 2024 09.00
1 (Bagus)
SO2 0 (Bagus)
NO2 9 (Bagus)
PM2,5 10 (Bagus)
O3 42 (Bagus)
PM10 11 (Bagus)
Data tentang polusi udara dari beberapa hari terakhir di Altmarkkreis Salzwedel
index
2024-01-10
2024-01-11
2024-01-12
2024-01-13
2024-01-14
2024-01-15
2024-01-16
2024-01-17
o3
31
Good
31
Good
38
Good
55
Good
61
Good
67
Good
62
Good
47
Good
no
1
Good
1
Good
0
Good
0
Good
0
Good
0
Good
0
Good
0
Good
so2
2
Good
2
Good
0
Good
0
Good
0
Good
0
Good
0
Good
0
Good
pm10
20
Moderate
21
Moderate
11
Good
3
Good
5
Good
3
Good
6
Good
9
Good
no2
9
Good
10
Good
7
Good
3
Good
3
Good
2
Good
5
Good
7
Good
pm25
18
Moderate
14
Moderate
10
Good
3
Good
4
Good
2
Good
4
Good
7
Good
data source »
Polusi udara di Altmarkkreis Salzwedel dari Mei 2019 ke Maret 2020
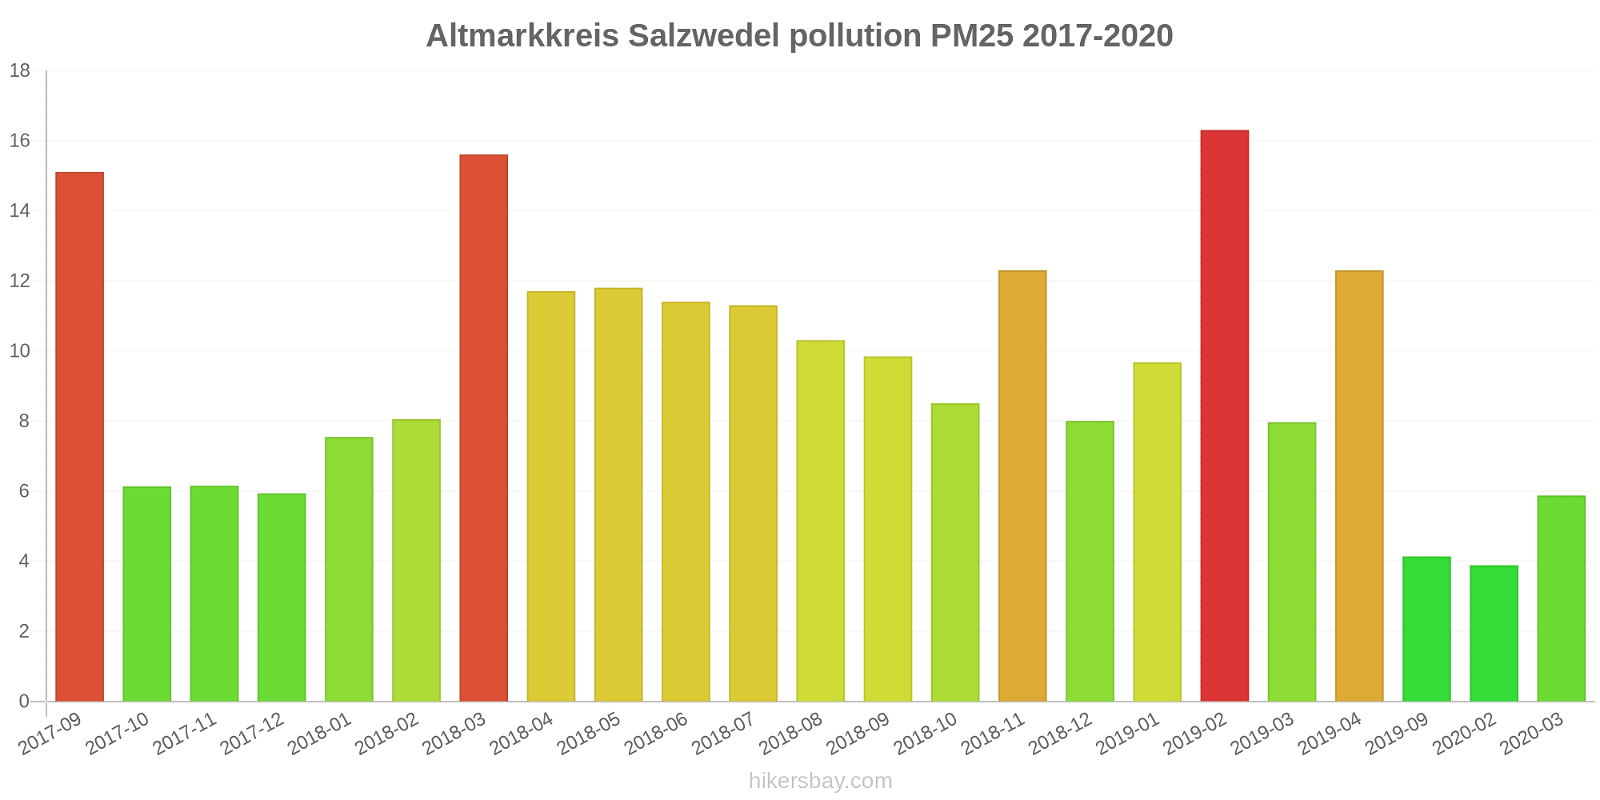
index
2020-03
2020-02
2019-09
2019-04
2019-03
2019-02
2019-01
2018-12
2018-11
2018-10
2018-09
2018-08
2018-07
2018-06
2018-05
2018-04
2018-03
2018-02
2018-01
2017-12
2017-11
2017-10
2017-09
2020-05
2020-04
2020-01
2019-12
2019-11
2019-10
2019-07
2019-06
2019-05
o3
48 (Good)
54 (Good)
15 (Good)
66 (Good)
50 (Good)
31 (Good)
39 (Good)
32 (Good)
19 (Good)
32 (Good)
34 (Good)
49 (Good)
51 (Good)
55 (Good)
55 (Good)
51 (Good)
48 (Good)
44 (Good)
38 (Good)
36 (Good)
28 (Good)
33 (Good)
26 (Good)
47 (Good)
64 (Good)
25 (Good)
16 (Good)
3.6 (Good)
5.9 (Good)
53 (Good)
47 (Good)
51 (Good)
so2
0.58 (Good)
1.1 (Good)
0.3 (Good)
0.82 (Good)
0.46 (Good)
1.8 (Good)
1.3 (Good)
0.83 (Good)
1.3 (Good)
1.5 (Good)
1.4 (Good)
1.4 (Good)
1.5 (Good)
1.1 (Good)
1.4 (Good)
1.3 (Good)
1.2 (Good)
0.78 (Good)
0.99 (Good)
0.38 (Good)
1.4 (Good)
1.2 (Good)
1 (Good)
1.8 (Good)
1.2 (Good)
1.3 (Good)
0.57 (Good)
0.31 (Good)
0.27 (Good)
0.72 (Good)
0.38 (Good)
0.89 (Good)
pm25
5.9 (Good)
3.9 (Good)
4.1 (Good)
12 (Good)
8 (Good)
16 (Moderate)
9.7 (Good)
8 (Good)
12 (Good)
8.5 (Good)
9.8 (Good)
10 (Good)
11 (Good)
11 (Good)
12 (Good)
12 (Good)
16 (Moderate)
8.1 (Good)
7.5 (Good)
5.9 (Good)
6.2 (Good)
6.1 (Good)
15 (Moderate)
- (Good)
- (Good)
- (Good)
- (Good)
- (Good)
- (Good)
- (Good)
- (Good)
- (Good)
pm10
9.9 (Good)
7.3 (Good)
5.6 (Good)
16 (Good)
15 (Good)
22 (Moderate)
16 (Good)
12 (Good)
20 (Good)
15 (Good)
16 (Good)
14 (Good)
15 (Good)
16 (Good)
18 (Good)
19 (Good)
17 (Good)
15 (Good)
11 (Good)
8.7 (Good)
10 (Good)
12 (Good)
24 (Moderate)
6 (Good)
11 (Good)
10 (Good)
4.3 (Good)
8.8 (Good)
5.5 (Good)
11 (Good)
12 (Good)
12 (Good)
no2
5.6 (Good)
4.6 (Good)
2.5 (Good)
4.6 (Good)
5.3 (Good)
14 (Good)
8.9 (Good)
10 (Good)
12 (Good)
9.6 (Good)
10 (Good)
8.8 (Good)
7.5 (Good)
6 (Good)
5.2 (Good)
5.3 (Good)
4.8 (Good)
6.9 (Good)
7.4 (Good)
8 (Good)
7.6 (Good)
6.6 (Good)
6.2 (Good)
4.1 (Good)
4.1 (Good)
12 (Good)
5.2 (Good)
7.5 (Good)
2.6 (Good)
3.1 (Good)
5.9 (Good)
3.6 (Good)
data source »
Waldhof
Rabu, 17 Januari 2024 09.00
0.96 (Bagus)
index_name_no
SO2 0.34 (Bagus)
sulfur dioksida (SO2)
NO2 8 (Bagus)
nitrogen dioksida (NO2)
PM2,5 7.2 (Bagus)
partikulat Matter (PM 2.5) debu
O3 48 (Bagus)
ozon (O3)
PM10 9.2 (Bagus)
partikulat Matter (PM10) debu tersuspensi
Zartau/Waldstation
Rabu, 17 Januari 2024 09.00
PM2,5 12 (Bagus)
partikulat Matter (PM 2.5) debu
SO2 0.23 (Bagus)
sulfur dioksida (SO2)
O3 36 (Bagus)
ozon (O3)
NO2 9.1 (Bagus)
nitrogen dioksida (NO2)
0.9 (Bagus)
index_name_no
PM10 13 (Bagus)
partikulat Matter (PM10) debu tersuspensi
Waldhof
index
2024-01-17
2024-01-16
2024-01-15
2024-01-14
2024-01-13
2024-01-12
2024-01-11
2024-01-10
o3
52
65
71
65
60
42
38
34
no
0.27
0.29
0.2
0.2
0.21
0.32
0.99
0.96
so2
0.62
0.23
0.14
0.16
0.22
0.34
5.3
3.7
pm10
8
4.5
1.1
4
1.8
6.6
22
17
no2
7.6
4.9
2.5
3.1
3.2
6.5
9.6
7.9
pm25
6.6
2.9
0.91
2.7
1.9
5.1
7.8
13
Zartau/Waldstation
index
2024-01-17
2024-01-16
2024-01-15
2024-01-14
2024-01-13
2024-01-12
2024-01-11
2024-01-10
so2
-0.33
-0.17
-0.34
-0.25
-0.28
-0.2
-0.46
0.75
no2
6.2
4.7
2.1
3.3
3.4
7.5
9.7
11
o3
42
59
62
56
50
34
24
27
pm25
7.8
5.3
3.6
4.6
4.8
14
21
22
pm10
9.1
7.1
4.8
5.8
5.2
15
21
24
no
0.29
0.25
0.12
0.16
0.14
0.27
0.52
0.82
DEUB005
2017-09 2020-03
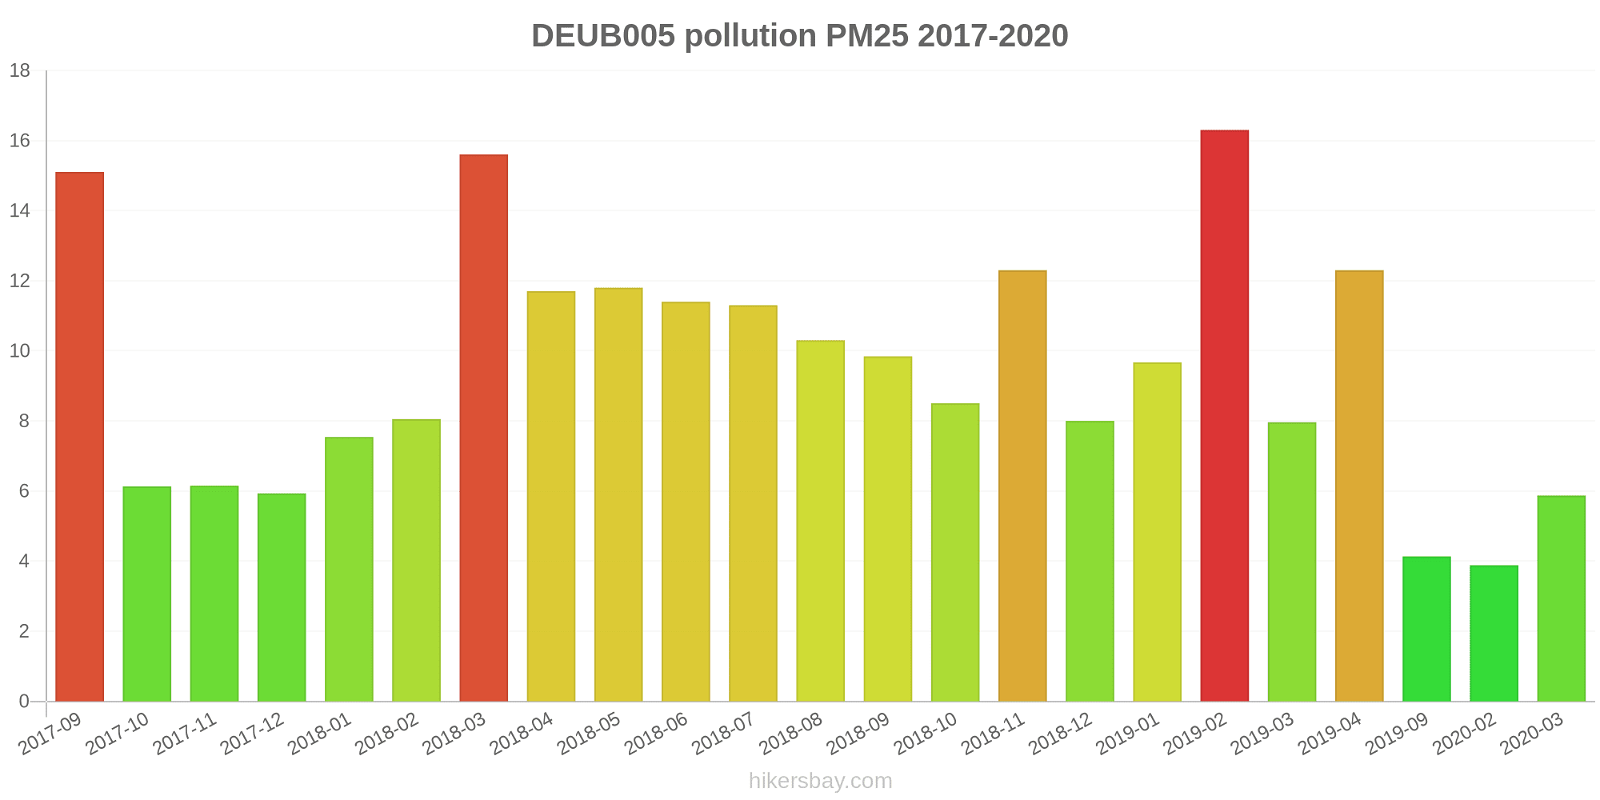
index
2020-03
2020-02
2019-09
2019-04
2019-03
2019-02
2019-01
2018-12
2018-11
2018-10
2018-09
2018-08
2018-07
2018-06
2018-05
2018-04
2018-03
2018-02
2018-01
2017-12
2017-11
2017-10
2017-09
pm25
5.9
3.9
4.1
12
8
16
9.7
8
12
8.5
9.8
10
11
11
12
12
16
8.1
7.5
5.9
6.2
6.1
15
pm10
10
7
8.2
17
15
23
17
12
20
14
15
15
16
18
20
19
17
10
11
8.7
9.2
11
21
so2
0.6
0.41
0.51
0.7
0.12
1.1
1.1
0.59
0.77
0.58
0.7
0.7
0.47
0.69
0.55
0.66
1.1
0.55
0.57
0.36
0.61
0.64
0.84
no2
5.7
4.2
2.8
5
5.8
15
9.4
10
12
10
9.6
9
7.9
6.9
5.8
6.2
5.2
5.8
6.7
7.7
9.8
6.9
5.6
o3
50
62
-
71
55
33
44
39
22
33
39
51
-
63
61
64
59
55
45
43
37
40
30
DEST089
index
2020-05
2020-04
2020-03
2020-02
2020-01
2019-12
2019-11
2019-10
2019-09
2019-07
2019-06
2019-05
2019-04
2019-03
2019-02
2019-01
2018-12
2018-11
2018-10
2018-09
2018-08
2018-07
2018-06
2018-05
2018-04
2018-03
2018-02
2018-01
2017-12
2017-11
2017-10
2017-09
pm10
6
11
9.7
7.6
10
4.3
8.8
5.5
3
11
12
12
16
15
21
15
11
19
16
16
13
13
14
17
19
17
20
11
8.8
12
13
26
so2
1.8
1.2
0.57
1.8
1.3
0.57
0.31
0.27
0.1
0.72
0.38
0.89
0.94
0.79
2.5
1.4
1.1
1.8
2.4
2
2
2.5
1.4
2.3
1.8
1.4
1
1.4
0.4
2.1
1.7
1.2
no2
4.1
4.1
5.5
4.9
12
5.2
7.5
2.6
2.2
3.1
5.9
3.6
4.2
4.8
14
8.4
10
12
9.3
11
8.7
7.1
5.1
4.5
4.4
4.5
8
8.1
8.3
5.5
6.3
6.7
o3
47
64
45
47
25
16
3.6
5.9
15
53
47
51
60
45
29
35
25
16
31
30
48
51
47
49
39
37
33
32
30
20
25
22
* Pollution data source:
https://openaq.org
(EEA Germany)
The data is licensed under CC-By 4.0
1 (Bagus)
SO2 0 (Bagus)
NO2 9 (Bagus)
PM2,5 10 (Bagus)
O3 42 (Bagus)
PM10 11 (Bagus)
Data tentang polusi udara dari beberapa hari terakhir di Altmarkkreis Salzwedel
| index | 2024-01-10 | 2024-01-11 | 2024-01-12 | 2024-01-13 | 2024-01-14 | 2024-01-15 | 2024-01-16 | 2024-01-17 |
|---|---|---|---|---|---|---|---|---|
| o3 | 31 Good |
31 Good |
38 Good |
55 Good |
61 Good |
67 Good |
62 Good |
47 Good |
| no | 1 Good |
1 Good |
0 Good |
0 Good |
0 Good |
0 Good |
0 Good |
0 Good |
| so2 | 2 Good |
2 Good |
0 Good |
0 Good |
0 Good |
0 Good |
0 Good |
0 Good |
| pm10 | 20 Moderate |
21 Moderate |
11 Good |
3 Good |
5 Good |
3 Good |
6 Good |
9 Good |
| no2 | 9 Good |
10 Good |
7 Good |
3 Good |
3 Good |
2 Good |
5 Good |
7 Good |
| pm25 | 18 Moderate |
14 Moderate |
10 Good |
3 Good |
4 Good |
2 Good |
4 Good |
7 Good |

| index | 2020-03 | 2020-02 | 2019-09 | 2019-04 | 2019-03 | 2019-02 | 2019-01 | 2018-12 | 2018-11 | 2018-10 | 2018-09 | 2018-08 | 2018-07 | 2018-06 | 2018-05 | 2018-04 | 2018-03 | 2018-02 | 2018-01 | 2017-12 | 2017-11 | 2017-10 | 2017-09 | 2020-05 | 2020-04 | 2020-01 | 2019-12 | 2019-11 | 2019-10 | 2019-07 | 2019-06 | 2019-05 |
|---|---|---|---|---|---|---|---|---|---|---|---|---|---|---|---|---|---|---|---|---|---|---|---|---|---|---|---|---|---|---|---|---|
| o3 | 48 (Good) | 54 (Good) | 15 (Good) | 66 (Good) | 50 (Good) | 31 (Good) | 39 (Good) | 32 (Good) | 19 (Good) | 32 (Good) | 34 (Good) | 49 (Good) | 51 (Good) | 55 (Good) | 55 (Good) | 51 (Good) | 48 (Good) | 44 (Good) | 38 (Good) | 36 (Good) | 28 (Good) | 33 (Good) | 26 (Good) | 47 (Good) | 64 (Good) | 25 (Good) | 16 (Good) | 3.6 (Good) | 5.9 (Good) | 53 (Good) | 47 (Good) | 51 (Good) |
| so2 | 0.58 (Good) | 1.1 (Good) | 0.3 (Good) | 0.82 (Good) | 0.46 (Good) | 1.8 (Good) | 1.3 (Good) | 0.83 (Good) | 1.3 (Good) | 1.5 (Good) | 1.4 (Good) | 1.4 (Good) | 1.5 (Good) | 1.1 (Good) | 1.4 (Good) | 1.3 (Good) | 1.2 (Good) | 0.78 (Good) | 0.99 (Good) | 0.38 (Good) | 1.4 (Good) | 1.2 (Good) | 1 (Good) | 1.8 (Good) | 1.2 (Good) | 1.3 (Good) | 0.57 (Good) | 0.31 (Good) | 0.27 (Good) | 0.72 (Good) | 0.38 (Good) | 0.89 (Good) |
| pm25 | 5.9 (Good) | 3.9 (Good) | 4.1 (Good) | 12 (Good) | 8 (Good) | 16 (Moderate) | 9.7 (Good) | 8 (Good) | 12 (Good) | 8.5 (Good) | 9.8 (Good) | 10 (Good) | 11 (Good) | 11 (Good) | 12 (Good) | 12 (Good) | 16 (Moderate) | 8.1 (Good) | 7.5 (Good) | 5.9 (Good) | 6.2 (Good) | 6.1 (Good) | 15 (Moderate) | - (Good) | - (Good) | - (Good) | - (Good) | - (Good) | - (Good) | - (Good) | - (Good) | - (Good) |
| pm10 | 9.9 (Good) | 7.3 (Good) | 5.6 (Good) | 16 (Good) | 15 (Good) | 22 (Moderate) | 16 (Good) | 12 (Good) | 20 (Good) | 15 (Good) | 16 (Good) | 14 (Good) | 15 (Good) | 16 (Good) | 18 (Good) | 19 (Good) | 17 (Good) | 15 (Good) | 11 (Good) | 8.7 (Good) | 10 (Good) | 12 (Good) | 24 (Moderate) | 6 (Good) | 11 (Good) | 10 (Good) | 4.3 (Good) | 8.8 (Good) | 5.5 (Good) | 11 (Good) | 12 (Good) | 12 (Good) |
| no2 | 5.6 (Good) | 4.6 (Good) | 2.5 (Good) | 4.6 (Good) | 5.3 (Good) | 14 (Good) | 8.9 (Good) | 10 (Good) | 12 (Good) | 9.6 (Good) | 10 (Good) | 8.8 (Good) | 7.5 (Good) | 6 (Good) | 5.2 (Good) | 5.3 (Good) | 4.8 (Good) | 6.9 (Good) | 7.4 (Good) | 8 (Good) | 7.6 (Good) | 6.6 (Good) | 6.2 (Good) | 4.1 (Good) | 4.1 (Good) | 12 (Good) | 5.2 (Good) | 7.5 (Good) | 2.6 (Good) | 3.1 (Good) | 5.9 (Good) | 3.6 (Good) |
0.96 (Bagus)
index_name_noSO2 0.34 (Bagus)
sulfur dioksida (SO2)NO2 8 (Bagus)
nitrogen dioksida (NO2)PM2,5 7.2 (Bagus)
partikulat Matter (PM 2.5) debuO3 48 (Bagus)
ozon (O3)PM10 9.2 (Bagus)
partikulat Matter (PM10) debu tersuspensiPM2,5 12 (Bagus)
partikulat Matter (PM 2.5) debuSO2 0.23 (Bagus)
sulfur dioksida (SO2)O3 36 (Bagus)
ozon (O3)NO2 9.1 (Bagus)
nitrogen dioksida (NO2)0.9 (Bagus)
index_name_noPM10 13 (Bagus)
partikulat Matter (PM10) debu tersuspensiWaldhof
| index | 2024-01-17 | 2024-01-16 | 2024-01-15 | 2024-01-14 | 2024-01-13 | 2024-01-12 | 2024-01-11 | 2024-01-10 |
|---|---|---|---|---|---|---|---|---|
| o3 | 52 | 65 | 71 | 65 | 60 | 42 | 38 | 34 |
| no | 0.27 | 0.29 | 0.2 | 0.2 | 0.21 | 0.32 | 0.99 | 0.96 |
| so2 | 0.62 | 0.23 | 0.14 | 0.16 | 0.22 | 0.34 | 5.3 | 3.7 |
| pm10 | 8 | 4.5 | 1.1 | 4 | 1.8 | 6.6 | 22 | 17 |
| no2 | 7.6 | 4.9 | 2.5 | 3.1 | 3.2 | 6.5 | 9.6 | 7.9 |
| pm25 | 6.6 | 2.9 | 0.91 | 2.7 | 1.9 | 5.1 | 7.8 | 13 |
Zartau/Waldstation
| index | 2024-01-17 | 2024-01-16 | 2024-01-15 | 2024-01-14 | 2024-01-13 | 2024-01-12 | 2024-01-11 | 2024-01-10 |
|---|---|---|---|---|---|---|---|---|
| so2 | -0.33 | -0.17 | -0.34 | -0.25 | -0.28 | -0.2 | -0.46 | 0.75 |
| no2 | 6.2 | 4.7 | 2.1 | 3.3 | 3.4 | 7.5 | 9.7 | 11 |
| o3 | 42 | 59 | 62 | 56 | 50 | 34 | 24 | 27 |
| pm25 | 7.8 | 5.3 | 3.6 | 4.6 | 4.8 | 14 | 21 | 22 |
| pm10 | 9.1 | 7.1 | 4.8 | 5.8 | 5.2 | 15 | 21 | 24 |
| no | 0.29 | 0.25 | 0.12 | 0.16 | 0.14 | 0.27 | 0.52 | 0.82 |
DEUB005

| index | 2020-03 | 2020-02 | 2019-09 | 2019-04 | 2019-03 | 2019-02 | 2019-01 | 2018-12 | 2018-11 | 2018-10 | 2018-09 | 2018-08 | 2018-07 | 2018-06 | 2018-05 | 2018-04 | 2018-03 | 2018-02 | 2018-01 | 2017-12 | 2017-11 | 2017-10 | 2017-09 |
|---|---|---|---|---|---|---|---|---|---|---|---|---|---|---|---|---|---|---|---|---|---|---|---|
| pm25 | 5.9 | 3.9 | 4.1 | 12 | 8 | 16 | 9.7 | 8 | 12 | 8.5 | 9.8 | 10 | 11 | 11 | 12 | 12 | 16 | 8.1 | 7.5 | 5.9 | 6.2 | 6.1 | 15 |
| pm10 | 10 | 7 | 8.2 | 17 | 15 | 23 | 17 | 12 | 20 | 14 | 15 | 15 | 16 | 18 | 20 | 19 | 17 | 10 | 11 | 8.7 | 9.2 | 11 | 21 |
| so2 | 0.6 | 0.41 | 0.51 | 0.7 | 0.12 | 1.1 | 1.1 | 0.59 | 0.77 | 0.58 | 0.7 | 0.7 | 0.47 | 0.69 | 0.55 | 0.66 | 1.1 | 0.55 | 0.57 | 0.36 | 0.61 | 0.64 | 0.84 |
| no2 | 5.7 | 4.2 | 2.8 | 5 | 5.8 | 15 | 9.4 | 10 | 12 | 10 | 9.6 | 9 | 7.9 | 6.9 | 5.8 | 6.2 | 5.2 | 5.8 | 6.7 | 7.7 | 9.8 | 6.9 | 5.6 |
| o3 | 50 | 62 | - | 71 | 55 | 33 | 44 | 39 | 22 | 33 | 39 | 51 | - | 63 | 61 | 64 | 59 | 55 | 45 | 43 | 37 | 40 | 30 |
DEST089
| index | 2020-05 | 2020-04 | 2020-03 | 2020-02 | 2020-01 | 2019-12 | 2019-11 | 2019-10 | 2019-09 | 2019-07 | 2019-06 | 2019-05 | 2019-04 | 2019-03 | 2019-02 | 2019-01 | 2018-12 | 2018-11 | 2018-10 | 2018-09 | 2018-08 | 2018-07 | 2018-06 | 2018-05 | 2018-04 | 2018-03 | 2018-02 | 2018-01 | 2017-12 | 2017-11 | 2017-10 | 2017-09 |
|---|---|---|---|---|---|---|---|---|---|---|---|---|---|---|---|---|---|---|---|---|---|---|---|---|---|---|---|---|---|---|---|---|
| pm10 | 6 | 11 | 9.7 | 7.6 | 10 | 4.3 | 8.8 | 5.5 | 3 | 11 | 12 | 12 | 16 | 15 | 21 | 15 | 11 | 19 | 16 | 16 | 13 | 13 | 14 | 17 | 19 | 17 | 20 | 11 | 8.8 | 12 | 13 | 26 |
| so2 | 1.8 | 1.2 | 0.57 | 1.8 | 1.3 | 0.57 | 0.31 | 0.27 | 0.1 | 0.72 | 0.38 | 0.89 | 0.94 | 0.79 | 2.5 | 1.4 | 1.1 | 1.8 | 2.4 | 2 | 2 | 2.5 | 1.4 | 2.3 | 1.8 | 1.4 | 1 | 1.4 | 0.4 | 2.1 | 1.7 | 1.2 |
| no2 | 4.1 | 4.1 | 5.5 | 4.9 | 12 | 5.2 | 7.5 | 2.6 | 2.2 | 3.1 | 5.9 | 3.6 | 4.2 | 4.8 | 14 | 8.4 | 10 | 12 | 9.3 | 11 | 8.7 | 7.1 | 5.1 | 4.5 | 4.4 | 4.5 | 8 | 8.1 | 8.3 | 5.5 | 6.3 | 6.7 |
| o3 | 47 | 64 | 45 | 47 | 25 | 16 | 3.6 | 5.9 | 15 | 53 | 47 | 51 | 60 | 45 | 29 | 35 | 25 | 16 | 31 | 30 | 48 | 51 | 47 | 49 | 39 | 37 | 33 | 32 | 30 | 20 | 25 | 22 |