Polusi udara di South Karelia: indeks kualitas udara real-time dan siaga asap.
Perkiraan kualitas polusi dan udara untuk South Karelia. Hari ini Kamis, 14 Mei 2026. Nilai polusi udara berikut telah tercatat untuk South Karelia:- sulfur dioksida (SO2) - 2 (Bagus)
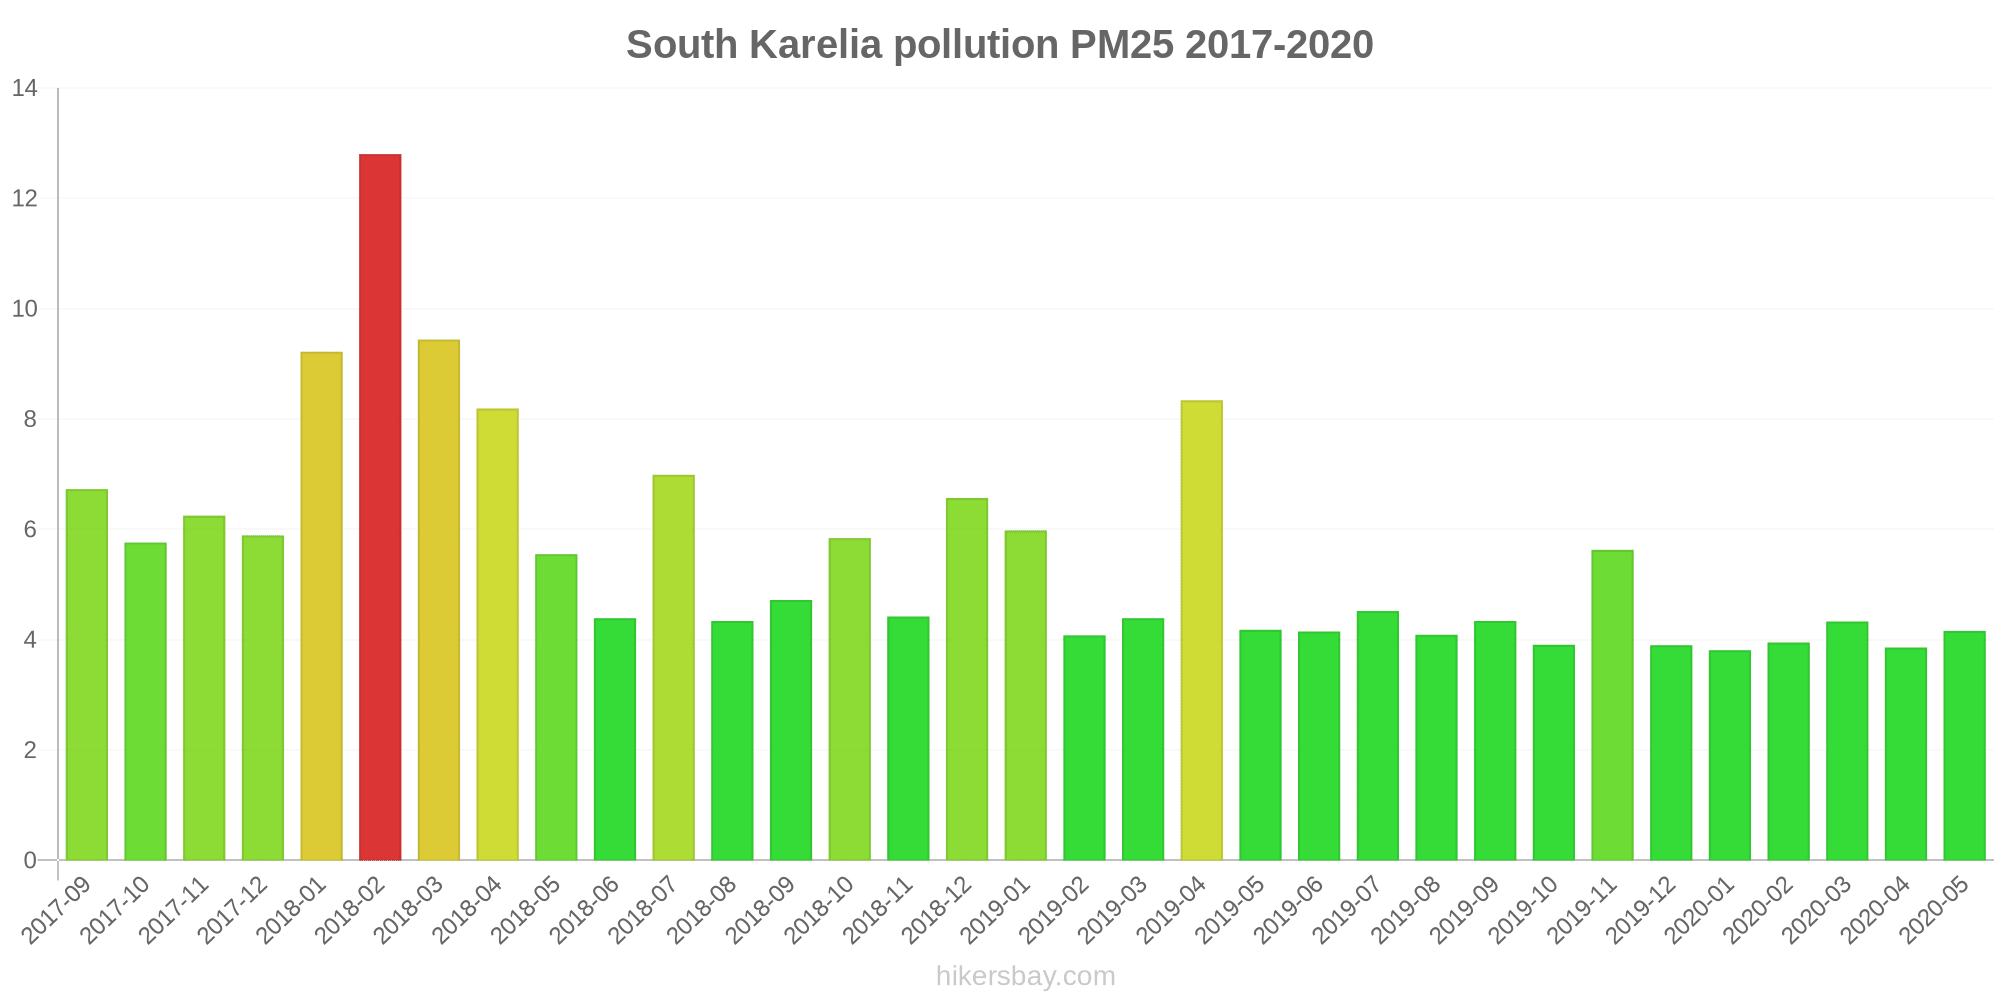
- partikulat Matter (PM 2.5) debu - 6 (Bagus)
- partikulat Matter (PM10) debu tersuspensi - 8 (Bagus)
- nitrogen dioksida (NO2) - 21 (Bagus)

Apa kualitas udara di South Karelia hari ini? Apakah udara tercemar di South Karelia?. Apakah ada Smog?
Apa tingkat polusi SO2? (sulfur dioksida (SO2))
2 (Bagus)
Apa tingkat saat PM 2,5 in South Karelia? (partikulat Matter (PM 2.5) debu)
Hari ini PM 2.5 tingkat:
6 (Bagus)
Sebagai perbandingan, tingkat tertinggi PM 2,5 in South Karelia dalam 7 hari terakhir adalah: 11 (Senin, 15 Januari 2024) dan Terendah: 1 (Rabu, 10 Januari 2024).
Nilai tertinggi PM 2.5 direkam: 13 (Februari 2018).
Tingkat terendah dari partikulat Matter PM 2.5 polusi terjadi di bulan: Januari (3.8).
Apa tingkat PM10 hari ini di South Karelia? (partikulat Matter (PM10) debu tersuspensi)
Level saat ini dari partikulat Matter PM10 di South Karelia adalah:
8 (Bagus)
Nilai PM10 tertinggi biasanya terjadi di bulan: 27 (April 2019).
Nilai terendah dari partikulat PM10 pencemaran South Karelia biasanya dicatat di: Desember (4.9).
Seberapa tinggi tingkat NO2? (nitrogen dioksida (NO2))
21 (Bagus)
Data saat ini Rabu, 17 Januari 2024 06.00
SO2 2 (Bagus)
PM2,5 6 (Bagus)
PM10 8 (Bagus)
NO2 21 (Bagus)
Data tentang polusi udara dari beberapa hari terakhir di South Karelia
index
2024-01-10
2024-01-11
2024-01-12
2024-01-13
2024-01-14
2024-01-15
2024-01-16
2024-01-17
2022-05-30
2022-12-28
2022-12-29
2022-12-30
2022-12-31
2023-01-01
2023-01-02
so2
1
Good
1
Good
1
Good
1
Good
2
Good
2
Good
2
Good
2
Good
-
Good
-
Good
-
Good
-
Good
-
Good
-
Good
-
Good
pm25
1
Good
4
Good
6
Good
3
Good
6
Good
11
Good
6
Good
4
Good
-
Good
-
Good
-
Good
-
Good
-
Good
-
Good
-
Good
pm10
2
Good
4
Good
6
Good
7
Good
8
Good
12
Good
7
Good
5
Good
8
Good
5
Good
6
Good
5
Good
5
Good
6
Good
7
Good
no2
7
Good
3
Good
16
Good
7
Good
7
Good
14
Good
7
Good
9
Good
6
Good
-
Good
-
Good
-
Good
-
Good
-
Good
-
Good
data source »
Polusi udara di South Karelia dari September 2017 ke Mei 2020

index
2020-05
2020-04
2020-03
2020-02
2020-01
2019-12
2019-11
2019-10
2019-09
2019-08
2019-07
2019-06
2019-05
2019-04
2019-03
2019-02
2019-01
2018-12
2018-11
2018-10
2018-09
2018-08
2018-07
2018-06
2018-05
2018-04
2018-03
2018-02
2018-01
2017-12
2017-11
2017-10
2017-09
no2
5 (Good)
4.8 (Good)
7.1 (Good)
6.8 (Good)
6.5 (Good)
6.8 (Good)
7.7 (Good)
6.6 (Good)
6 (Good)
4.7 (Good)
4.1 (Good)
5.2 (Good)
6.6 (Good)
11 (Good)
8.5 (Good)
9.6 (Good)
15 (Good)
11 (Good)
7.8 (Good)
7.8 (Good)
5.4 (Good)
6.4 (Good)
5.5 (Good)
5 (Good)
7.3 (Good)
11 (Good)
13 (Good)
13 (Good)
10 (Good)
11 (Good)
10 (Good)
8.3 (Good)
4.1 (Good)
pm10
10 (Good)
10 (Good)
14 (Good)
9.4 (Good)
7.2 (Good)
4.9 (Good)
11 (Good)
5.5 (Good)
7.2 (Good)
7.8 (Good)
7.5 (Good)
11 (Good)
9.9 (Good)
27 (Moderate)
8.8 (Good)
7.9 (Good)
7.5 (Good)
7.6 (Good)
10 (Good)
11 (Good)
9.7 (Good)
10 (Good)
12 (Good)
10 (Good)
17 (Good)
22 (Moderate)
11 (Good)
13 (Good)
7.9 (Good)
6.5 (Good)
7.5 (Good)
8.3 (Good)
9.9 (Good)
so2
1.4 (Good)
1.2 (Good)
1.1 (Good)
1.1 (Good)
0.99 (Good)
1.1 (Good)
1.1 (Good)
0.56 (Good)
0.58 (Good)
0.97 (Good)
0.7 (Good)
0.93 (Good)
0.27 (Good)
1.5 (Good)
0.94 (Good)
0.68 (Good)
1.3 (Good)
1.3 (Good)
1.1 (Good)
1.5 (Good)
0.65 (Good)
1.2 (Good)
0.77 (Good)
1.1 (Good)
1.2 (Good)
1.6 (Good)
2.1 (Good)
1.9 (Good)
2.6 (Good)
0.72 (Good)
1.1 (Good)
1.2 (Good)
1 (Good)
pm25
4.2 (Good)
3.9 (Good)
4.3 (Good)
4 (Good)
3.8 (Good)
3.9 (Good)
5.6 (Good)
3.9 (Good)
4.3 (Good)
4.1 (Good)
4.5 (Good)
4.2 (Good)
4.2 (Good)
8.3 (Good)
4.4 (Good)
4.1 (Good)
6 (Good)
6.6 (Good)
4.4 (Good)
5.8 (Good)
4.7 (Good)
4.3 (Good)
7 (Good)
4.4 (Good)
5.5 (Good)
8.2 (Good)
9.4 (Good)
13 (Good)
9.2 (Good)
5.9 (Good)
6.3 (Good)
5.8 (Good)
6.7 (Good)
data source »
Kualitas hidup di South Karelia
Hijau dan taman di kota
South Karelia
88%
Estonia: 82%
Kepulauan Åland: 75%
Swedia: 84%
Latvia: 88%
Lituania: 86%
partikulat Matter PM 2.5
South Karelia
7 (Good)
Kenikmatan menghabiskan waktu di kota
South Karelia
97%
Estonia: 90%
Kepulauan Åland: 92%
Swedia: 88%
Latvia: 82%
Lituania: 83%
partikulat Matter PM10
South Karelia
13 (Good)
Polusi udara
South Karelia
4,2%
Estonia: 12%
Kepulauan Åland: 17%
Swedia: 15%
Latvia: 29%
Lituania: 26%
Pembuangan sampah
South Karelia
83%
Estonia: 79%
Kepulauan Åland: 88%
Swedia: 83%
Latvia: 70%
Lituania: 71%
Ketersediaan dan kualitas air minum
South Karelia
100%
Estonia: 90%
Kepulauan Åland: 96%
Swedia: 92%
Latvia: 79%
Lituania: 91%
Kebersihan dan kerasnya
South Karelia
90%
Estonia: 82%
Kepulauan Åland: 83%
Swedia: 76%
Latvia: 72%
Lituania: 78%
Kebisingan dan polusi cahaya
South Karelia
17%
Estonia: 31%
Kepulauan Åland: 46%
Swedia: 26%
Latvia: 37%
Lituania: 30%
Polusi air
South Karelia
0%
Estonia: 16%
Kepulauan Åland: 10%
Swedia: 15%
Latvia: 28%
Lituania: 24%
Source: Numbeo
Rautionkylä
Rabu, 17 Januari 2024 06.00
SO2 2.1 (Bagus)
sulfur dioksida (SO2)
Tirilä Pekkasenkatu
Rabu, 17 Januari 2024 06.00
PM2,5 5.7 (Bagus)
partikulat Matter (PM 2.5) debu
Ihalainen
Senin, 30 Mei 2022 06.00
PM10 12 (Bagus)
partikulat Matter (PM10) debu tersuspensi
NO2 9.3 (Bagus)
nitrogen dioksida (NO2)
Lauritsala
Senin, 2 Januari 2023 09.00
PM10 11 (Bagus)
partikulat Matter (PM10) debu tersuspensi
Mansikkala
Rabu, 17 Januari 2024 06.00
PM10 11 (Bagus)
partikulat Matter (PM10) debu tersuspensi
NO2 26 (Bagus)
nitrogen dioksida (NO2)
Teppanala
Rabu, 17 Januari 2024 06.00
PM10 7.3 (Bagus)
partikulat Matter (PM10) debu tersuspensi
Joutsenon keskusta
Rabu, 17 Januari 2024 06.00
PM10 3.4 (Bagus)
partikulat Matter (PM10) debu tersuspensi
Lappeenrannan keskusta 4
Rabu, 17 Januari 2024 06.00
PM10 6.4 (Bagus)
partikulat Matter (PM10) debu tersuspensi
NO2 29 (Bagus)
nitrogen dioksida (NO2)
Rautionkylä
index
2024-01-17
2024-01-16
2024-01-15
2024-01-14
2024-01-13
2024-01-12
2024-01-11
2024-01-10
so2
1.8
1.9
1.6
2.2
1.4
0.99
1.2
1
Tirilä Pekkasenkatu
index
2024-01-17
2024-01-16
2024-01-15
2024-01-14
2024-01-13
2024-01-12
2024-01-11
2024-01-10
pm25
4.3
5.6
11
5.7
3.2
6.5
4
0.66
Ihalainen
index
2022-05-30
pm10
7.6
no2
6.2
Lauritsala
index
2023-01-02
2023-01-01
2022-12-31
2022-12-30
2022-12-29
2022-12-28
pm10
7.1
6
5
5.4
5.6
5.3
Mansikkala
index
2024-01-17
2024-01-16
2024-01-15
2024-01-14
2024-01-13
2024-01-12
2024-01-11
2024-01-10
pm10
7.2
8.1
13
8.9
7.4
7.3
5.6
2.5
no2
8
5.2
11
7
7.2
13
1.8
6.9
Teppanala
index
2024-01-17
2024-01-16
2024-01-15
2024-01-14
2024-01-13
2024-01-12
2024-01-11
2024-01-10
pm10
6.4
8.2
13
9.3
6.6
7.4
5.5
2.7
Joutsenon keskusta
index
2024-01-17
2024-01-16
2024-01-15
2024-01-14
2024-01-13
2024-01-12
2024-01-11
2024-01-10
pm10
3.2
4.4
10
5.8
8.3
3.6
2
1.1
Lappeenrannan keskusta 4
index
2024-01-17
2024-01-16
2024-01-15
2024-01-14
2024-01-13
2024-01-12
2024-01-11
2024-01-10
pm10
4.8
5.5
9.5
6.1
4.9
6.5
4.4
1.5
no2
9.1
8.3
16
7.9
6.9
19
3.8
7.5
FI00080
index
2020-05
2020-04
2020-03
2020-02
2020-01
2019-12
2019-11
2019-10
2019-09
2019-08
2019-07
2019-06
2019-05
2019-04
2019-03
2019-02
2019-01
2018-12
2018-11
2018-10
2018-09
2018-08
2018-07
2018-06
2018-05
2018-04
2018-03
2018-02
2018-01
2017-12
2017-11
2017-10
2017-09
pm10
9.1
8.4
13
7.5
7.3
5.7
12
6.5
7.2
8.7
8.2
9.9
8.9
19
8.2
8
8
8.4
8.3
9.7
8.9
10
12
9.6
15
18
9.4
11
7.3
6.3
7.2
7.5
8.9
so2
1.4
1.2
1.1
1.1
0.99
1.1
1.1
0.56
0.58
0.97
0.7
0.93
0.27
1.5
0.94
0.68
1.3
1.3
1.1
1.5
0.65
1.2
0.77
1.1
1.2
1.6
2.1
1.9
2.6
0.72
1.1
1.2
1
no2
4
4.5
6.2
5.7
6
6.4
6.9
5.5
5
4.2
3.4
4.1
5.3
8.2
6.8
7.4
11
7.9
5.8
5.7
3.8
4.5
3.6
4.3
5.7
7.8
11
11
8.2
8.7
8
5.4
3.6
FI00280
2017-09 2020-05

index
2020-05
2020-04
2020-03
2020-02
2020-01
2019-12
2019-11
2019-10
2019-09
2019-08
2019-07
2019-06
2019-05
2019-04
2019-03
2019-02
2019-01
2018-12
2018-11
2018-10
2018-09
2018-08
2018-07
2018-06
2018-05
2018-04
2018-03
2018-02
2018-01
2017-12
2017-11
2017-10
2017-09
pm25
4.2
3.9
4.3
4
3.8
3.9
5.6
3.9
4.3
4.1
4.5
4.2
4.2
8.3
4.4
4.1
6
6.6
4.4
5.8
4.7
4.3
7
4.4
5.5
8.2
9.4
13
9.2
5.9
6.3
5.8
6.7
FI00283
index
2020-05
2020-04
2020-03
2020-02
2020-01
2019-12
2019-11
2019-10
2019-09
2019-08
2019-07
2019-06
2019-05
2019-04
2019-03
2019-02
2019-01
2018-12
2018-11
2018-10
2018-09
2018-08
2018-07
2018-06
2018-05
2018-04
2018-03
2018-02
2018-01
2017-12
2017-11
2017-10
2017-09
pm10
12
13
15
12
6.4
5
11
6.8
9.4
9.8
8.6
12
12
33
9.5
9
7.6
6.7
11
14
9.7
13
15
13
21
26
14
13
8.8
8.3
8.7
11
12
FI00378
index
2020-05
2020-04
2020-03
2020-02
2020-01
2019-12
2019-11
2019-10
2019-09
2019-08
2019-07
2019-06
2019-05
2019-04
2019-03
2019-02
2019-01
2018-12
2018-11
2018-10
2018-09
2018-08
2018-07
2018-06
2018-05
2018-04
2018-03
2018-02
2018-01
2017-12
2017-11
2017-10
2017-09
pm10
9.4
9.9
16
11
6.8
5
15
6
7.9
8.1
7.5
8.5
8.2
28
7.5
6.4
6.5
7
9.4
9.9
8.7
9.2
11
11
15
20
8
10
7.3
6.8
7.8
9.7
11
FI00424
index
2020-05
2020-04
2020-03
2020-02
2020-01
2019-12
2019-11
2019-10
2019-09
2019-08
2019-07
2019-06
2019-05
2019-04
2019-03
2019-02
2019-01
2018-12
2018-11
2018-10
2018-09
2018-08
2018-07
2018-06
2018-05
2018-04
2018-03
2018-02
2018-01
2017-12
2017-11
2017-10
2017-09
pm10
12
9.8
19
7.3
8.2
4.3
9.5
4
5.3
5.9
5.5
12
11
31
10
7.9
8
9
11
12
10
11
13
10
20
25
12
13
7.1
4.2
5.4
6.5
6.8
no2
5.7
4.8
7.2
7.3
7.3
6
6.6
5
4.5
3.6
3
5.3
6.9
13
9.1
11
17
12
7.8
8.1
4.8
6.6
5.3
4.8
7.6
11
13
13
9.1
9.6
8.1
7.3
4.7
FI00433
index
2020-05
2020-04
2020-03
2020-02
2020-01
2019-12
2019-11
2019-10
2019-09
2019-08
2019-07
2019-06
2019-05
2019-04
2019-03
2019-02
2019-01
2018-12
2018-11
2018-10
2018-09
2018-08
2018-07
2018-06
2018-05
2018-04
2018-03
2018-02
2018-01
2017-12
2017-11
2017-10
2017-09
pm10
8.7
7.8
13
6.8
8.1
4.3
6.4
3.7
5.1
6
5.3
13
9.1
18
8.1
7.9
7.8
8.6
9.3
10
11
11
7.9
10
17
18
16
20
11
6.8
8.2
7.2
11
FI00434
index
2020-05
2020-04
2020-03
2020-02
2020-01
2019-12
2019-11
2019-10
2019-09
2019-08
2019-07
2019-06
2019-05
2019-04
2019-03
2019-02
2019-01
2018-12
2018-11
2018-10
2018-09
2018-08
2018-07
2018-06
2018-05
2018-04
2018-03
2018-02
2018-01
2017-12
2017-11
2017-10
2017-09
pm10
10
11
13
8.4
5
4
9.8
4.9
8
8.1
8.7
9.8
8.9
30
8.2
5.9
6.9
6.9
8.4
9.5
8.8
9
13
8.6
17
25
10
12
6.1
4.2
6.9
6.6
8.9
FI00606
index
2020-05
2020-04
2020-03
2020-02
2020-01
2019-12
2019-11
2019-10
2019-09
2019-08
2019-07
2019-06
2019-05
2019-04
2019-03
2019-02
2019-01
2018-12
2018-11
2018-10
2018-09
2018-08
2018-07
2018-06
2018-05
2018-04
2018-03
2018-02
2018-01
2017-12
2017-11
2017-10
2017-09
pm10
9.6
11
13
13
8.2
6.1
15
6.8
7.2
8.3
8.5
11
12
32
9.9
10
7.4
6.5
13
11
11
9
9.6
8.9
15
19
8.4
10
7.8
8.6
8.5
10
11
no2
5.5
4.9
7.8
7.4
6.4
8
9.5
9.2
8.6
6.4
5.9
6.1
7.5
12
9.7
11
17
13
9.7
9.6
7.5
8.1
7.7
5.9
8.5
13
15
15
13
14
15
12
-
* Pollution data source:
https://openaq.org
(EEA Finland)
The data is licensed under CC-By 4.0
SO2 2 (Bagus)
PM2,5 6 (Bagus)
PM10 8 (Bagus)
NO2 21 (Bagus)
Data tentang polusi udara dari beberapa hari terakhir di South Karelia
| index | 2024-01-10 | 2024-01-11 | 2024-01-12 | 2024-01-13 | 2024-01-14 | 2024-01-15 | 2024-01-16 | 2024-01-17 | 2022-05-30 | 2022-12-28 | 2022-12-29 | 2022-12-30 | 2022-12-31 | 2023-01-01 | 2023-01-02 |
|---|---|---|---|---|---|---|---|---|---|---|---|---|---|---|---|
| so2 | 1 Good |
1 Good |
1 Good |
1 Good |
2 Good |
2 Good |
2 Good |
2 Good |
- Good |
- Good |
- Good |
- Good |
- Good |
- Good |
- Good |
| pm25 | 1 Good |
4 Good |
6 Good |
3 Good |
6 Good |
11 Good |
6 Good |
4 Good |
- Good |
- Good |
- Good |
- Good |
- Good |
- Good |
- Good |
| pm10 | 2 Good |
4 Good |
6 Good |
7 Good |
8 Good |
12 Good |
7 Good |
5 Good |
8 Good |
5 Good |
6 Good |
5 Good |
5 Good |
6 Good |
7 Good |
| no2 | 7 Good |
3 Good |
16 Good |
7 Good |
7 Good |
14 Good |
7 Good |
9 Good |
6 Good |
- Good |
- Good |
- Good |
- Good |
- Good |
- Good |
| index | 2020-05 | 2020-04 | 2020-03 | 2020-02 | 2020-01 | 2019-12 | 2019-11 | 2019-10 | 2019-09 | 2019-08 | 2019-07 | 2019-06 | 2019-05 | 2019-04 | 2019-03 | 2019-02 | 2019-01 | 2018-12 | 2018-11 | 2018-10 | 2018-09 | 2018-08 | 2018-07 | 2018-06 | 2018-05 | 2018-04 | 2018-03 | 2018-02 | 2018-01 | 2017-12 | 2017-11 | 2017-10 | 2017-09 |
|---|---|---|---|---|---|---|---|---|---|---|---|---|---|---|---|---|---|---|---|---|---|---|---|---|---|---|---|---|---|---|---|---|---|
| no2 | 5 (Good) | 4.8 (Good) | 7.1 (Good) | 6.8 (Good) | 6.5 (Good) | 6.8 (Good) | 7.7 (Good) | 6.6 (Good) | 6 (Good) | 4.7 (Good) | 4.1 (Good) | 5.2 (Good) | 6.6 (Good) | 11 (Good) | 8.5 (Good) | 9.6 (Good) | 15 (Good) | 11 (Good) | 7.8 (Good) | 7.8 (Good) | 5.4 (Good) | 6.4 (Good) | 5.5 (Good) | 5 (Good) | 7.3 (Good) | 11 (Good) | 13 (Good) | 13 (Good) | 10 (Good) | 11 (Good) | 10 (Good) | 8.3 (Good) | 4.1 (Good) |
| pm10 | 10 (Good) | 10 (Good) | 14 (Good) | 9.4 (Good) | 7.2 (Good) | 4.9 (Good) | 11 (Good) | 5.5 (Good) | 7.2 (Good) | 7.8 (Good) | 7.5 (Good) | 11 (Good) | 9.9 (Good) | 27 (Moderate) | 8.8 (Good) | 7.9 (Good) | 7.5 (Good) | 7.6 (Good) | 10 (Good) | 11 (Good) | 9.7 (Good) | 10 (Good) | 12 (Good) | 10 (Good) | 17 (Good) | 22 (Moderate) | 11 (Good) | 13 (Good) | 7.9 (Good) | 6.5 (Good) | 7.5 (Good) | 8.3 (Good) | 9.9 (Good) |
| so2 | 1.4 (Good) | 1.2 (Good) | 1.1 (Good) | 1.1 (Good) | 0.99 (Good) | 1.1 (Good) | 1.1 (Good) | 0.56 (Good) | 0.58 (Good) | 0.97 (Good) | 0.7 (Good) | 0.93 (Good) | 0.27 (Good) | 1.5 (Good) | 0.94 (Good) | 0.68 (Good) | 1.3 (Good) | 1.3 (Good) | 1.1 (Good) | 1.5 (Good) | 0.65 (Good) | 1.2 (Good) | 0.77 (Good) | 1.1 (Good) | 1.2 (Good) | 1.6 (Good) | 2.1 (Good) | 1.9 (Good) | 2.6 (Good) | 0.72 (Good) | 1.1 (Good) | 1.2 (Good) | 1 (Good) |
| pm25 | 4.2 (Good) | 3.9 (Good) | 4.3 (Good) | 4 (Good) | 3.8 (Good) | 3.9 (Good) | 5.6 (Good) | 3.9 (Good) | 4.3 (Good) | 4.1 (Good) | 4.5 (Good) | 4.2 (Good) | 4.2 (Good) | 8.3 (Good) | 4.4 (Good) | 4.1 (Good) | 6 (Good) | 6.6 (Good) | 4.4 (Good) | 5.8 (Good) | 4.7 (Good) | 4.3 (Good) | 7 (Good) | 4.4 (Good) | 5.5 (Good) | 8.2 (Good) | 9.4 (Good) | 13 (Good) | 9.2 (Good) | 5.9 (Good) | 6.3 (Good) | 5.8 (Good) | 6.7 (Good) |
Hijau dan taman di kota
South Karelia 88%
Estonia: 82% Kepulauan Åland: 75% Swedia: 84% Latvia: 88% Lituania: 86%partikulat Matter PM 2.5
South Karelia 7 (Good)
Kenikmatan menghabiskan waktu di kota
South Karelia 97%
Estonia: 90% Kepulauan Åland: 92% Swedia: 88% Latvia: 82% Lituania: 83%partikulat Matter PM10
South Karelia 13 (Good)
Polusi udara
South Karelia 4,2%
Estonia: 12% Kepulauan Åland: 17% Swedia: 15% Latvia: 29% Lituania: 26%Pembuangan sampah
South Karelia 83%
Estonia: 79% Kepulauan Åland: 88% Swedia: 83% Latvia: 70% Lituania: 71%Ketersediaan dan kualitas air minum
South Karelia 100%
Estonia: 90% Kepulauan Åland: 96% Swedia: 92% Latvia: 79% Lituania: 91%Kebersihan dan kerasnya
South Karelia 90%
Estonia: 82% Kepulauan Åland: 83% Swedia: 76% Latvia: 72% Lituania: 78%Kebisingan dan polusi cahaya
South Karelia 17%
Estonia: 31% Kepulauan Åland: 46% Swedia: 26% Latvia: 37% Lituania: 30%Polusi air
South Karelia 0%
Estonia: 16% Kepulauan Åland: 10% Swedia: 15% Latvia: 28% Lituania: 24%SO2 2.1 (Bagus)
sulfur dioksida (SO2)PM2,5 5.7 (Bagus)
partikulat Matter (PM 2.5) debuPM10 12 (Bagus)
partikulat Matter (PM10) debu tersuspensiNO2 9.3 (Bagus)
nitrogen dioksida (NO2)PM10 11 (Bagus)
partikulat Matter (PM10) debu tersuspensiPM10 11 (Bagus)
partikulat Matter (PM10) debu tersuspensiNO2 26 (Bagus)
nitrogen dioksida (NO2)PM10 7.3 (Bagus)
partikulat Matter (PM10) debu tersuspensiPM10 3.4 (Bagus)
partikulat Matter (PM10) debu tersuspensiPM10 6.4 (Bagus)
partikulat Matter (PM10) debu tersuspensiNO2 29 (Bagus)
nitrogen dioksida (NO2)Rautionkylä
| index | 2024-01-17 | 2024-01-16 | 2024-01-15 | 2024-01-14 | 2024-01-13 | 2024-01-12 | 2024-01-11 | 2024-01-10 |
|---|---|---|---|---|---|---|---|---|
| so2 | 1.8 | 1.9 | 1.6 | 2.2 | 1.4 | 0.99 | 1.2 | 1 |
Tirilä Pekkasenkatu
| index | 2024-01-17 | 2024-01-16 | 2024-01-15 | 2024-01-14 | 2024-01-13 | 2024-01-12 | 2024-01-11 | 2024-01-10 |
|---|---|---|---|---|---|---|---|---|
| pm25 | 4.3 | 5.6 | 11 | 5.7 | 3.2 | 6.5 | 4 | 0.66 |
Ihalainen
| index | 2022-05-30 |
|---|---|
| pm10 | 7.6 |
| no2 | 6.2 |
Lauritsala
| index | 2023-01-02 | 2023-01-01 | 2022-12-31 | 2022-12-30 | 2022-12-29 | 2022-12-28 |
|---|---|---|---|---|---|---|
| pm10 | 7.1 | 6 | 5 | 5.4 | 5.6 | 5.3 |
Mansikkala
| index | 2024-01-17 | 2024-01-16 | 2024-01-15 | 2024-01-14 | 2024-01-13 | 2024-01-12 | 2024-01-11 | 2024-01-10 |
|---|---|---|---|---|---|---|---|---|
| pm10 | 7.2 | 8.1 | 13 | 8.9 | 7.4 | 7.3 | 5.6 | 2.5 |
| no2 | 8 | 5.2 | 11 | 7 | 7.2 | 13 | 1.8 | 6.9 |
Teppanala
| index | 2024-01-17 | 2024-01-16 | 2024-01-15 | 2024-01-14 | 2024-01-13 | 2024-01-12 | 2024-01-11 | 2024-01-10 |
|---|---|---|---|---|---|---|---|---|
| pm10 | 6.4 | 8.2 | 13 | 9.3 | 6.6 | 7.4 | 5.5 | 2.7 |
Joutsenon keskusta
| index | 2024-01-17 | 2024-01-16 | 2024-01-15 | 2024-01-14 | 2024-01-13 | 2024-01-12 | 2024-01-11 | 2024-01-10 |
|---|---|---|---|---|---|---|---|---|
| pm10 | 3.2 | 4.4 | 10 | 5.8 | 8.3 | 3.6 | 2 | 1.1 |
Lappeenrannan keskusta 4
| index | 2024-01-17 | 2024-01-16 | 2024-01-15 | 2024-01-14 | 2024-01-13 | 2024-01-12 | 2024-01-11 | 2024-01-10 |
|---|---|---|---|---|---|---|---|---|
| pm10 | 4.8 | 5.5 | 9.5 | 6.1 | 4.9 | 6.5 | 4.4 | 1.5 |
| no2 | 9.1 | 8.3 | 16 | 7.9 | 6.9 | 19 | 3.8 | 7.5 |
FI00080
| index | 2020-05 | 2020-04 | 2020-03 | 2020-02 | 2020-01 | 2019-12 | 2019-11 | 2019-10 | 2019-09 | 2019-08 | 2019-07 | 2019-06 | 2019-05 | 2019-04 | 2019-03 | 2019-02 | 2019-01 | 2018-12 | 2018-11 | 2018-10 | 2018-09 | 2018-08 | 2018-07 | 2018-06 | 2018-05 | 2018-04 | 2018-03 | 2018-02 | 2018-01 | 2017-12 | 2017-11 | 2017-10 | 2017-09 |
|---|---|---|---|---|---|---|---|---|---|---|---|---|---|---|---|---|---|---|---|---|---|---|---|---|---|---|---|---|---|---|---|---|---|
| pm10 | 9.1 | 8.4 | 13 | 7.5 | 7.3 | 5.7 | 12 | 6.5 | 7.2 | 8.7 | 8.2 | 9.9 | 8.9 | 19 | 8.2 | 8 | 8 | 8.4 | 8.3 | 9.7 | 8.9 | 10 | 12 | 9.6 | 15 | 18 | 9.4 | 11 | 7.3 | 6.3 | 7.2 | 7.5 | 8.9 |
| so2 | 1.4 | 1.2 | 1.1 | 1.1 | 0.99 | 1.1 | 1.1 | 0.56 | 0.58 | 0.97 | 0.7 | 0.93 | 0.27 | 1.5 | 0.94 | 0.68 | 1.3 | 1.3 | 1.1 | 1.5 | 0.65 | 1.2 | 0.77 | 1.1 | 1.2 | 1.6 | 2.1 | 1.9 | 2.6 | 0.72 | 1.1 | 1.2 | 1 |
| no2 | 4 | 4.5 | 6.2 | 5.7 | 6 | 6.4 | 6.9 | 5.5 | 5 | 4.2 | 3.4 | 4.1 | 5.3 | 8.2 | 6.8 | 7.4 | 11 | 7.9 | 5.8 | 5.7 | 3.8 | 4.5 | 3.6 | 4.3 | 5.7 | 7.8 | 11 | 11 | 8.2 | 8.7 | 8 | 5.4 | 3.6 |
FI00280

| index | 2020-05 | 2020-04 | 2020-03 | 2020-02 | 2020-01 | 2019-12 | 2019-11 | 2019-10 | 2019-09 | 2019-08 | 2019-07 | 2019-06 | 2019-05 | 2019-04 | 2019-03 | 2019-02 | 2019-01 | 2018-12 | 2018-11 | 2018-10 | 2018-09 | 2018-08 | 2018-07 | 2018-06 | 2018-05 | 2018-04 | 2018-03 | 2018-02 | 2018-01 | 2017-12 | 2017-11 | 2017-10 | 2017-09 |
|---|---|---|---|---|---|---|---|---|---|---|---|---|---|---|---|---|---|---|---|---|---|---|---|---|---|---|---|---|---|---|---|---|---|
| pm25 | 4.2 | 3.9 | 4.3 | 4 | 3.8 | 3.9 | 5.6 | 3.9 | 4.3 | 4.1 | 4.5 | 4.2 | 4.2 | 8.3 | 4.4 | 4.1 | 6 | 6.6 | 4.4 | 5.8 | 4.7 | 4.3 | 7 | 4.4 | 5.5 | 8.2 | 9.4 | 13 | 9.2 | 5.9 | 6.3 | 5.8 | 6.7 |
FI00283
| index | 2020-05 | 2020-04 | 2020-03 | 2020-02 | 2020-01 | 2019-12 | 2019-11 | 2019-10 | 2019-09 | 2019-08 | 2019-07 | 2019-06 | 2019-05 | 2019-04 | 2019-03 | 2019-02 | 2019-01 | 2018-12 | 2018-11 | 2018-10 | 2018-09 | 2018-08 | 2018-07 | 2018-06 | 2018-05 | 2018-04 | 2018-03 | 2018-02 | 2018-01 | 2017-12 | 2017-11 | 2017-10 | 2017-09 |
|---|---|---|---|---|---|---|---|---|---|---|---|---|---|---|---|---|---|---|---|---|---|---|---|---|---|---|---|---|---|---|---|---|---|
| pm10 | 12 | 13 | 15 | 12 | 6.4 | 5 | 11 | 6.8 | 9.4 | 9.8 | 8.6 | 12 | 12 | 33 | 9.5 | 9 | 7.6 | 6.7 | 11 | 14 | 9.7 | 13 | 15 | 13 | 21 | 26 | 14 | 13 | 8.8 | 8.3 | 8.7 | 11 | 12 |
FI00378
| index | 2020-05 | 2020-04 | 2020-03 | 2020-02 | 2020-01 | 2019-12 | 2019-11 | 2019-10 | 2019-09 | 2019-08 | 2019-07 | 2019-06 | 2019-05 | 2019-04 | 2019-03 | 2019-02 | 2019-01 | 2018-12 | 2018-11 | 2018-10 | 2018-09 | 2018-08 | 2018-07 | 2018-06 | 2018-05 | 2018-04 | 2018-03 | 2018-02 | 2018-01 | 2017-12 | 2017-11 | 2017-10 | 2017-09 |
|---|---|---|---|---|---|---|---|---|---|---|---|---|---|---|---|---|---|---|---|---|---|---|---|---|---|---|---|---|---|---|---|---|---|
| pm10 | 9.4 | 9.9 | 16 | 11 | 6.8 | 5 | 15 | 6 | 7.9 | 8.1 | 7.5 | 8.5 | 8.2 | 28 | 7.5 | 6.4 | 6.5 | 7 | 9.4 | 9.9 | 8.7 | 9.2 | 11 | 11 | 15 | 20 | 8 | 10 | 7.3 | 6.8 | 7.8 | 9.7 | 11 |
FI00424
| index | 2020-05 | 2020-04 | 2020-03 | 2020-02 | 2020-01 | 2019-12 | 2019-11 | 2019-10 | 2019-09 | 2019-08 | 2019-07 | 2019-06 | 2019-05 | 2019-04 | 2019-03 | 2019-02 | 2019-01 | 2018-12 | 2018-11 | 2018-10 | 2018-09 | 2018-08 | 2018-07 | 2018-06 | 2018-05 | 2018-04 | 2018-03 | 2018-02 | 2018-01 | 2017-12 | 2017-11 | 2017-10 | 2017-09 |
|---|---|---|---|---|---|---|---|---|---|---|---|---|---|---|---|---|---|---|---|---|---|---|---|---|---|---|---|---|---|---|---|---|---|
| pm10 | 12 | 9.8 | 19 | 7.3 | 8.2 | 4.3 | 9.5 | 4 | 5.3 | 5.9 | 5.5 | 12 | 11 | 31 | 10 | 7.9 | 8 | 9 | 11 | 12 | 10 | 11 | 13 | 10 | 20 | 25 | 12 | 13 | 7.1 | 4.2 | 5.4 | 6.5 | 6.8 |
| no2 | 5.7 | 4.8 | 7.2 | 7.3 | 7.3 | 6 | 6.6 | 5 | 4.5 | 3.6 | 3 | 5.3 | 6.9 | 13 | 9.1 | 11 | 17 | 12 | 7.8 | 8.1 | 4.8 | 6.6 | 5.3 | 4.8 | 7.6 | 11 | 13 | 13 | 9.1 | 9.6 | 8.1 | 7.3 | 4.7 |
FI00433
| index | 2020-05 | 2020-04 | 2020-03 | 2020-02 | 2020-01 | 2019-12 | 2019-11 | 2019-10 | 2019-09 | 2019-08 | 2019-07 | 2019-06 | 2019-05 | 2019-04 | 2019-03 | 2019-02 | 2019-01 | 2018-12 | 2018-11 | 2018-10 | 2018-09 | 2018-08 | 2018-07 | 2018-06 | 2018-05 | 2018-04 | 2018-03 | 2018-02 | 2018-01 | 2017-12 | 2017-11 | 2017-10 | 2017-09 |
|---|---|---|---|---|---|---|---|---|---|---|---|---|---|---|---|---|---|---|---|---|---|---|---|---|---|---|---|---|---|---|---|---|---|
| pm10 | 8.7 | 7.8 | 13 | 6.8 | 8.1 | 4.3 | 6.4 | 3.7 | 5.1 | 6 | 5.3 | 13 | 9.1 | 18 | 8.1 | 7.9 | 7.8 | 8.6 | 9.3 | 10 | 11 | 11 | 7.9 | 10 | 17 | 18 | 16 | 20 | 11 | 6.8 | 8.2 | 7.2 | 11 |
FI00434
| index | 2020-05 | 2020-04 | 2020-03 | 2020-02 | 2020-01 | 2019-12 | 2019-11 | 2019-10 | 2019-09 | 2019-08 | 2019-07 | 2019-06 | 2019-05 | 2019-04 | 2019-03 | 2019-02 | 2019-01 | 2018-12 | 2018-11 | 2018-10 | 2018-09 | 2018-08 | 2018-07 | 2018-06 | 2018-05 | 2018-04 | 2018-03 | 2018-02 | 2018-01 | 2017-12 | 2017-11 | 2017-10 | 2017-09 |
|---|---|---|---|---|---|---|---|---|---|---|---|---|---|---|---|---|---|---|---|---|---|---|---|---|---|---|---|---|---|---|---|---|---|
| pm10 | 10 | 11 | 13 | 8.4 | 5 | 4 | 9.8 | 4.9 | 8 | 8.1 | 8.7 | 9.8 | 8.9 | 30 | 8.2 | 5.9 | 6.9 | 6.9 | 8.4 | 9.5 | 8.8 | 9 | 13 | 8.6 | 17 | 25 | 10 | 12 | 6.1 | 4.2 | 6.9 | 6.6 | 8.9 |
FI00606
| index | 2020-05 | 2020-04 | 2020-03 | 2020-02 | 2020-01 | 2019-12 | 2019-11 | 2019-10 | 2019-09 | 2019-08 | 2019-07 | 2019-06 | 2019-05 | 2019-04 | 2019-03 | 2019-02 | 2019-01 | 2018-12 | 2018-11 | 2018-10 | 2018-09 | 2018-08 | 2018-07 | 2018-06 | 2018-05 | 2018-04 | 2018-03 | 2018-02 | 2018-01 | 2017-12 | 2017-11 | 2017-10 | 2017-09 |
|---|---|---|---|---|---|---|---|---|---|---|---|---|---|---|---|---|---|---|---|---|---|---|---|---|---|---|---|---|---|---|---|---|---|
| pm10 | 9.6 | 11 | 13 | 13 | 8.2 | 6.1 | 15 | 6.8 | 7.2 | 8.3 | 8.5 | 11 | 12 | 32 | 9.9 | 10 | 7.4 | 6.5 | 13 | 11 | 11 | 9 | 9.6 | 8.9 | 15 | 19 | 8.4 | 10 | 7.8 | 8.6 | 8.5 | 10 | 11 |
| no2 | 5.5 | 4.9 | 7.8 | 7.4 | 6.4 | 8 | 9.5 | 9.2 | 8.6 | 6.4 | 5.9 | 6.1 | 7.5 | 12 | 9.7 | 11 | 17 | 13 | 9.7 | 9.6 | 7.5 | 8.1 | 7.7 | 5.9 | 8.5 | 13 | 15 | 15 | 13 | 14 | 15 | 12 | - |