Polusi udara di Northern Savonia: indeks kualitas udara real-time dan siaga asap.
Perkiraan kualitas polusi dan udara untuk Northern Savonia. Hari ini Selasa, 16 Juni 2026. Nilai polusi udara berikut telah tercatat untuk Northern Savonia:- nitrogen dioksida (NO2) - 20 (Bagus)
- partikulat Matter (PM10) debu tersuspensi - 7 (Bagus)

Apa kualitas udara di Northern Savonia hari ini? Apakah udara tercemar di Northern Savonia?. Apakah ada Smog?
Seberapa tinggi tingkat NO2? (nitrogen dioksida (NO2))
20 (Bagus)
Apa tingkat PM10 hari ini di Northern Savonia? (partikulat Matter (PM10) debu tersuspensi)
Level saat ini dari partikulat Matter PM10 di Northern Savonia adalah:
7 (Bagus)
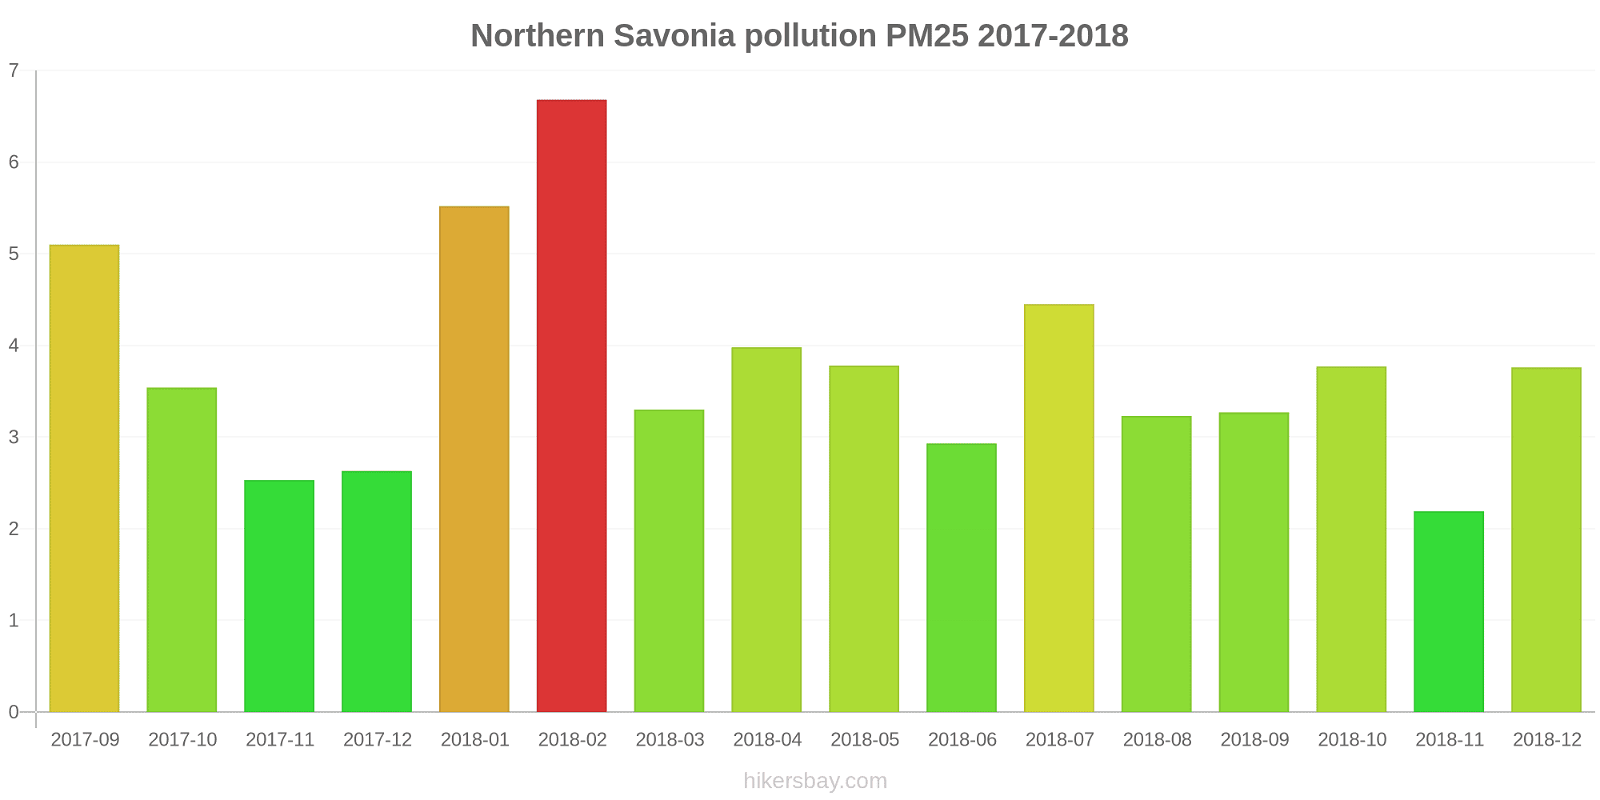
Nilai PM10 tertinggi biasanya terjadi di bulan: 35 (April 2019).
Nilai terendah dari partikulat PM10 pencemaran Northern Savonia biasanya dicatat di: Desember (5.1).
Data saat ini Rabu, 17 Januari 2024 06.00
NO2 20 (Bagus)
PM10 7 (Bagus)
Data tentang polusi udara dari beberapa hari terakhir di Northern Savonia
index
2024-01-10
2024-01-11
2024-01-12
2024-01-13
2024-01-14
2024-01-15
2024-01-16
2024-01-17
no2
14
Good
7
Good
27
Good
13
Good
16
Good
17
Good
12
Good
9
Good
pm10
2
Good
5
Good
13
Good
8
Good
4
Good
8
Good
8
Good
4
Good
data source »
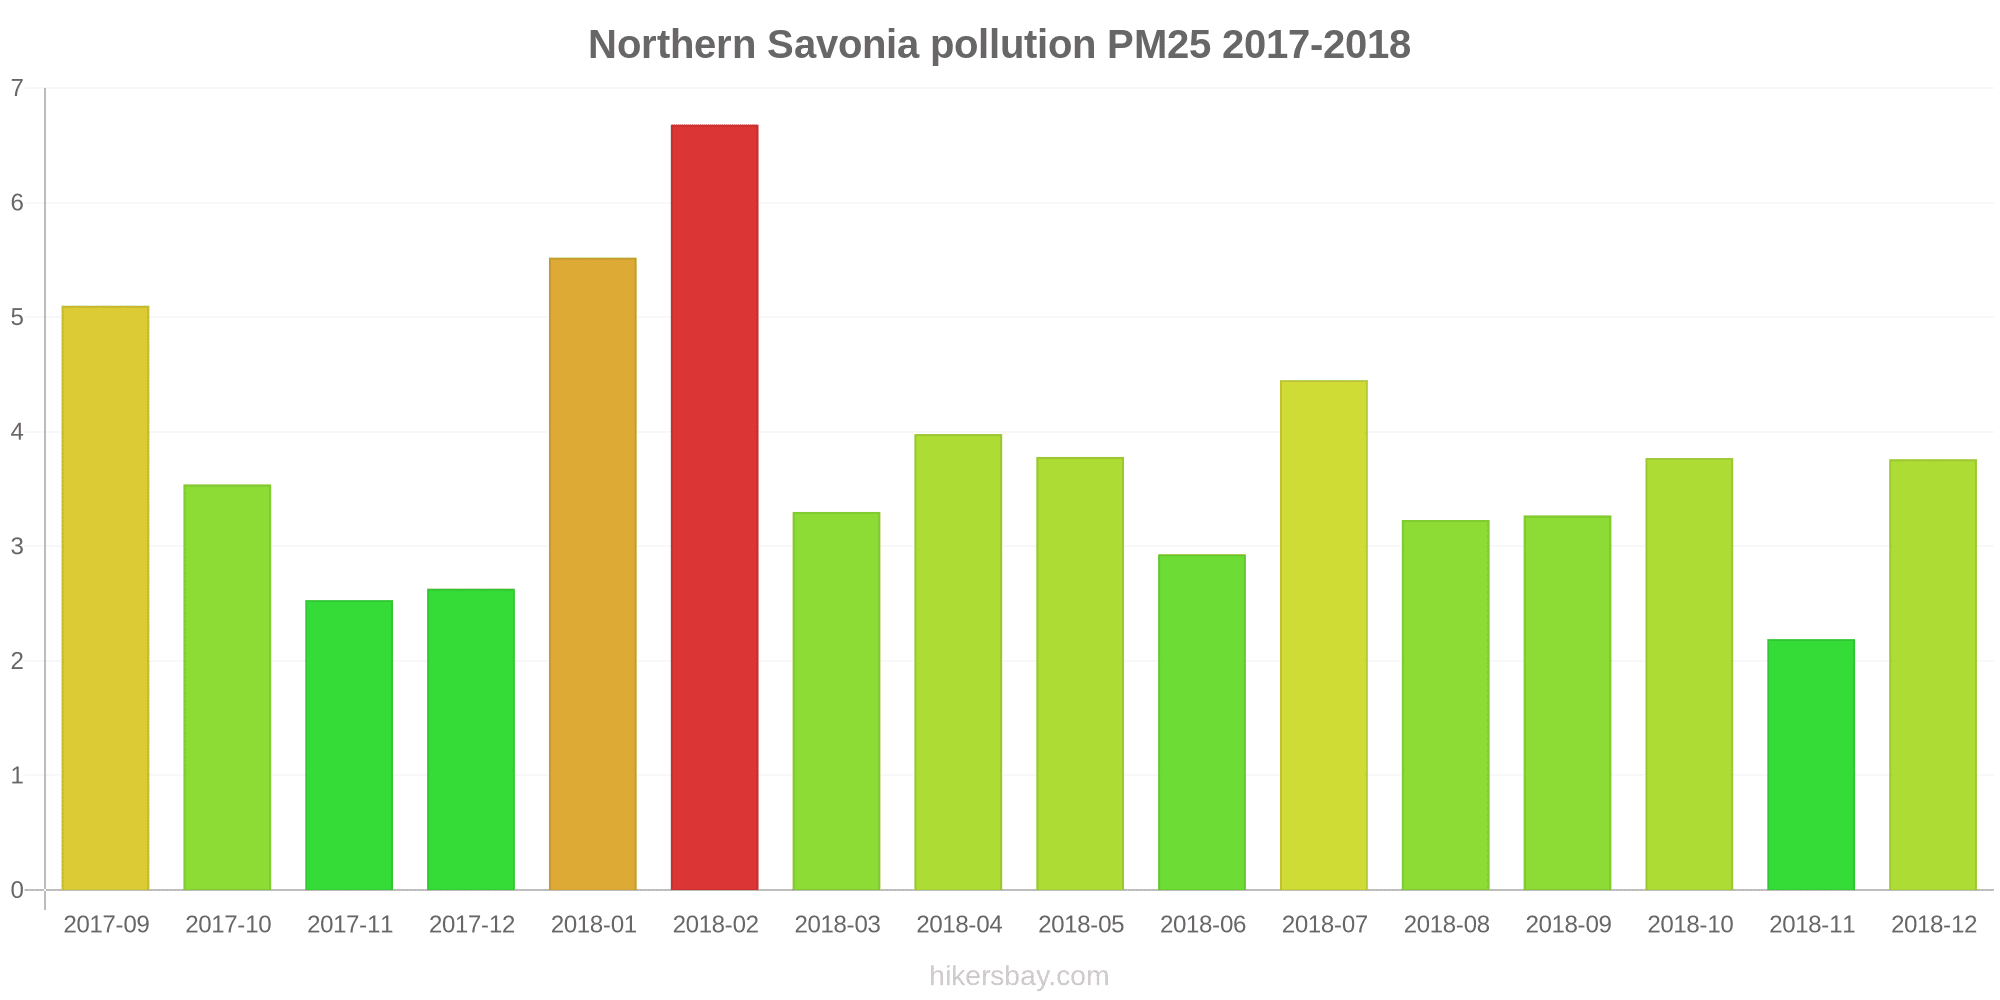
Polusi udara di Northern Savonia dari Januari 2019 ke Desember 2018
index
2018-12
2018-11
2018-10
2018-09
2018-08
2018-07
2018-06
2018-05
2018-04
2018-03
2018-02
2018-01
2017-12
2017-11
2017-10
2017-09
2020-05
2020-04
2020-03
2020-02
2020-01
2019-12
2019-11
2019-10
2019-09
2019-08
2019-07
2019-06
2019-05
2019-04
2019-03
2019-02
2019-01
pm25
3.8 (Good)
2.2 (Good)
3.8 (Good)
3.3 (Good)
3.2 (Good)
4.5 (Good)
2.9 (Good)
3.8 (Good)
4 (Good)
3.3 (Good)
6.7 (Good)
5.5 (Good)
2.6 (Good)
2.5 (Good)
3.5 (Good)
5.1 (Good)
- (Good)
- (Good)
- (Good)
- (Good)
- (Good)
- (Good)
- (Good)
- (Good)
- (Good)
- (Good)
- (Good)
- (Good)
- (Good)
- (Good)
- (Good)
- (Good)
- (Good)
pm10
8.5 (Good)
8.4 (Good)
12 (Good)
8.5 (Good)
9.9 (Good)
11 (Good)
10 (Good)
22 (Moderate)
30 (Moderate)
17 (Good)
17 (Good)
8.2 (Good)
6.1 (Good)
6.7 (Good)
9 (Good)
11 (Good)
14 (Good)
18 (Good)
22 (Moderate)
12 (Good)
8.3 (Good)
5.1 (Good)
18 (Good)
11 (Good)
9.4 (Good)
8.9 (Good)
6.9 (Good)
10 (Good)
12 (Good)
35 (Moderate)
13 (Good)
10 (Good)
11 (Good)
no2
13 (Good)
11 (Good)
13 (Good)
9.3 (Good)
10 (Good)
8.6 (Good)
8.2 (Good)
13 (Good)
21 (Good)
22 (Good)
20 (Good)
15 (Good)
13 (Good)
13 (Good)
13 (Good)
11 (Good)
8.9 (Good)
7.4 (Good)
13 (Good)
13 (Good)
11 (Good)
12 (Good)
12 (Good)
9.9 (Good)
9.1 (Good)
10 (Good)
7.3 (Good)
9.4 (Good)
11 (Good)
18 (Good)
14 (Good)
18 (Good)
23 (Good)
o3
42 (Good)
39 (Good)
41 (Good)
41 (Good)
54 (Good)
52 (Good)
60 (Good)
69 (Good)
69 (Good)
62 (Good)
49 (Good)
43 (Good)
45 (Good)
38 (Good)
34 (Good)
16 (Good)
- (Good)
- (Good)
- (Good)
- (Good)
- (Good)
- (Good)
- (Good)
- (Good)
- (Good)
- (Good)
- (Good)
- (Good)
- (Good)
- (Good)
- (Good)
- (Good)
- (Good)
data source »
Kualitas hidup di Northern Savonia
Hijau dan taman di kota
Northern Savonia
75%
Estonia: 82%
Kepulauan Åland: 75%
Swedia: 84%
Latvia: 88%
Lituania: 86%
partikulat Matter PM 2.5
Northern Savonia
5 (Good)
Kenikmatan menghabiskan waktu di kota
Northern Savonia
95%
Estonia: 90%
Kepulauan Åland: 92%
Swedia: 88%
Latvia: 82%
Lituania: 83%
partikulat Matter PM10
Northern Savonia
13 (Good)
Polusi udara
Northern Savonia
3,6%
Estonia: 12%
Kepulauan Åland: 17%
Swedia: 15%
Latvia: 29%
Lituania: 26%
Pembuangan sampah
Northern Savonia
75%
Estonia: 79%
Kepulauan Åland: 88%
Swedia: 83%
Latvia: 70%
Lituania: 71%
Ketersediaan dan kualitas air minum
Northern Savonia
100%
Estonia: 90%
Kepulauan Åland: 96%
Swedia: 92%
Latvia: 79%
Lituania: 91%
Kebersihan dan kerasnya
Northern Savonia
83%
Estonia: 82%
Kepulauan Åland: 83%
Swedia: 76%
Latvia: 72%
Lituania: 78%
Kebisingan dan polusi cahaya
Northern Savonia
42%
Estonia: 31%
Kepulauan Åland: 46%
Swedia: 26%
Latvia: 37%
Lituania: 30%
Polusi air
Northern Savonia
50%
Estonia: 16%
Kepulauan Åland: 10%
Swedia: 15%
Latvia: 28%
Lituania: 24%
Source: Numbeo
Maaherrankatu
Rabu, 17 Januari 2024 06.00
NO2 20 (Bagus)
nitrogen dioksida (NO2)
PM10 4.2 (Bagus)
partikulat Matter (PM10) debu tersuspensi
Tasavallankatu
Rabu, 17 Januari 2024 06.00
PM10 9.5 (Bagus)
partikulat Matter (PM10) debu tersuspensi
NO2 21 (Bagus)
nitrogen dioksida (NO2)
Maaherrankatu
index
2024-01-17
2024-01-16
2024-01-15
2024-01-14
2024-01-13
2024-01-12
2024-01-11
2024-01-10
no2
9.5
14
22
8.2
10
26
7
13
pm10
3.6
7.6
9.7
3.1
4.4
11
3.4
1.8
Tasavallankatu
index
2024-01-17
2024-01-16
2024-01-15
2024-01-14
2024-01-13
2024-01-12
2024-01-11
2024-01-10
pm10
5.1
9.1
7
4.8
11
14
5.8
1.3
no2
9.3
9.3
12
24
16
28
7.6
15
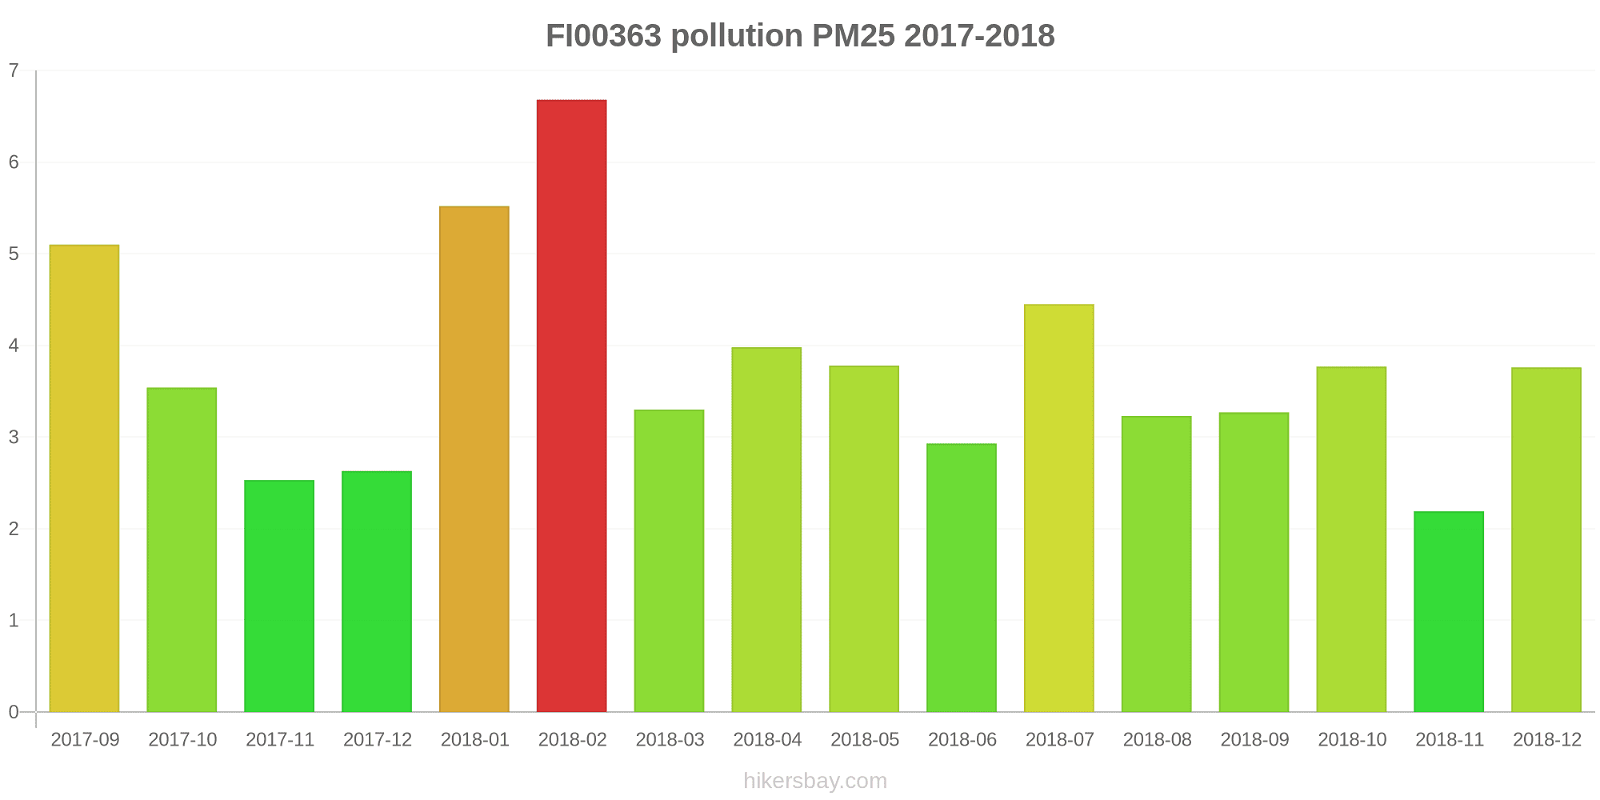
FI00363
2017-09 2018-12
index
2018-12
2018-11
2018-10
2018-09
2018-08
2018-07
2018-06
2018-05
2018-04
2018-03
2018-02
2018-01
2017-12
2017-11
2017-10
2017-09
pm25
3.8
2.2
3.8
3.3
3.2
4.5
2.9
3.8
4
3.3
6.7
5.5
2.6
2.5
3.5
5.1
pm10
6
6.8
9.6
8.4
8.7
9.5
9.1
17
20
12
13
7
6.5
5.5
8
10
no2
9.1
8.4
10
6.8
6.1
5.9
5.3
9.8
18
18
17
13
11
10
9.9
9.7
o3
42
39
41
41
54
52
60
69
69
62
49
43
45
38
34
16
FI00558
index
2020-05
2020-04
2020-03
2020-02
2020-01
2019-12
2019-11
2019-10
2019-09
2019-08
2019-07
2019-06
2019-05
2019-04
2019-03
2019-02
2019-01
2018-12
2018-11
2018-10
2018-09
2018-08
2018-07
2018-06
2018-05
2018-04
2018-03
2018-02
2018-01
2017-12
2017-11
2017-10
2017-09
pm10
11
16
22
11
9.8
4.7
18
6.5
5.7
7.1
4.9
7
9
27
9.3
8.5
8.8
7.8
7.5
11
6.7
8.6
8.8
9.2
19
28
12
16
7.3
5.6
6.5
8.6
10
no2
5
4.2
9.6
11
8.5
10
10
8.3
8.3
8.1
7
6.8
9.7
19
14
18
25
13
13
14
9.8
11
8.3
8.6
13
21
21
22
15
13
13
12
9.3
FI00839
index
2020-05
2020-04
2020-03
2020-02
2020-01
2019-12
2019-11
2019-10
2019-09
2019-08
2019-07
2019-06
2019-05
2019-04
2019-03
2019-02
2019-01
2018-12
2018-11
2018-10
2018-09
2018-08
2018-07
2018-06
2018-05
2018-04
2018-03
2018-02
2018-01
2017-12
2017-11
2017-10
2017-09
pm10
17
20
21
13
6.8
5.5
19
15
13
11
8.9
13
14
44
18
13
14
12
11
17
11
12
15
12
29
42
28
22
10
6.2
8.1
10
11
no2
13
11
16
16
14
14
13
12
9.8
12
7.5
12
12
16
14
17
21
16
13
14
11
13
12
11
16
23
25
20
17
17
15
16
14
* Pollution data source:
https://openaq.org
(EEA Finland)
The data is licensed under CC-By 4.0
NO2 20 (Bagus)
PM10 7 (Bagus)
Data tentang polusi udara dari beberapa hari terakhir di Northern Savonia
| index | 2024-01-10 | 2024-01-11 | 2024-01-12 | 2024-01-13 | 2024-01-14 | 2024-01-15 | 2024-01-16 | 2024-01-17 |
|---|---|---|---|---|---|---|---|---|
| no2 | 14 Good |
7 Good |
27 Good |
13 Good |
16 Good |
17 Good |
12 Good |
9 Good |
| pm10 | 2 Good |
5 Good |
13 Good |
8 Good |
4 Good |
8 Good |
8 Good |
4 Good |
| index | 2018-12 | 2018-11 | 2018-10 | 2018-09 | 2018-08 | 2018-07 | 2018-06 | 2018-05 | 2018-04 | 2018-03 | 2018-02 | 2018-01 | 2017-12 | 2017-11 | 2017-10 | 2017-09 | 2020-05 | 2020-04 | 2020-03 | 2020-02 | 2020-01 | 2019-12 | 2019-11 | 2019-10 | 2019-09 | 2019-08 | 2019-07 | 2019-06 | 2019-05 | 2019-04 | 2019-03 | 2019-02 | 2019-01 |
|---|---|---|---|---|---|---|---|---|---|---|---|---|---|---|---|---|---|---|---|---|---|---|---|---|---|---|---|---|---|---|---|---|---|
| pm25 | 3.8 (Good) | 2.2 (Good) | 3.8 (Good) | 3.3 (Good) | 3.2 (Good) | 4.5 (Good) | 2.9 (Good) | 3.8 (Good) | 4 (Good) | 3.3 (Good) | 6.7 (Good) | 5.5 (Good) | 2.6 (Good) | 2.5 (Good) | 3.5 (Good) | 5.1 (Good) | - (Good) | - (Good) | - (Good) | - (Good) | - (Good) | - (Good) | - (Good) | - (Good) | - (Good) | - (Good) | - (Good) | - (Good) | - (Good) | - (Good) | - (Good) | - (Good) | - (Good) |
| pm10 | 8.5 (Good) | 8.4 (Good) | 12 (Good) | 8.5 (Good) | 9.9 (Good) | 11 (Good) | 10 (Good) | 22 (Moderate) | 30 (Moderate) | 17 (Good) | 17 (Good) | 8.2 (Good) | 6.1 (Good) | 6.7 (Good) | 9 (Good) | 11 (Good) | 14 (Good) | 18 (Good) | 22 (Moderate) | 12 (Good) | 8.3 (Good) | 5.1 (Good) | 18 (Good) | 11 (Good) | 9.4 (Good) | 8.9 (Good) | 6.9 (Good) | 10 (Good) | 12 (Good) | 35 (Moderate) | 13 (Good) | 10 (Good) | 11 (Good) |
| no2 | 13 (Good) | 11 (Good) | 13 (Good) | 9.3 (Good) | 10 (Good) | 8.6 (Good) | 8.2 (Good) | 13 (Good) | 21 (Good) | 22 (Good) | 20 (Good) | 15 (Good) | 13 (Good) | 13 (Good) | 13 (Good) | 11 (Good) | 8.9 (Good) | 7.4 (Good) | 13 (Good) | 13 (Good) | 11 (Good) | 12 (Good) | 12 (Good) | 9.9 (Good) | 9.1 (Good) | 10 (Good) | 7.3 (Good) | 9.4 (Good) | 11 (Good) | 18 (Good) | 14 (Good) | 18 (Good) | 23 (Good) |
| o3 | 42 (Good) | 39 (Good) | 41 (Good) | 41 (Good) | 54 (Good) | 52 (Good) | 60 (Good) | 69 (Good) | 69 (Good) | 62 (Good) | 49 (Good) | 43 (Good) | 45 (Good) | 38 (Good) | 34 (Good) | 16 (Good) | - (Good) | - (Good) | - (Good) | - (Good) | - (Good) | - (Good) | - (Good) | - (Good) | - (Good) | - (Good) | - (Good) | - (Good) | - (Good) | - (Good) | - (Good) | - (Good) | - (Good) |
Hijau dan taman di kota
Northern Savonia 75%
Estonia: 82% Kepulauan Åland: 75% Swedia: 84% Latvia: 88% Lituania: 86%partikulat Matter PM 2.5
Northern Savonia 5 (Good)
Kenikmatan menghabiskan waktu di kota
Northern Savonia 95%
Estonia: 90% Kepulauan Åland: 92% Swedia: 88% Latvia: 82% Lituania: 83%partikulat Matter PM10
Northern Savonia 13 (Good)
Polusi udara
Northern Savonia 3,6%
Estonia: 12% Kepulauan Åland: 17% Swedia: 15% Latvia: 29% Lituania: 26%Pembuangan sampah
Northern Savonia 75%
Estonia: 79% Kepulauan Åland: 88% Swedia: 83% Latvia: 70% Lituania: 71%Ketersediaan dan kualitas air minum
Northern Savonia 100%
Estonia: 90% Kepulauan Åland: 96% Swedia: 92% Latvia: 79% Lituania: 91%Kebersihan dan kerasnya
Northern Savonia 83%
Estonia: 82% Kepulauan Åland: 83% Swedia: 76% Latvia: 72% Lituania: 78%Kebisingan dan polusi cahaya
Northern Savonia 42%
Estonia: 31% Kepulauan Åland: 46% Swedia: 26% Latvia: 37% Lituania: 30%Polusi air
Northern Savonia 50%
Estonia: 16% Kepulauan Åland: 10% Swedia: 15% Latvia: 28% Lituania: 24%NO2 20 (Bagus)
nitrogen dioksida (NO2)PM10 4.2 (Bagus)
partikulat Matter (PM10) debu tersuspensiPM10 9.5 (Bagus)
partikulat Matter (PM10) debu tersuspensiNO2 21 (Bagus)
nitrogen dioksida (NO2)Maaherrankatu
| index | 2024-01-17 | 2024-01-16 | 2024-01-15 | 2024-01-14 | 2024-01-13 | 2024-01-12 | 2024-01-11 | 2024-01-10 |
|---|---|---|---|---|---|---|---|---|
| no2 | 9.5 | 14 | 22 | 8.2 | 10 | 26 | 7 | 13 |
| pm10 | 3.6 | 7.6 | 9.7 | 3.1 | 4.4 | 11 | 3.4 | 1.8 |
Tasavallankatu
| index | 2024-01-17 | 2024-01-16 | 2024-01-15 | 2024-01-14 | 2024-01-13 | 2024-01-12 | 2024-01-11 | 2024-01-10 |
|---|---|---|---|---|---|---|---|---|
| pm10 | 5.1 | 9.1 | 7 | 4.8 | 11 | 14 | 5.8 | 1.3 |
| no2 | 9.3 | 9.3 | 12 | 24 | 16 | 28 | 7.6 | 15 |
FI00363

| index | 2018-12 | 2018-11 | 2018-10 | 2018-09 | 2018-08 | 2018-07 | 2018-06 | 2018-05 | 2018-04 | 2018-03 | 2018-02 | 2018-01 | 2017-12 | 2017-11 | 2017-10 | 2017-09 |
|---|---|---|---|---|---|---|---|---|---|---|---|---|---|---|---|---|
| pm25 | 3.8 | 2.2 | 3.8 | 3.3 | 3.2 | 4.5 | 2.9 | 3.8 | 4 | 3.3 | 6.7 | 5.5 | 2.6 | 2.5 | 3.5 | 5.1 |
| pm10 | 6 | 6.8 | 9.6 | 8.4 | 8.7 | 9.5 | 9.1 | 17 | 20 | 12 | 13 | 7 | 6.5 | 5.5 | 8 | 10 |
| no2 | 9.1 | 8.4 | 10 | 6.8 | 6.1 | 5.9 | 5.3 | 9.8 | 18 | 18 | 17 | 13 | 11 | 10 | 9.9 | 9.7 |
| o3 | 42 | 39 | 41 | 41 | 54 | 52 | 60 | 69 | 69 | 62 | 49 | 43 | 45 | 38 | 34 | 16 |
FI00558
| index | 2020-05 | 2020-04 | 2020-03 | 2020-02 | 2020-01 | 2019-12 | 2019-11 | 2019-10 | 2019-09 | 2019-08 | 2019-07 | 2019-06 | 2019-05 | 2019-04 | 2019-03 | 2019-02 | 2019-01 | 2018-12 | 2018-11 | 2018-10 | 2018-09 | 2018-08 | 2018-07 | 2018-06 | 2018-05 | 2018-04 | 2018-03 | 2018-02 | 2018-01 | 2017-12 | 2017-11 | 2017-10 | 2017-09 |
|---|---|---|---|---|---|---|---|---|---|---|---|---|---|---|---|---|---|---|---|---|---|---|---|---|---|---|---|---|---|---|---|---|---|
| pm10 | 11 | 16 | 22 | 11 | 9.8 | 4.7 | 18 | 6.5 | 5.7 | 7.1 | 4.9 | 7 | 9 | 27 | 9.3 | 8.5 | 8.8 | 7.8 | 7.5 | 11 | 6.7 | 8.6 | 8.8 | 9.2 | 19 | 28 | 12 | 16 | 7.3 | 5.6 | 6.5 | 8.6 | 10 |
| no2 | 5 | 4.2 | 9.6 | 11 | 8.5 | 10 | 10 | 8.3 | 8.3 | 8.1 | 7 | 6.8 | 9.7 | 19 | 14 | 18 | 25 | 13 | 13 | 14 | 9.8 | 11 | 8.3 | 8.6 | 13 | 21 | 21 | 22 | 15 | 13 | 13 | 12 | 9.3 |
FI00839
| index | 2020-05 | 2020-04 | 2020-03 | 2020-02 | 2020-01 | 2019-12 | 2019-11 | 2019-10 | 2019-09 | 2019-08 | 2019-07 | 2019-06 | 2019-05 | 2019-04 | 2019-03 | 2019-02 | 2019-01 | 2018-12 | 2018-11 | 2018-10 | 2018-09 | 2018-08 | 2018-07 | 2018-06 | 2018-05 | 2018-04 | 2018-03 | 2018-02 | 2018-01 | 2017-12 | 2017-11 | 2017-10 | 2017-09 |
|---|---|---|---|---|---|---|---|---|---|---|---|---|---|---|---|---|---|---|---|---|---|---|---|---|---|---|---|---|---|---|---|---|---|
| pm10 | 17 | 20 | 21 | 13 | 6.8 | 5.5 | 19 | 15 | 13 | 11 | 8.9 | 13 | 14 | 44 | 18 | 13 | 14 | 12 | 11 | 17 | 11 | 12 | 15 | 12 | 29 | 42 | 28 | 22 | 10 | 6.2 | 8.1 | 10 | 11 |
| no2 | 13 | 11 | 16 | 16 | 14 | 14 | 13 | 12 | 9.8 | 12 | 7.5 | 12 | 12 | 16 | 14 | 17 | 21 | 16 | 13 | 14 | 11 | 13 | 12 | 11 | 16 | 23 | 25 | 20 | 17 | 17 | 15 | 16 | 14 |