Polusi udara di Ostrobothnia: indeks kualitas udara real-time dan siaga asap.
Perkiraan kualitas polusi dan udara untuk Ostrobothnia. Hari ini Senin, 11 Mei 2026. Nilai polusi udara berikut telah tercatat untuk Ostrobothnia:- partikulat Matter (PM10) debu tersuspensi - 7 (Bagus)
- nitrogen dioksida (NO2) - 31 (Bagus)
- partikulat Matter (PM 2.5) debu - 2 (Bagus)

Apa kualitas udara di Ostrobothnia hari ini? Apakah udara tercemar di Ostrobothnia?. Apakah ada Smog?
Apa tingkat PM10 hari ini di Ostrobothnia? (partikulat Matter (PM10) debu tersuspensi)
Level saat ini dari partikulat Matter PM10 di Ostrobothnia adalah:
7 (Bagus)
Nilai PM10 tertinggi biasanya terjadi di bulan: 36 (April 2018).
Nilai terendah dari partikulat PM10 pencemaran Ostrobothnia biasanya dicatat di: Desember (4.5).
Seberapa tinggi tingkat NO2? (nitrogen dioksida (NO2))
31 (Bagus)
Apa tingkat saat PM 2,5 in Ostrobothnia? (partikulat Matter (PM 2.5) debu)
Hari ini PM 2.5 tingkat:
2 (Bagus)
Sebagai perbandingan, tingkat tertinggi PM 2,5 in Ostrobothnia dalam 7 hari terakhir adalah: 3 (Selasa, 16 Januari 2024) dan Terendah: 0 (Rabu, 10 Januari 2024).
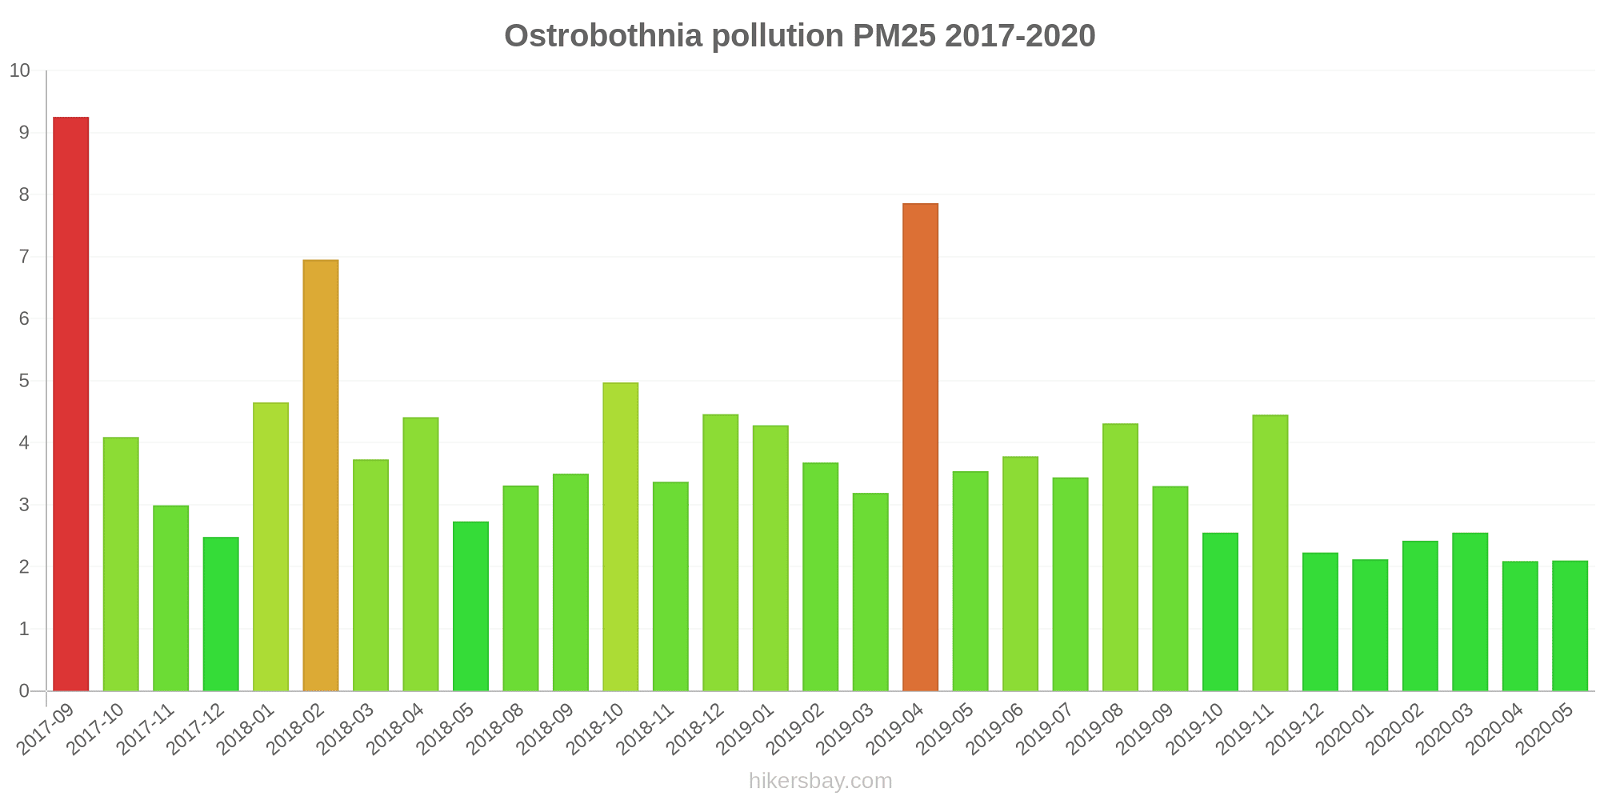
Nilai tertinggi PM 2.5 direkam: 9.3 (September 2017).
Tingkat terendah dari partikulat Matter PM 2.5 polusi terjadi di bulan: April (2.1).
Data saat ini Rabu, 17 Januari 2024 06.00
PM10 7 (Bagus)
NO2 31 (Bagus)
PM2,5 2 (Bagus)
Data tentang polusi udara dari beberapa hari terakhir di Ostrobothnia
index
2024-01-10
2024-01-11
2024-01-12
2024-01-13
2024-01-14
2024-01-15
2024-01-16
2024-01-17
pm10
1
Good
4
Good
3
Good
3
Good
2
Good
2
Good
12
Good
6
Good
no2
7
Good
19
Good
24
Good
8
Good
6
Good
10
Good
33
Good
15
Good
pm25
0
Good
1
Good
1
Good
1
Good
1
Good
1
Good
3
Good
2
Good
data source »
Polusi udara di Ostrobothnia dari September 2017 ke Mei 2020
index
2020-05
2020-04
2020-03
2020-02
2020-01
2019-12
2019-11
2019-10
2019-09
2019-08
2019-07
2019-06
2019-05
2019-04
2019-03
2019-02
2019-01
2018-12
2018-11
2018-10
2018-09
2018-08
2018-07
2018-06
2018-05
2018-04
2018-03
2018-02
2018-01
2017-12
2017-11
2017-10
2017-09
no2
5.3 (Good)
7 (Good)
14 (Good)
13 (Good)
10 (Good)
11 (Good)
14 (Good)
10 (Good)
9.3 (Good)
6.8 (Good)
5.3 (Good)
5.9 (Good)
7.2 (Good)
13 (Good)
17 (Good)
19 (Good)
23 (Good)
16 (Good)
14 (Good)
13 (Good)
10 (Good)
9.6 (Good)
8.7 (Good)
8.8 (Good)
12 (Good)
26 (Good)
39 (Good)
34 (Good)
27 (Good)
19 (Good)
15 (Good)
15 (Good)
13 (Good)
pm10
9 (Good)
14 (Good)
20 (Good)
24 (Moderate)
9.9 (Good)
4.5 (Good)
13 (Good)
9.4 (Good)
9.4 (Good)
9 (Good)
8.3 (Good)
9.4 (Good)
12 (Good)
35 (Moderate)
14 (Good)
8.3 (Good)
8.1 (Good)
7.7 (Good)
11 (Good)
14 (Good)
9 (Good)
8.9 (Good)
13 (Good)
9.8 (Good)
16 (Good)
36 (Moderate)
11 (Good)
15 (Good)
9 (Good)
9.8 (Good)
8.6 (Good)
15 (Good)
14 (Good)
pm25
2.1 (Good)
2.1 (Good)
2.5 (Good)
2.4 (Good)
2.1 (Good)
2.2 (Good)
4.5 (Good)
2.5 (Good)
3.3 (Good)
4.3 (Good)
3.4 (Good)
3.8 (Good)
3.5 (Good)
7.9 (Good)
3.2 (Good)
3.7 (Good)
4.3 (Good)
4.5 (Good)
3.4 (Good)
5 (Good)
3.5 (Good)
3.3 (Good)
- (Good)
- (Good)
2.7 (Good)
4.4 (Good)
3.7 (Good)
7 (Good)
4.7 (Good)
2.5 (Good)
3 (Good)
4.1 (Good)
9.3 (Good)
o3
- (Good)
- (Good)
- (Good)
- (Good)
- (Good)
- (Good)
- (Good)
- (Good)
- (Good)
- (Good)
- (Good)
- (Good)
18 (Good)
51 (Good)
55 (Good)
67 (Good)
50 (Good)
42 (Good)
41 (Good)
48 (Good)
51 (Good)
62 (Good)
56 (Good)
67 (Good)
80 (Moderate)
77 (Moderate)
70 (Moderate)
54 (Good)
44 (Good)
50 (Good)
44 (Good)
39 (Good)
19 (Good)
data source »
Kualitas hidup di Ostrobothnia
Hijau dan taman di kota
Ostrobothnia
75%
Estonia: 82%
Kepulauan Åland: 75%
Swedia: 84%
Latvia: 88%
Lituania: 86%
partikulat Matter PM 2.5
Ostrobothnia
4 (Good)
Kenikmatan menghabiskan waktu di kota
Ostrobothnia
92%
Estonia: 90%
Kepulauan Åland: 92%
Swedia: 88%
Latvia: 82%
Lituania: 83%
partikulat Matter PM10
Ostrobothnia
10 (Good)
Polusi udara
Ostrobothnia
6,8%
Estonia: 12%
Kepulauan Åland: 17%
Swedia: 15%
Latvia: 29%
Lituania: 26%
Pembuangan sampah
Ostrobothnia
88%
Estonia: 79%
Kepulauan Åland: 88%
Swedia: 83%
Latvia: 70%
Lituania: 71%
Ketersediaan dan kualitas air minum
Ostrobothnia
96%
Estonia: 90%
Kepulauan Åland: 96%
Swedia: 92%
Latvia: 79%
Lituania: 91%
Kebersihan dan kerasnya
Ostrobothnia
93%
Estonia: 82%
Kepulauan Åland: 83%
Swedia: 76%
Latvia: 72%
Lituania: 78%
Kebisingan dan polusi cahaya
Ostrobothnia
11%
Estonia: 31%
Kepulauan Åland: 46%
Swedia: 26%
Latvia: 37%
Lituania: 30%
Polusi air
Ostrobothnia
7,1%
Estonia: 16%
Kepulauan Åland: 10%
Swedia: 15%
Latvia: 28%
Lituania: 24%
Source: Numbeo
Bottenviksvägen
Rabu, 17 Januari 2024 06.00
PM10 12 (Bagus)
partikulat Matter (PM10) debu tersuspensi
NO2 27 (Bagus)
nitrogen dioksida (NO2)
Vaasan keskusta
Rabu, 17 Januari 2024 06.00
NO2 36 (Bagus)
nitrogen dioksida (NO2)
PM10 5.7 (Bagus)
partikulat Matter (PM10) debu tersuspensi
Vaasa vesitorni
Rabu, 17 Januari 2024 06.00
PM2,5 2.3 (Bagus)
partikulat Matter (PM 2.5) debu
PM10 2.9 (Bagus)
partikulat Matter (PM10) debu tersuspensi
Bottenviksvägen
index
2024-01-17
2024-01-16
2024-01-15
2024-01-14
2024-01-13
2024-01-12
2024-01-11
2024-01-10
pm10
8.2
23
2.6
2.6
3.5
5.9
6.4
1.1
no2
15
30
8
6.8
7.5
27
21
4.6
Vaasan keskusta
index
2024-01-17
2024-01-16
2024-01-15
2024-01-14
2024-01-13
2024-01-12
2024-01-11
2024-01-10
no2
16
36
13
6.1
8.2
21
17
8.4
pm10
7.7
9
4.1
2.8
2.4
2.9
3.7
1.8
Vaasa vesitorni
index
2024-01-17
2024-01-16
2024-01-15
2024-01-14
2024-01-13
2024-01-12
2024-01-11
2024-01-10
pm25
2.1
2.6
0.53
0.93
1
0.84
0.58
0.1
pm10
2.6
3.4
0.78
1.2
2.5
1.1
0.84
0.13
FI00397
index
2020-05
2020-04
2020-03
2020-02
2020-01
2019-12
2019-11
2019-10
2019-09
2019-08
2019-07
2019-06
2019-05
2019-04
2019-03
2019-02
2019-01
2018-12
2018-11
2018-10
2018-09
2018-08
2018-07
2018-06
2018-05
2018-04
2018-03
2018-02
2018-01
2017-12
2017-11
2017-10
2017-09
pm10
9
14
20
24
9.9
4.5
13
9.4
9.4
9
8.3
9.4
12
35
14
8.3
8.1
7.7
11
14
9
8.9
13
9.8
16
36
11
15
9
9.8
8.6
15
14
no2
5.3
7
8.6
12
8.2
11
13
10
9.3
6.8
5.3
5.9
7.2
13
11
15
21
16
14
11
7.5
6.8
6.8
5.7
8.6
13
21
25
22
15
15
14
12
FI00465
index
2020-03
2020-02
2020-01
2019-12
2019-11
2019-03
2019-02
2019-01
2018-12
2018-11
2018-10
2018-09
2018-08
2018-07
2018-06
2018-05
2018-04
2018-03
2018-02
2018-01
2017-12
2017-11
2017-10
2017-09
no2
19
14
12
11
14
23
23
24
16
13
15
14
12
11
12
16
39
57
43
32
22
16
17
14
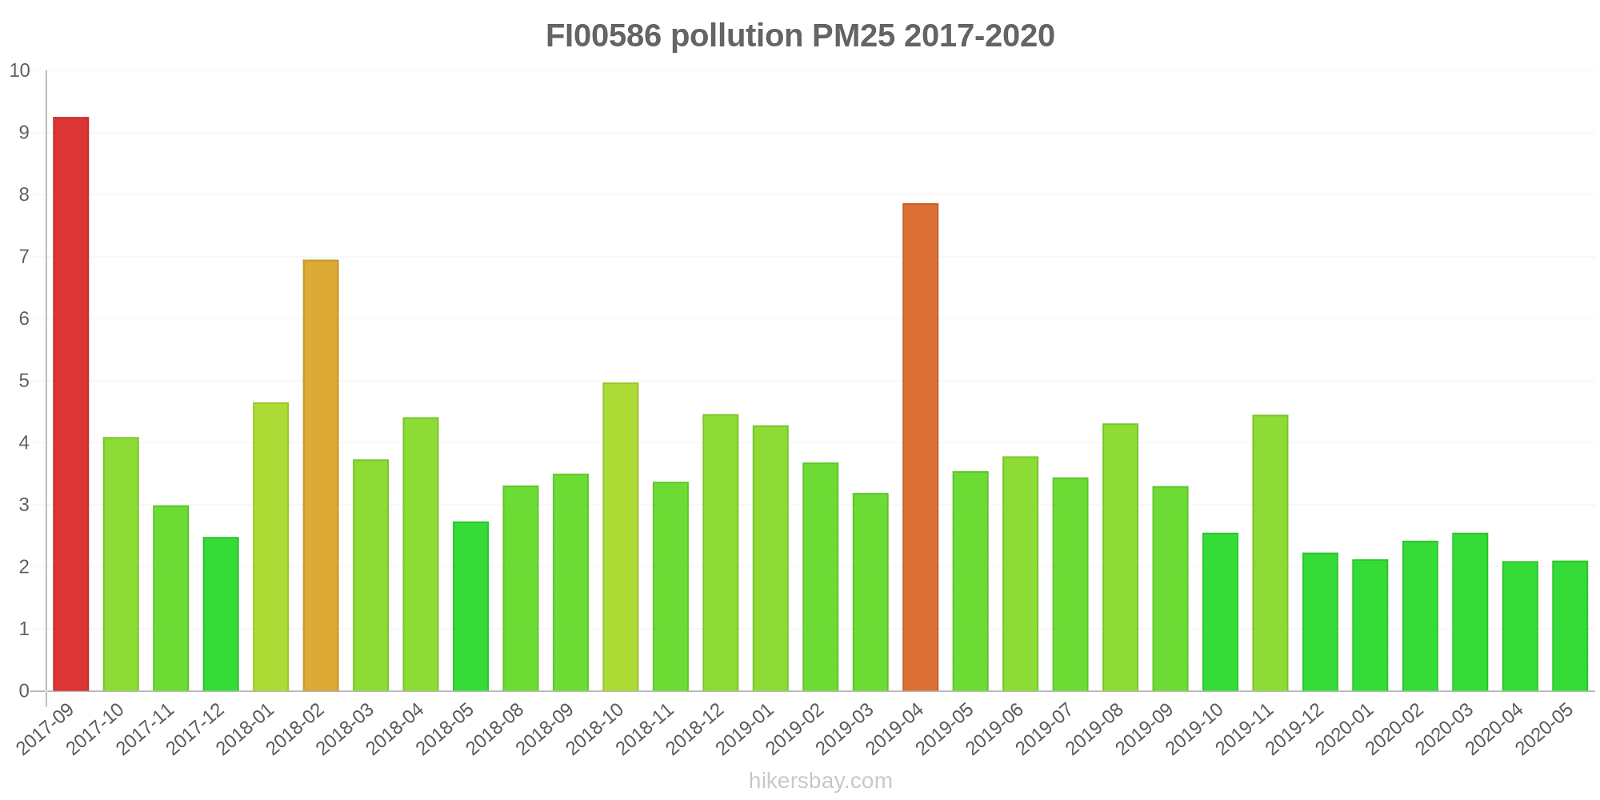
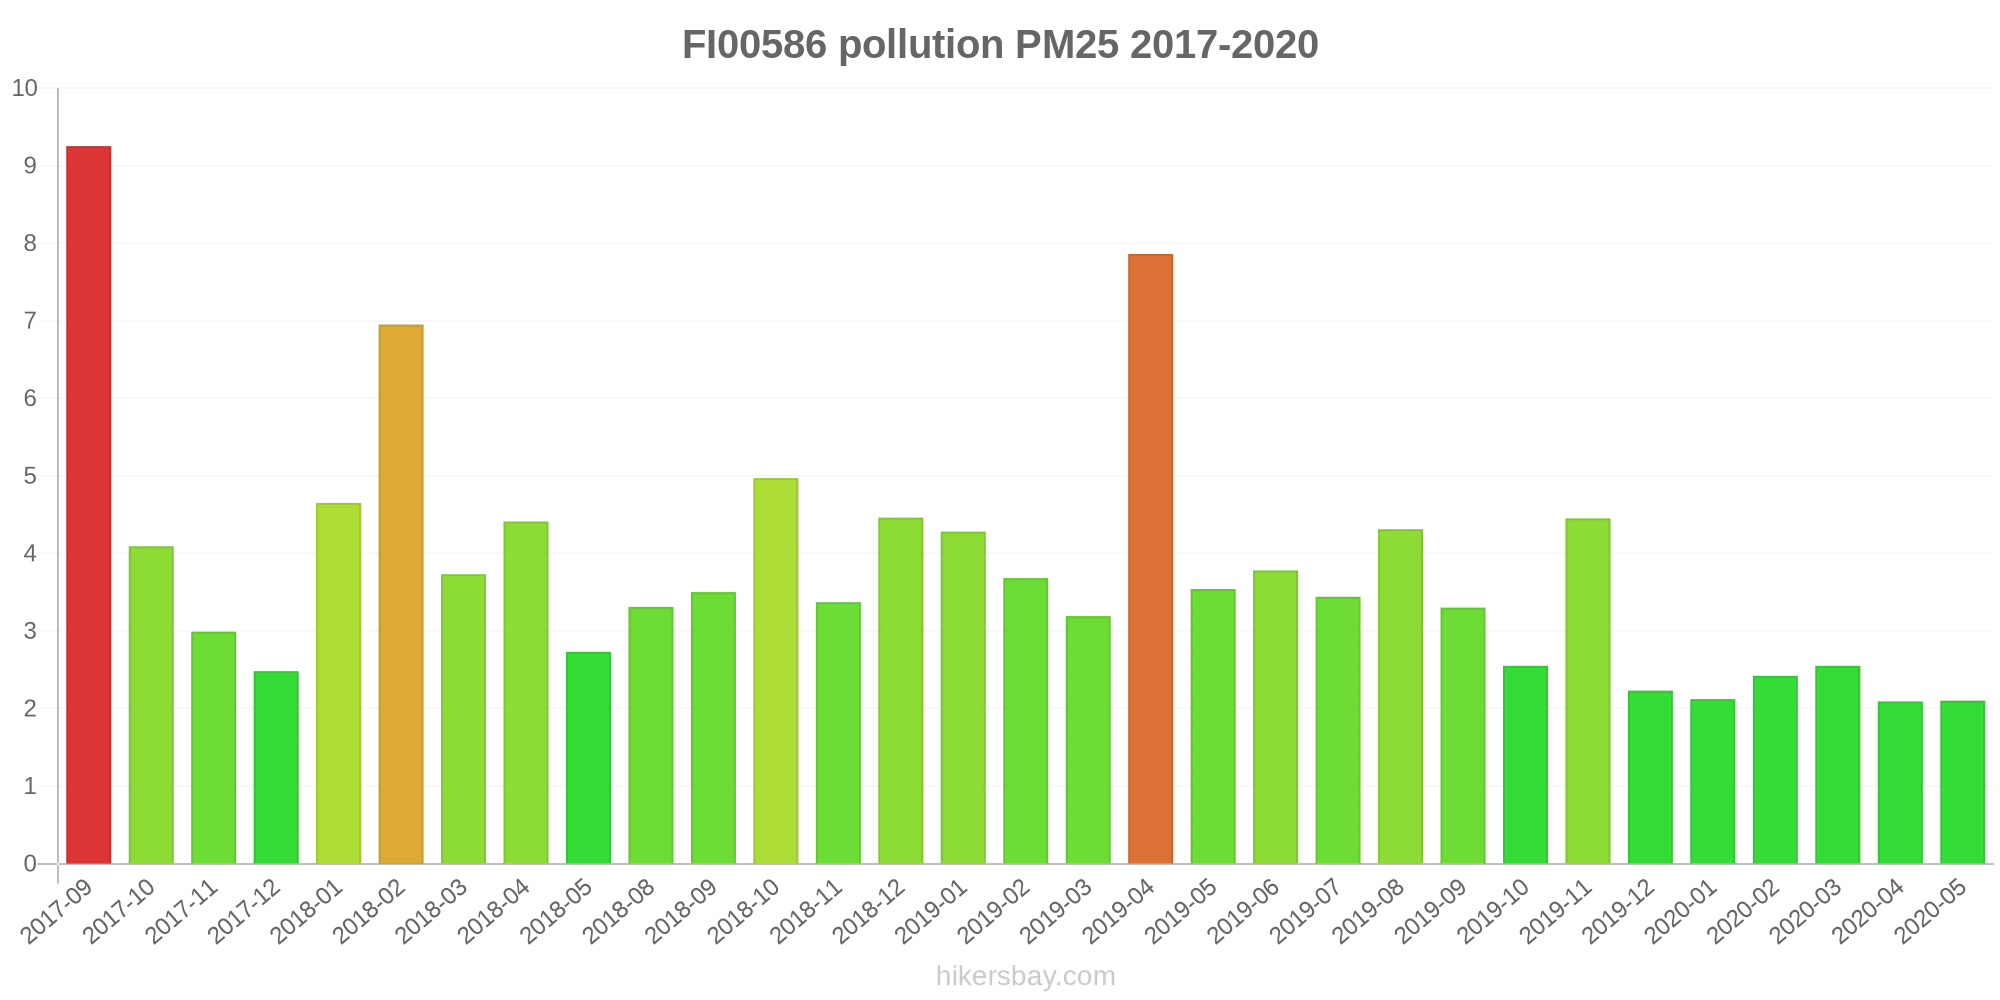
FI00586
2017-09 2020-05
index
2020-05
2020-04
2020-03
2020-02
2020-01
2019-12
2019-11
2019-10
2019-09
2019-08
2019-07
2019-06
2019-05
2019-04
2019-03
2019-02
2019-01
2018-12
2018-11
2018-10
2018-09
2018-08
2018-07
2018-06
2018-05
2018-04
2018-03
2018-02
2018-01
2017-12
2017-11
2017-10
2017-09
pm25
2.1
2.1
2.5
2.4
2.1
2.2
4.5
2.5
3.3
4.3
3.4
3.8
3.5
7.9
3.2
3.7
4.3
4.5
3.4
5
3.5
3.3
-
-
2.7
4.4
3.7
7
4.7
2.5
3
4.1
9.3
o3
-
-
-
-
-
-
-
-
-
-
-
-
18
51
55
67
50
42
41
48
51
62
56
67
80
77
70
54
44
50
44
39
19
* Pollution data source:
https://openaq.org
(EEA Finland)
The data is licensed under CC-By 4.0
PM10 7 (Bagus)
NO2 31 (Bagus)
PM2,5 2 (Bagus)
Data tentang polusi udara dari beberapa hari terakhir di Ostrobothnia
| index | 2024-01-10 | 2024-01-11 | 2024-01-12 | 2024-01-13 | 2024-01-14 | 2024-01-15 | 2024-01-16 | 2024-01-17 |
|---|---|---|---|---|---|---|---|---|
| pm10 | 1 Good |
4 Good |
3 Good |
3 Good |
2 Good |
2 Good |
12 Good |
6 Good |
| no2 | 7 Good |
19 Good |
24 Good |
8 Good |
6 Good |
10 Good |
33 Good |
15 Good |
| pm25 | 0 Good |
1 Good |
1 Good |
1 Good |
1 Good |
1 Good |
3 Good |
2 Good |

| index | 2020-05 | 2020-04 | 2020-03 | 2020-02 | 2020-01 | 2019-12 | 2019-11 | 2019-10 | 2019-09 | 2019-08 | 2019-07 | 2019-06 | 2019-05 | 2019-04 | 2019-03 | 2019-02 | 2019-01 | 2018-12 | 2018-11 | 2018-10 | 2018-09 | 2018-08 | 2018-07 | 2018-06 | 2018-05 | 2018-04 | 2018-03 | 2018-02 | 2018-01 | 2017-12 | 2017-11 | 2017-10 | 2017-09 |
|---|---|---|---|---|---|---|---|---|---|---|---|---|---|---|---|---|---|---|---|---|---|---|---|---|---|---|---|---|---|---|---|---|---|
| no2 | 5.3 (Good) | 7 (Good) | 14 (Good) | 13 (Good) | 10 (Good) | 11 (Good) | 14 (Good) | 10 (Good) | 9.3 (Good) | 6.8 (Good) | 5.3 (Good) | 5.9 (Good) | 7.2 (Good) | 13 (Good) | 17 (Good) | 19 (Good) | 23 (Good) | 16 (Good) | 14 (Good) | 13 (Good) | 10 (Good) | 9.6 (Good) | 8.7 (Good) | 8.8 (Good) | 12 (Good) | 26 (Good) | 39 (Good) | 34 (Good) | 27 (Good) | 19 (Good) | 15 (Good) | 15 (Good) | 13 (Good) |
| pm10 | 9 (Good) | 14 (Good) | 20 (Good) | 24 (Moderate) | 9.9 (Good) | 4.5 (Good) | 13 (Good) | 9.4 (Good) | 9.4 (Good) | 9 (Good) | 8.3 (Good) | 9.4 (Good) | 12 (Good) | 35 (Moderate) | 14 (Good) | 8.3 (Good) | 8.1 (Good) | 7.7 (Good) | 11 (Good) | 14 (Good) | 9 (Good) | 8.9 (Good) | 13 (Good) | 9.8 (Good) | 16 (Good) | 36 (Moderate) | 11 (Good) | 15 (Good) | 9 (Good) | 9.8 (Good) | 8.6 (Good) | 15 (Good) | 14 (Good) |
| pm25 | 2.1 (Good) | 2.1 (Good) | 2.5 (Good) | 2.4 (Good) | 2.1 (Good) | 2.2 (Good) | 4.5 (Good) | 2.5 (Good) | 3.3 (Good) | 4.3 (Good) | 3.4 (Good) | 3.8 (Good) | 3.5 (Good) | 7.9 (Good) | 3.2 (Good) | 3.7 (Good) | 4.3 (Good) | 4.5 (Good) | 3.4 (Good) | 5 (Good) | 3.5 (Good) | 3.3 (Good) | - (Good) | - (Good) | 2.7 (Good) | 4.4 (Good) | 3.7 (Good) | 7 (Good) | 4.7 (Good) | 2.5 (Good) | 3 (Good) | 4.1 (Good) | 9.3 (Good) |
| o3 | - (Good) | - (Good) | - (Good) | - (Good) | - (Good) | - (Good) | - (Good) | - (Good) | - (Good) | - (Good) | - (Good) | - (Good) | 18 (Good) | 51 (Good) | 55 (Good) | 67 (Good) | 50 (Good) | 42 (Good) | 41 (Good) | 48 (Good) | 51 (Good) | 62 (Good) | 56 (Good) | 67 (Good) | 80 (Moderate) | 77 (Moderate) | 70 (Moderate) | 54 (Good) | 44 (Good) | 50 (Good) | 44 (Good) | 39 (Good) | 19 (Good) |
Hijau dan taman di kota
Ostrobothnia 75%
Estonia: 82% Kepulauan Åland: 75% Swedia: 84% Latvia: 88% Lituania: 86%partikulat Matter PM 2.5
Ostrobothnia 4 (Good)
Kenikmatan menghabiskan waktu di kota
Ostrobothnia 92%
Estonia: 90% Kepulauan Åland: 92% Swedia: 88% Latvia: 82% Lituania: 83%partikulat Matter PM10
Ostrobothnia 10 (Good)
Polusi udara
Ostrobothnia 6,8%
Estonia: 12% Kepulauan Åland: 17% Swedia: 15% Latvia: 29% Lituania: 26%Pembuangan sampah
Ostrobothnia 88%
Estonia: 79% Kepulauan Åland: 88% Swedia: 83% Latvia: 70% Lituania: 71%Ketersediaan dan kualitas air minum
Ostrobothnia 96%
Estonia: 90% Kepulauan Åland: 96% Swedia: 92% Latvia: 79% Lituania: 91%Kebersihan dan kerasnya
Ostrobothnia 93%
Estonia: 82% Kepulauan Åland: 83% Swedia: 76% Latvia: 72% Lituania: 78%Kebisingan dan polusi cahaya
Ostrobothnia 11%
Estonia: 31% Kepulauan Åland: 46% Swedia: 26% Latvia: 37% Lituania: 30%Polusi air
Ostrobothnia 7,1%
Estonia: 16% Kepulauan Åland: 10% Swedia: 15% Latvia: 28% Lituania: 24%PM10 12 (Bagus)
partikulat Matter (PM10) debu tersuspensiNO2 27 (Bagus)
nitrogen dioksida (NO2)NO2 36 (Bagus)
nitrogen dioksida (NO2)PM10 5.7 (Bagus)
partikulat Matter (PM10) debu tersuspensiPM2,5 2.3 (Bagus)
partikulat Matter (PM 2.5) debuPM10 2.9 (Bagus)
partikulat Matter (PM10) debu tersuspensiBottenviksvägen
| index | 2024-01-17 | 2024-01-16 | 2024-01-15 | 2024-01-14 | 2024-01-13 | 2024-01-12 | 2024-01-11 | 2024-01-10 |
|---|---|---|---|---|---|---|---|---|
| pm10 | 8.2 | 23 | 2.6 | 2.6 | 3.5 | 5.9 | 6.4 | 1.1 |
| no2 | 15 | 30 | 8 | 6.8 | 7.5 | 27 | 21 | 4.6 |
Vaasan keskusta
| index | 2024-01-17 | 2024-01-16 | 2024-01-15 | 2024-01-14 | 2024-01-13 | 2024-01-12 | 2024-01-11 | 2024-01-10 |
|---|---|---|---|---|---|---|---|---|
| no2 | 16 | 36 | 13 | 6.1 | 8.2 | 21 | 17 | 8.4 |
| pm10 | 7.7 | 9 | 4.1 | 2.8 | 2.4 | 2.9 | 3.7 | 1.8 |
Vaasa vesitorni
| index | 2024-01-17 | 2024-01-16 | 2024-01-15 | 2024-01-14 | 2024-01-13 | 2024-01-12 | 2024-01-11 | 2024-01-10 |
|---|---|---|---|---|---|---|---|---|
| pm25 | 2.1 | 2.6 | 0.53 | 0.93 | 1 | 0.84 | 0.58 | 0.1 |
| pm10 | 2.6 | 3.4 | 0.78 | 1.2 | 2.5 | 1.1 | 0.84 | 0.13 |
FI00397
| index | 2020-05 | 2020-04 | 2020-03 | 2020-02 | 2020-01 | 2019-12 | 2019-11 | 2019-10 | 2019-09 | 2019-08 | 2019-07 | 2019-06 | 2019-05 | 2019-04 | 2019-03 | 2019-02 | 2019-01 | 2018-12 | 2018-11 | 2018-10 | 2018-09 | 2018-08 | 2018-07 | 2018-06 | 2018-05 | 2018-04 | 2018-03 | 2018-02 | 2018-01 | 2017-12 | 2017-11 | 2017-10 | 2017-09 |
|---|---|---|---|---|---|---|---|---|---|---|---|---|---|---|---|---|---|---|---|---|---|---|---|---|---|---|---|---|---|---|---|---|---|
| pm10 | 9 | 14 | 20 | 24 | 9.9 | 4.5 | 13 | 9.4 | 9.4 | 9 | 8.3 | 9.4 | 12 | 35 | 14 | 8.3 | 8.1 | 7.7 | 11 | 14 | 9 | 8.9 | 13 | 9.8 | 16 | 36 | 11 | 15 | 9 | 9.8 | 8.6 | 15 | 14 |
| no2 | 5.3 | 7 | 8.6 | 12 | 8.2 | 11 | 13 | 10 | 9.3 | 6.8 | 5.3 | 5.9 | 7.2 | 13 | 11 | 15 | 21 | 16 | 14 | 11 | 7.5 | 6.8 | 6.8 | 5.7 | 8.6 | 13 | 21 | 25 | 22 | 15 | 15 | 14 | 12 |
FI00465
| index | 2020-03 | 2020-02 | 2020-01 | 2019-12 | 2019-11 | 2019-03 | 2019-02 | 2019-01 | 2018-12 | 2018-11 | 2018-10 | 2018-09 | 2018-08 | 2018-07 | 2018-06 | 2018-05 | 2018-04 | 2018-03 | 2018-02 | 2018-01 | 2017-12 | 2017-11 | 2017-10 | 2017-09 |
|---|---|---|---|---|---|---|---|---|---|---|---|---|---|---|---|---|---|---|---|---|---|---|---|---|
| no2 | 19 | 14 | 12 | 11 | 14 | 23 | 23 | 24 | 16 | 13 | 15 | 14 | 12 | 11 | 12 | 16 | 39 | 57 | 43 | 32 | 22 | 16 | 17 | 14 |
FI00586
| index | 2020-05 | 2020-04 | 2020-03 | 2020-02 | 2020-01 | 2019-12 | 2019-11 | 2019-10 | 2019-09 | 2019-08 | 2019-07 | 2019-06 | 2019-05 | 2019-04 | 2019-03 | 2019-02 | 2019-01 | 2018-12 | 2018-11 | 2018-10 | 2018-09 | 2018-08 | 2018-07 | 2018-06 | 2018-05 | 2018-04 | 2018-03 | 2018-02 | 2018-01 | 2017-12 | 2017-11 | 2017-10 | 2017-09 |
|---|---|---|---|---|---|---|---|---|---|---|---|---|---|---|---|---|---|---|---|---|---|---|---|---|---|---|---|---|---|---|---|---|---|
| pm25 | 2.1 | 2.1 | 2.5 | 2.4 | 2.1 | 2.2 | 4.5 | 2.5 | 3.3 | 4.3 | 3.4 | 3.8 | 3.5 | 7.9 | 3.2 | 3.7 | 4.3 | 4.5 | 3.4 | 5 | 3.5 | 3.3 | - | - | 2.7 | 4.4 | 3.7 | 7 | 4.7 | 2.5 | 3 | 4.1 | 9.3 |
| o3 | - | - | - | - | - | - | - | - | - | - | - | - | 18 | 51 | 55 | 67 | 50 | 42 | 41 | 48 | 51 | 62 | 56 | 67 | 80 | 77 | 70 | 54 | 44 | 50 | 44 | 39 | 19 |