Polusi udara di Espoo: indeks kualitas udara real-time dan siaga asap.
Perkiraan kualitas polusi dan udara untuk Espoo. Hari ini Jumat, 19 Juni 2026. Nilai polusi udara berikut telah tercatat untuk Espoo:- sulfur dioksida (SO2) - 0 (Bagus)
- partikulat Matter (PM 2.5) debu - 5 (Bagus)
- nitrogen dioksida (NO2) - 37 (Bagus)
- partikulat Matter (PM10) debu tersuspensi - 7 (Bagus)
- ozon (O3) - 36 (Bagus)

Apa kualitas udara di Espoo hari ini? Apakah udara tercemar di Espoo?. Apakah ada Smog?
Apa tingkat polusi SO2? (sulfur dioksida (SO2))
0 (Bagus)
Apa tingkat saat PM 2,5 in Espoo? (partikulat Matter (PM 2.5) debu)
Hari ini PM 2.5 tingkat:
5 (Bagus)
Sebagai perbandingan, tingkat tertinggi PM 2,5 in Espoo dalam 7 hari terakhir adalah: 8 (Minggu, 14 Januari 2024) dan Terendah: 1 (Rabu, 10 Januari 2024).
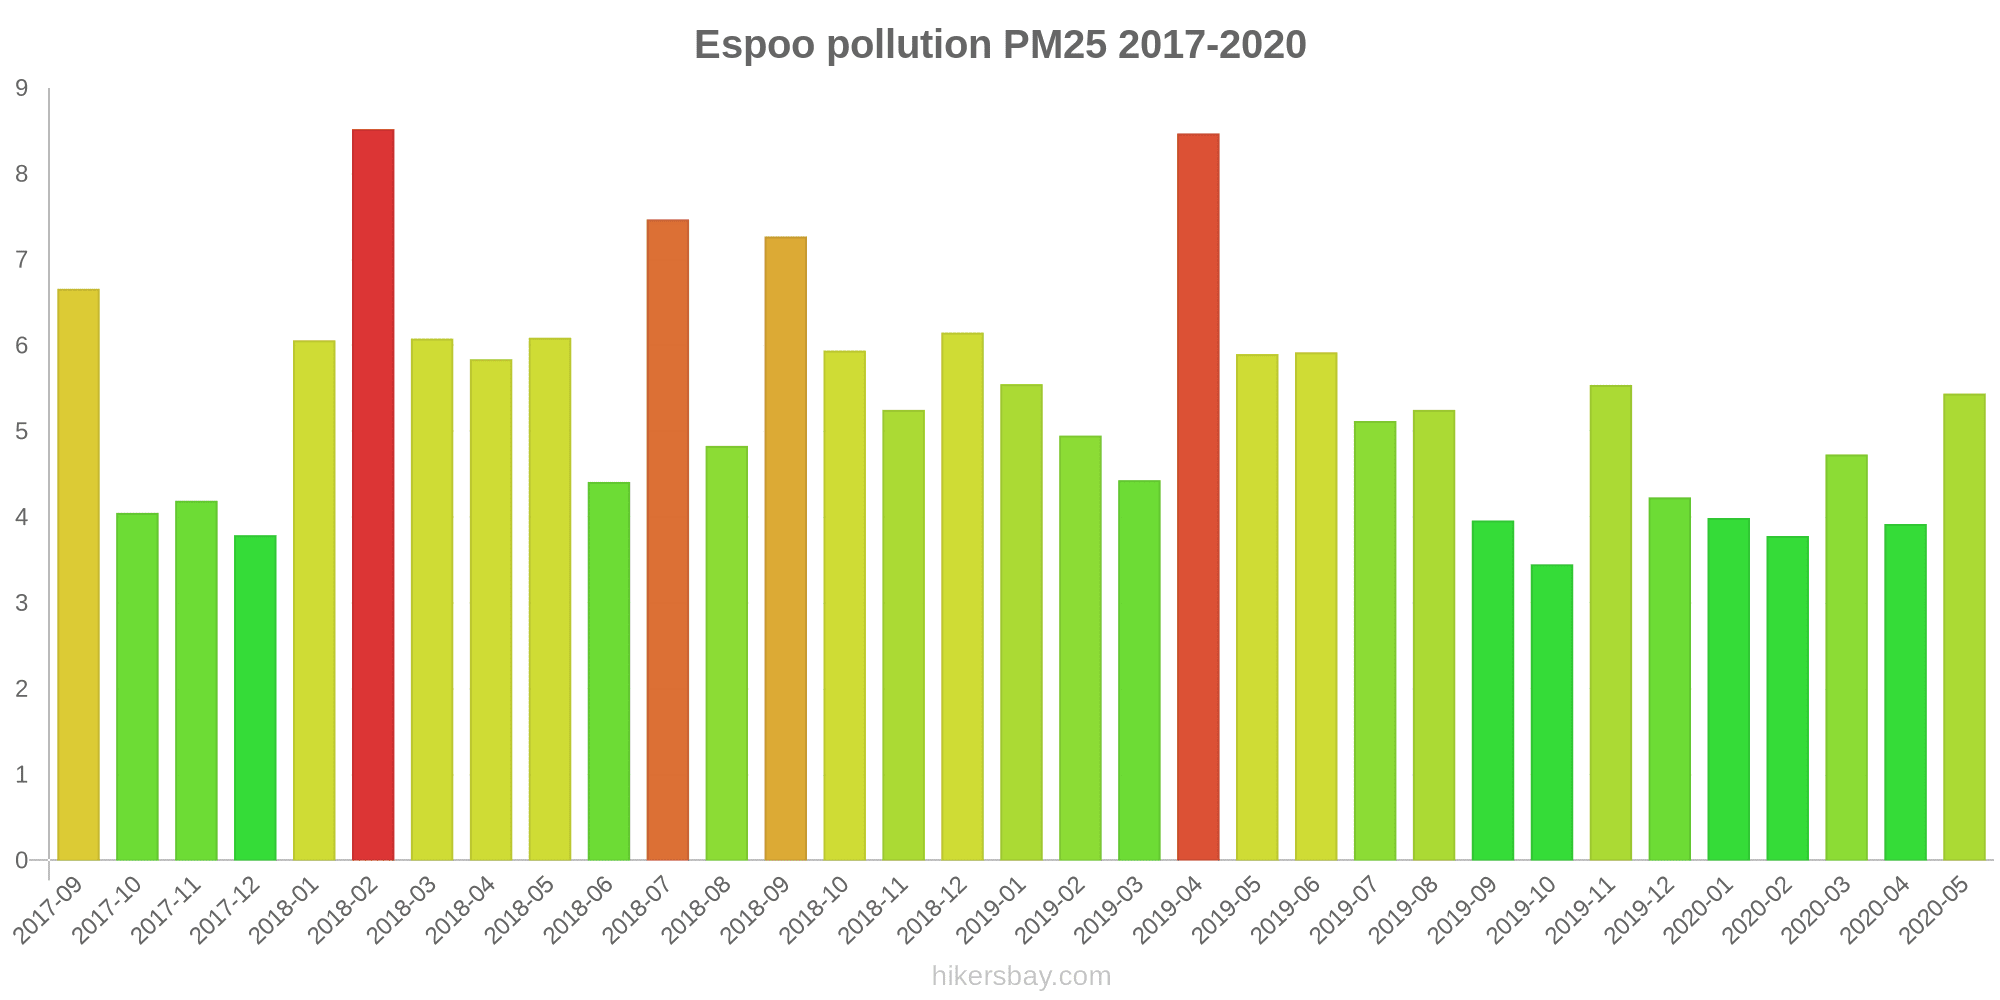
Nilai tertinggi PM 2.5 direkam: 8.5 (Februari 2018).
Tingkat terendah dari partikulat Matter PM 2.5 polusi terjadi di bulan: Oktober (3.5).
Seberapa tinggi tingkat NO2? (nitrogen dioksida (NO2))
37 (Bagus)
Apa tingkat PM10 hari ini di Espoo? (partikulat Matter (PM10) debu tersuspensi)
Level saat ini dari partikulat Matter PM10 di Espoo adalah:
7 (Bagus)
Nilai PM10 tertinggi biasanya terjadi di bulan: 55 (April 2019).
Nilai terendah dari partikulat PM10 pencemaran Espoo biasanya dicatat di: Desember (7.3).
Bagaimana tingkat O3 hari ini di Espoo? (ozon (O3))
36 (Bagus)
Data saat ini Rabu, 17 Januari 2024 06.00
SO2 0 (Bagus)
PM2,5 5 (Bagus)
NO2 37 (Bagus)
PM10 7 (Bagus)
O3 36 (Bagus)
Data tentang polusi udara dari beberapa hari terakhir di Espoo
index
2024-01-10
2024-01-11
2024-01-12
2024-01-13
2024-01-14
2024-01-15
2024-01-16
2024-01-17
o3
65
Good
68
Good
57
Good
52
Good
39
Good
38
Good
59
Good
41
Good
so2
1
Good
0
Good
0
Good
0
Good
0
Good
0
Good
1
Good
0
Good
pm10
2
Good
2
Good
4
Good
6
Good
9
Good
8
Good
4
Good
9
Good
no2
7
Good
7
Good
13
Good
11
Good
14
Good
14
Good
12
Good
21
Good
pm25
1
Good
1
Good
3
Good
4
Good
8
Good
7
Good
3
Good
6
Good
data source »
Polusi udara di Espoo dari September 2017 ke Mei 2020

index
2020-05
2020-04
2020-03
2020-02
2020-01
2019-12
2019-11
2019-10
2019-09
2019-08
2019-07
2019-06
2019-05
2019-04
2019-03
2019-02
2019-01
2018-12
2018-11
2018-10
2018-09
2018-08
2018-07
2018-06
2018-05
2018-04
2018-03
2018-02
2018-01
2017-12
2017-11
2017-10
2017-09
pm25
5.4 (Good)
3.9 (Good)
4.7 (Good)
3.8 (Good)
4 (Good)
4.2 (Good)
5.5 (Good)
3.5 (Good)
4 (Good)
5.3 (Good)
5.1 (Good)
5.9 (Good)
5.9 (Good)
8.5 (Good)
4.4 (Good)
5 (Good)
5.5 (Good)
6.2 (Good)
5.3 (Good)
5.9 (Good)
7.3 (Good)
4.8 (Good)
7.5 (Good)
4.4 (Good)
6.1 (Good)
5.8 (Good)
6.1 (Good)
8.5 (Good)
6.1 (Good)
3.8 (Good)
4.2 (Good)
4 (Good)
6.7 (Good)
no2
6.5 (Good)
4.3 (Good)
8.7 (Good)
8.3 (Good)
9.4 (Good)
10 (Good)
13 (Good)
11 (Good)
10 (Good)
9.8 (Good)
7.3 (Good)
9.3 (Good)
12 (Good)
18 (Good)
12 (Good)
14 (Good)
21 (Good)
14 (Good)
15 (Good)
13 (Good)
12 (Good)
12 (Good)
9.8 (Good)
7.1 (Good)
14 (Good)
17 (Good)
20 (Good)
22 (Good)
15 (Good)
12 (Good)
16 (Good)
12 (Good)
14 (Good)
so2
0.53 (Good)
0.44 (Good)
0.73 (Good)
0.72 (Good)
0.56 (Good)
0.49 (Good)
0.52 (Good)
0.21 (Good)
0.27 (Good)
0.28 (Good)
0.28 (Good)
0.6 (Good)
0.56 (Good)
1.1 (Good)
0.62 (Good)
0.64 (Good)
0.66 (Good)
0.79 (Good)
1.9 (Good)
0.83 (Good)
0.88 (Good)
1.4 (Good)
1.1 (Good)
0.65 (Good)
0.72 (Good)
1.7 (Good)
1.5 (Good)
1.7 (Good)
1.6 (Good)
1.4 (Good)
1.1 (Good)
0.54 (Good)
1.4 (Good)
o3
66 (Good)
65 (Good)
60 (Good)
59 (Good)
54 (Good)
43 (Good)
29 (Good)
33 (Good)
35 (Good)
47 (Good)
46 (Good)
67 (Good)
63 (Good)
72 (Moderate)
67 (Good)
61 (Good)
46 (Good)
40 (Good)
38 (Good)
38 (Good)
44 (Good)
52 (Good)
57 (Good)
68 (Good)
72 (Moderate)
69 (Good)
65 (Good)
51 (Good)
39 (Good)
47 (Good)
38 (Good)
33 (Good)
23 (Good)
pm10
13 (Good)
13 (Good)
23 (Moderate)
19 (Good)
9.6 (Good)
7.8 (Good)
22 (Moderate)
9.2 (Good)
12 (Good)
13 (Good)
12 (Good)
14 (Good)
18 (Good)
55 (Unhealthy for Sensitive Groups)
23 (Moderate)
9.9 (Good)
9.3 (Good)
11 (Good)
22 (Moderate)
15 (Good)
15 (Good)
14 (Good)
17 (Good)
12 (Good)
25 (Moderate)
40 (Moderate)
36 (Moderate)
28 (Moderate)
14 (Good)
7.3 (Good)
13 (Good)
11 (Good)
17 (Good)
data source »
Kualitas hidup di Espoo
Hijau dan taman di kota
Espoo
82%
Estonia: 82%
Kepulauan Åland: 75%
Swedia: 84%
Latvia: 88%
Lituania: 86%
partikulat Matter PM 2.5
Espoo
5 (Good)
Kenikmatan menghabiskan waktu di kota
Espoo
89%
Estonia: 90%
Kepulauan Åland: 92%
Swedia: 88%
Latvia: 82%
Lituania: 83%
partikulat Matter PM10
Espoo
10 (Good)
Polusi udara
Espoo
6%
Estonia: 12%
Kepulauan Åland: 17%
Swedia: 15%
Latvia: 29%
Lituania: 26%
Pembuangan sampah
Espoo
88%
Estonia: 79%
Kepulauan Åland: 88%
Swedia: 83%
Latvia: 70%
Lituania: 71%
Ketersediaan dan kualitas air minum
Espoo
95%
Estonia: 90%
Kepulauan Åland: 96%
Swedia: 92%
Latvia: 79%
Lituania: 91%
Kebersihan dan kerasnya
Espoo
79%
Estonia: 82%
Kepulauan Åland: 83%
Swedia: 76%
Latvia: 72%
Lituania: 78%
Kebisingan dan polusi cahaya
Espoo
25%
Estonia: 31%
Kepulauan Åland: 46%
Swedia: 26%
Latvia: 37%
Lituania: 30%
Polusi air
Espoo
17%
Estonia: 16%
Kepulauan Åland: 10%
Swedia: 15%
Latvia: 28%
Lituania: 24%
Source: Numbeo
Luukki
Rabu, 17 Januari 2024 06.00
SO2 -0.23 (Bagus)
sulfur dioksida (SO2)
PM2,5 2.7 (Bagus)
partikulat Matter (PM 2.5) debu
NO2 9.4 (Bagus)
nitrogen dioksida (NO2)
PM10 3 (Bagus)
partikulat Matter (PM10) debu tersuspensi
O3 36 (Bagus)
ozon (O3)
Leppävaara 4
Rabu, 17 Januari 2024 06.00
PM2,5 8.1 (Bagus)
partikulat Matter (PM 2.5) debu
PM10 11 (Bagus)
partikulat Matter (PM10) debu tersuspensi
NO2 65 (Moderat)
nitrogen dioksida (NO2)
Luukki
index
2024-01-17
2024-01-16
2024-01-15
2024-01-14
2024-01-13
2024-01-12
2024-01-11
2024-01-10
o3
41
59
38
39
52
57
68
65
so2
-0.25
0.95
0.19
0.21
0.06
0.17
-0.07
0.5
pm10
3.6
2.8
6.6
6.8
4.7
3.3
1.8
1.2
no2
6.4
3.5
7.7
7.3
5.3
6.2
1.4
1.3
pm25
3.1
2.3
5.9
6.2
3.7
2.1
1
0.89
Leppävaara 4
index
2024-01-17
2024-01-16
2024-01-15
2024-01-14
2024-01-13
2024-01-12
2024-01-11
2024-01-10
pm25
8.2
3.9
7.5
9.3
4.8
2.9
1.5
1.5
pm10
15
5
9.3
10
6.3
5.1
2.7
2.4
no2
35
20
20
21
16
19
13
12
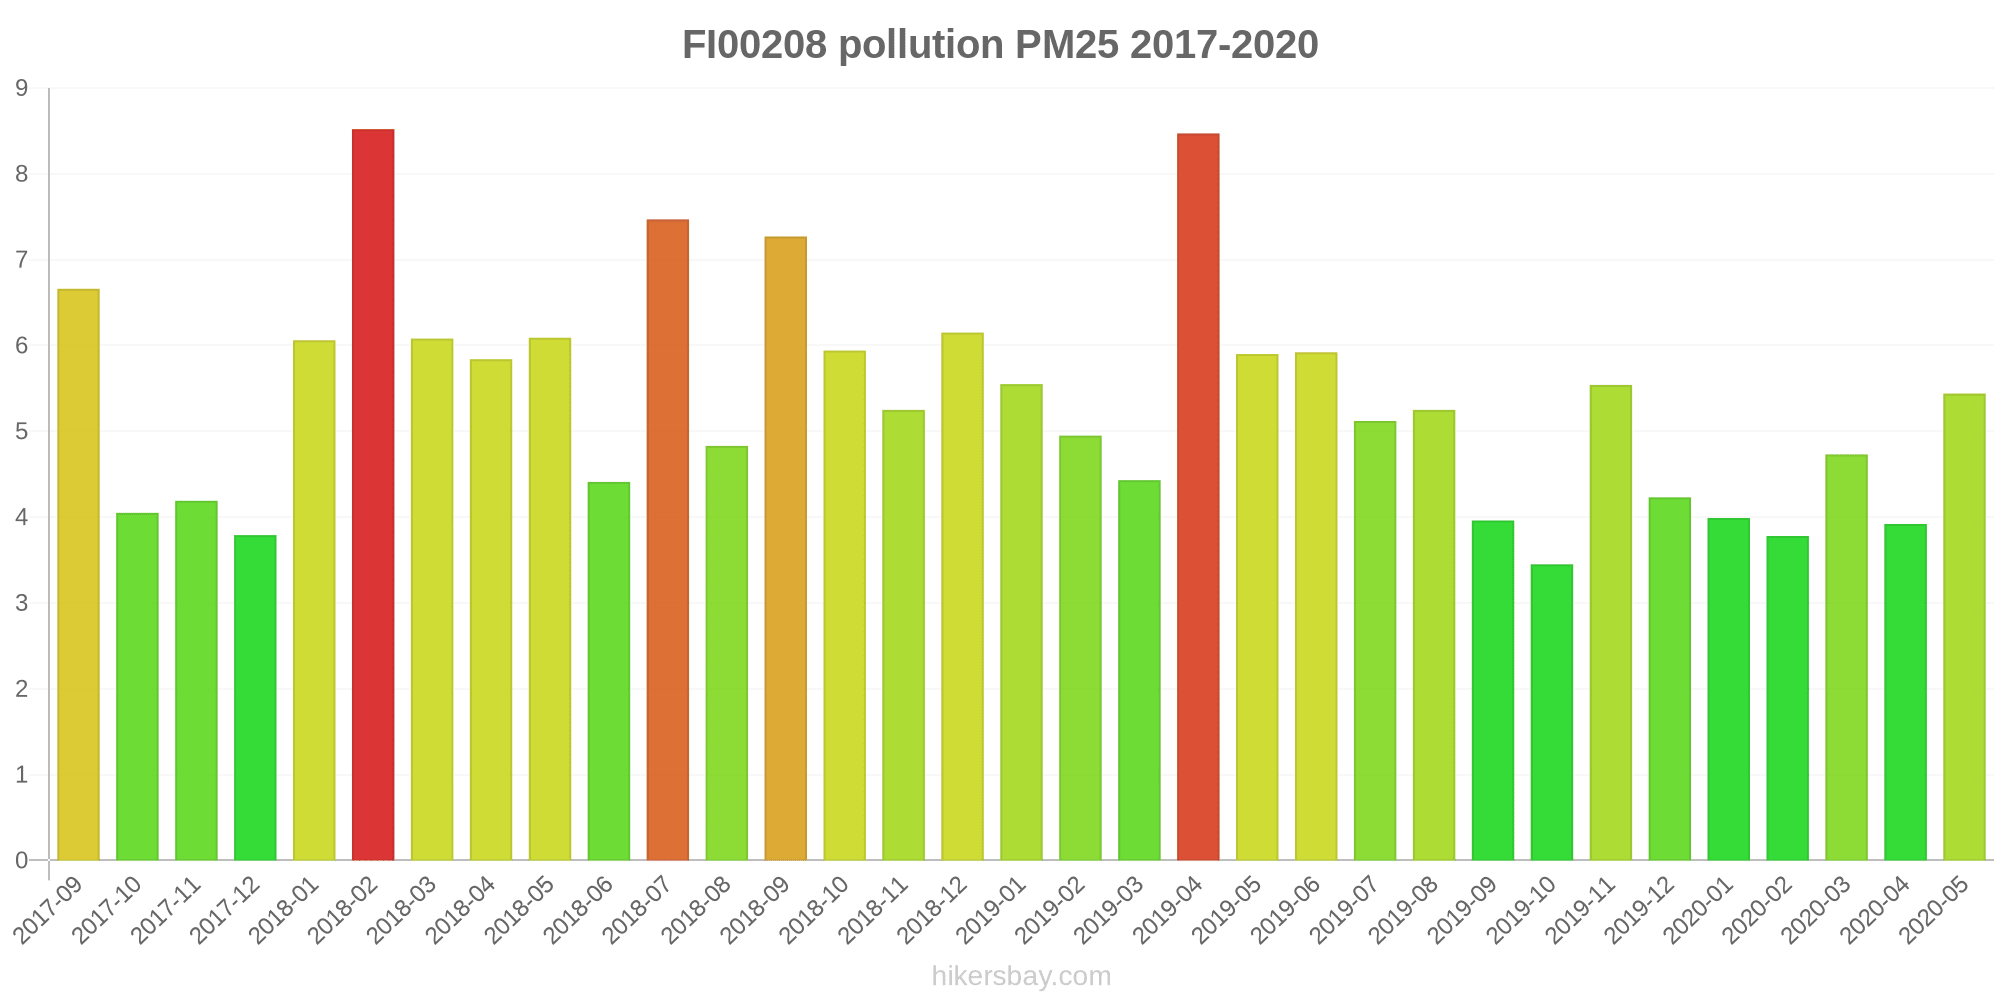
FI00208
2017-09 2020-05

index
2020-05
2020-04
2020-03
2020-02
2020-01
2019-12
2019-11
2019-10
2019-09
2019-08
2019-07
2019-06
2019-05
2019-04
2019-03
2019-02
2019-01
2018-12
2018-11
2018-10
2018-09
2018-08
2018-07
2018-06
2018-05
2018-04
2018-03
2018-02
2018-01
2017-12
2017-11
2017-10
2017-09
pm25
5.4
3.9
4.7
3.8
4
4.2
5.5
3.5
4
5.3
5.1
5.9
5.9
8.5
4.4
5
5.5
6.2
5.3
5.9
7.3
4.8
7.5
4.4
6.1
5.8
6.1
8.5
6.1
3.8
4.2
4
6.7
so2
0.53
0.44
0.73
0.72
0.56
0.49
0.52
0.21
0.27
0.28
0.28
0.6
0.56
1.1
0.62
0.64
0.66
0.79
1.9
0.83
0.88
1.4
1.1
0.65
0.72
1.7
1.5
1.7
1.6
1.4
1.1
0.54
1.4
no2
6.6
2
3.1
2.5
2.8
2.8
7.3
5
3.8
3.7
2.6
3.6
4.7
5.7
4.5
5
9.3
7.3
5
3.9
3.5
3.4
3.4
2.3
4.5
6.7
8.9
10
8.1
4.5
6
5.3
7.5
o3
66
65
60
59
54
43
29
33
35
47
46
67
63
72
67
61
46
40
38
38
44
52
57
68
72
69
65
51
39
47
38
33
23
FI00841
index
2020-05
2020-04
2020-03
2020-02
2020-01
2019-12
2019-11
2019-10
2019-09
2019-08
2019-07
2019-06
2019-05
2019-04
2019-03
2019-02
2019-01
2018-12
2018-11
2018-10
2018-09
2018-08
2018-07
2018-06
2018-05
2018-04
2018-03
2018-02
2018-01
2017-12
2017-11
2017-10
2017-09
pm10
13
13
23
19
9.6
7.8
22
9.2
12
13
12
14
18
55
23
9.9
9.3
11
22
15
15
14
17
12
25
40
36
28
14
7.3
13
11
17
no2
6.4
6.7
14
14
16
18
18
17
16
16
12
15
20
30
20
22
33
21
24
21
20
20
16
12
23
28
32
33
23
20
25
19
20
* Pollution data source:
https://openaq.org
(EEA Finland)
The data is licensed under CC-By 4.0
SO2 0 (Bagus)
PM2,5 5 (Bagus)
NO2 37 (Bagus)
PM10 7 (Bagus)
O3 36 (Bagus)
Data tentang polusi udara dari beberapa hari terakhir di Espoo
| index | 2024-01-10 | 2024-01-11 | 2024-01-12 | 2024-01-13 | 2024-01-14 | 2024-01-15 | 2024-01-16 | 2024-01-17 |
|---|---|---|---|---|---|---|---|---|
| o3 | 65 Good |
68 Good |
57 Good |
52 Good |
39 Good |
38 Good |
59 Good |
41 Good |
| so2 | 1 Good |
0 Good |
0 Good |
0 Good |
0 Good |
0 Good |
1 Good |
0 Good |
| pm10 | 2 Good |
2 Good |
4 Good |
6 Good |
9 Good |
8 Good |
4 Good |
9 Good |
| no2 | 7 Good |
7 Good |
13 Good |
11 Good |
14 Good |
14 Good |
12 Good |
21 Good |
| pm25 | 1 Good |
1 Good |
3 Good |
4 Good |
8 Good |
7 Good |
3 Good |
6 Good |
| index | 2020-05 | 2020-04 | 2020-03 | 2020-02 | 2020-01 | 2019-12 | 2019-11 | 2019-10 | 2019-09 | 2019-08 | 2019-07 | 2019-06 | 2019-05 | 2019-04 | 2019-03 | 2019-02 | 2019-01 | 2018-12 | 2018-11 | 2018-10 | 2018-09 | 2018-08 | 2018-07 | 2018-06 | 2018-05 | 2018-04 | 2018-03 | 2018-02 | 2018-01 | 2017-12 | 2017-11 | 2017-10 | 2017-09 |
|---|---|---|---|---|---|---|---|---|---|---|---|---|---|---|---|---|---|---|---|---|---|---|---|---|---|---|---|---|---|---|---|---|---|
| pm25 | 5.4 (Good) | 3.9 (Good) | 4.7 (Good) | 3.8 (Good) | 4 (Good) | 4.2 (Good) | 5.5 (Good) | 3.5 (Good) | 4 (Good) | 5.3 (Good) | 5.1 (Good) | 5.9 (Good) | 5.9 (Good) | 8.5 (Good) | 4.4 (Good) | 5 (Good) | 5.5 (Good) | 6.2 (Good) | 5.3 (Good) | 5.9 (Good) | 7.3 (Good) | 4.8 (Good) | 7.5 (Good) | 4.4 (Good) | 6.1 (Good) | 5.8 (Good) | 6.1 (Good) | 8.5 (Good) | 6.1 (Good) | 3.8 (Good) | 4.2 (Good) | 4 (Good) | 6.7 (Good) |
| no2 | 6.5 (Good) | 4.3 (Good) | 8.7 (Good) | 8.3 (Good) | 9.4 (Good) | 10 (Good) | 13 (Good) | 11 (Good) | 10 (Good) | 9.8 (Good) | 7.3 (Good) | 9.3 (Good) | 12 (Good) | 18 (Good) | 12 (Good) | 14 (Good) | 21 (Good) | 14 (Good) | 15 (Good) | 13 (Good) | 12 (Good) | 12 (Good) | 9.8 (Good) | 7.1 (Good) | 14 (Good) | 17 (Good) | 20 (Good) | 22 (Good) | 15 (Good) | 12 (Good) | 16 (Good) | 12 (Good) | 14 (Good) |
| so2 | 0.53 (Good) | 0.44 (Good) | 0.73 (Good) | 0.72 (Good) | 0.56 (Good) | 0.49 (Good) | 0.52 (Good) | 0.21 (Good) | 0.27 (Good) | 0.28 (Good) | 0.28 (Good) | 0.6 (Good) | 0.56 (Good) | 1.1 (Good) | 0.62 (Good) | 0.64 (Good) | 0.66 (Good) | 0.79 (Good) | 1.9 (Good) | 0.83 (Good) | 0.88 (Good) | 1.4 (Good) | 1.1 (Good) | 0.65 (Good) | 0.72 (Good) | 1.7 (Good) | 1.5 (Good) | 1.7 (Good) | 1.6 (Good) | 1.4 (Good) | 1.1 (Good) | 0.54 (Good) | 1.4 (Good) |
| o3 | 66 (Good) | 65 (Good) | 60 (Good) | 59 (Good) | 54 (Good) | 43 (Good) | 29 (Good) | 33 (Good) | 35 (Good) | 47 (Good) | 46 (Good) | 67 (Good) | 63 (Good) | 72 (Moderate) | 67 (Good) | 61 (Good) | 46 (Good) | 40 (Good) | 38 (Good) | 38 (Good) | 44 (Good) | 52 (Good) | 57 (Good) | 68 (Good) | 72 (Moderate) | 69 (Good) | 65 (Good) | 51 (Good) | 39 (Good) | 47 (Good) | 38 (Good) | 33 (Good) | 23 (Good) |
| pm10 | 13 (Good) | 13 (Good) | 23 (Moderate) | 19 (Good) | 9.6 (Good) | 7.8 (Good) | 22 (Moderate) | 9.2 (Good) | 12 (Good) | 13 (Good) | 12 (Good) | 14 (Good) | 18 (Good) | 55 (Unhealthy for Sensitive Groups) | 23 (Moderate) | 9.9 (Good) | 9.3 (Good) | 11 (Good) | 22 (Moderate) | 15 (Good) | 15 (Good) | 14 (Good) | 17 (Good) | 12 (Good) | 25 (Moderate) | 40 (Moderate) | 36 (Moderate) | 28 (Moderate) | 14 (Good) | 7.3 (Good) | 13 (Good) | 11 (Good) | 17 (Good) |
Hijau dan taman di kota
Espoo 82%
Estonia: 82% Kepulauan Åland: 75% Swedia: 84% Latvia: 88% Lituania: 86%partikulat Matter PM 2.5
Espoo 5 (Good)
Kenikmatan menghabiskan waktu di kota
Espoo 89%
Estonia: 90% Kepulauan Åland: 92% Swedia: 88% Latvia: 82% Lituania: 83%partikulat Matter PM10
Espoo 10 (Good)
Polusi udara
Espoo 6%
Estonia: 12% Kepulauan Åland: 17% Swedia: 15% Latvia: 29% Lituania: 26%Pembuangan sampah
Espoo 88%
Estonia: 79% Kepulauan Åland: 88% Swedia: 83% Latvia: 70% Lituania: 71%Ketersediaan dan kualitas air minum
Espoo 95%
Estonia: 90% Kepulauan Åland: 96% Swedia: 92% Latvia: 79% Lituania: 91%Kebersihan dan kerasnya
Espoo 79%
Estonia: 82% Kepulauan Åland: 83% Swedia: 76% Latvia: 72% Lituania: 78%Kebisingan dan polusi cahaya
Espoo 25%
Estonia: 31% Kepulauan Åland: 46% Swedia: 26% Latvia: 37% Lituania: 30%Polusi air
Espoo 17%
Estonia: 16% Kepulauan Åland: 10% Swedia: 15% Latvia: 28% Lituania: 24%SO2 -0.23 (Bagus)
sulfur dioksida (SO2)PM2,5 2.7 (Bagus)
partikulat Matter (PM 2.5) debuNO2 9.4 (Bagus)
nitrogen dioksida (NO2)PM10 3 (Bagus)
partikulat Matter (PM10) debu tersuspensiO3 36 (Bagus)
ozon (O3)PM2,5 8.1 (Bagus)
partikulat Matter (PM 2.5) debuPM10 11 (Bagus)
partikulat Matter (PM10) debu tersuspensiNO2 65 (Moderat)
nitrogen dioksida (NO2)Luukki
| index | 2024-01-17 | 2024-01-16 | 2024-01-15 | 2024-01-14 | 2024-01-13 | 2024-01-12 | 2024-01-11 | 2024-01-10 |
|---|---|---|---|---|---|---|---|---|
| o3 | 41 | 59 | 38 | 39 | 52 | 57 | 68 | 65 |
| so2 | -0.25 | 0.95 | 0.19 | 0.21 | 0.06 | 0.17 | -0.07 | 0.5 |
| pm10 | 3.6 | 2.8 | 6.6 | 6.8 | 4.7 | 3.3 | 1.8 | 1.2 |
| no2 | 6.4 | 3.5 | 7.7 | 7.3 | 5.3 | 6.2 | 1.4 | 1.3 |
| pm25 | 3.1 | 2.3 | 5.9 | 6.2 | 3.7 | 2.1 | 1 | 0.89 |
Leppävaara 4
| index | 2024-01-17 | 2024-01-16 | 2024-01-15 | 2024-01-14 | 2024-01-13 | 2024-01-12 | 2024-01-11 | 2024-01-10 |
|---|---|---|---|---|---|---|---|---|
| pm25 | 8.2 | 3.9 | 7.5 | 9.3 | 4.8 | 2.9 | 1.5 | 1.5 |
| pm10 | 15 | 5 | 9.3 | 10 | 6.3 | 5.1 | 2.7 | 2.4 |
| no2 | 35 | 20 | 20 | 21 | 16 | 19 | 13 | 12 |
FI00208
| index | 2020-05 | 2020-04 | 2020-03 | 2020-02 | 2020-01 | 2019-12 | 2019-11 | 2019-10 | 2019-09 | 2019-08 | 2019-07 | 2019-06 | 2019-05 | 2019-04 | 2019-03 | 2019-02 | 2019-01 | 2018-12 | 2018-11 | 2018-10 | 2018-09 | 2018-08 | 2018-07 | 2018-06 | 2018-05 | 2018-04 | 2018-03 | 2018-02 | 2018-01 | 2017-12 | 2017-11 | 2017-10 | 2017-09 |
|---|---|---|---|---|---|---|---|---|---|---|---|---|---|---|---|---|---|---|---|---|---|---|---|---|---|---|---|---|---|---|---|---|---|
| pm25 | 5.4 | 3.9 | 4.7 | 3.8 | 4 | 4.2 | 5.5 | 3.5 | 4 | 5.3 | 5.1 | 5.9 | 5.9 | 8.5 | 4.4 | 5 | 5.5 | 6.2 | 5.3 | 5.9 | 7.3 | 4.8 | 7.5 | 4.4 | 6.1 | 5.8 | 6.1 | 8.5 | 6.1 | 3.8 | 4.2 | 4 | 6.7 |
| so2 | 0.53 | 0.44 | 0.73 | 0.72 | 0.56 | 0.49 | 0.52 | 0.21 | 0.27 | 0.28 | 0.28 | 0.6 | 0.56 | 1.1 | 0.62 | 0.64 | 0.66 | 0.79 | 1.9 | 0.83 | 0.88 | 1.4 | 1.1 | 0.65 | 0.72 | 1.7 | 1.5 | 1.7 | 1.6 | 1.4 | 1.1 | 0.54 | 1.4 |
| no2 | 6.6 | 2 | 3.1 | 2.5 | 2.8 | 2.8 | 7.3 | 5 | 3.8 | 3.7 | 2.6 | 3.6 | 4.7 | 5.7 | 4.5 | 5 | 9.3 | 7.3 | 5 | 3.9 | 3.5 | 3.4 | 3.4 | 2.3 | 4.5 | 6.7 | 8.9 | 10 | 8.1 | 4.5 | 6 | 5.3 | 7.5 |
| o3 | 66 | 65 | 60 | 59 | 54 | 43 | 29 | 33 | 35 | 47 | 46 | 67 | 63 | 72 | 67 | 61 | 46 | 40 | 38 | 38 | 44 | 52 | 57 | 68 | 72 | 69 | 65 | 51 | 39 | 47 | 38 | 33 | 23 |
FI00841
| index | 2020-05 | 2020-04 | 2020-03 | 2020-02 | 2020-01 | 2019-12 | 2019-11 | 2019-10 | 2019-09 | 2019-08 | 2019-07 | 2019-06 | 2019-05 | 2019-04 | 2019-03 | 2019-02 | 2019-01 | 2018-12 | 2018-11 | 2018-10 | 2018-09 | 2018-08 | 2018-07 | 2018-06 | 2018-05 | 2018-04 | 2018-03 | 2018-02 | 2018-01 | 2017-12 | 2017-11 | 2017-10 | 2017-09 |
|---|---|---|---|---|---|---|---|---|---|---|---|---|---|---|---|---|---|---|---|---|---|---|---|---|---|---|---|---|---|---|---|---|---|
| pm10 | 13 | 13 | 23 | 19 | 9.6 | 7.8 | 22 | 9.2 | 12 | 13 | 12 | 14 | 18 | 55 | 23 | 9.9 | 9.3 | 11 | 22 | 15 | 15 | 14 | 17 | 12 | 25 | 40 | 36 | 28 | 14 | 7.3 | 13 | 11 | 17 |
| no2 | 6.4 | 6.7 | 14 | 14 | 16 | 18 | 18 | 17 | 16 | 16 | 12 | 15 | 20 | 30 | 20 | 22 | 33 | 21 | 24 | 21 | 20 | 20 | 16 | 12 | 23 | 28 | 32 | 33 | 23 | 20 | 25 | 19 | 20 |