Polusi udara di Tieling Shi: indeks kualitas udara real-time dan siaga asap.
Perkiraan kualitas polusi dan udara untuk Tieling Shi. Hari ini Selasa, 16 Juni 2026. Nilai polusi udara berikut telah tercatat untuk Tieling Shi:- partikulat Matter (PM10) debu tersuspensi - 7 (Bagus)
- partikulat Matter (PM 2.5) debu - 2 (Bagus)
- karbon monoksida (CO) - 100 (Bagus)
- nitrogen dioksida (NO2) - 8 (Bagus)
- ozon (O3) - 0 (Bagus)
- sulfur dioksida (SO2) - 9 (Bagus)

Apa kualitas udara di Tieling Shi hari ini? Apakah udara tercemar di Tieling Shi?. Apakah ada Smog?
Apa tingkat PM10 hari ini di Tieling Shi? (partikulat Matter (PM10) debu tersuspensi)
Level saat ini dari partikulat Matter PM10 di Tieling Shi adalah:
7 (Bagus)
Nilai PM10 tertinggi biasanya terjadi di bulan: 122 (Januari 2020).
Nilai terendah dari partikulat PM10 pencemaran Tieling Shi biasanya dicatat di: Agustus (31).
Apa tingkat saat PM 2,5 in Tieling Shi? (partikulat Matter (PM 2.5) debu)
Hari ini PM 2.5 tingkat:
2 (Bagus)
Sebagai perbandingan, tingkat tertinggi PM 2,5 in Tieling Shi dalam 7 hari terakhir adalah: 24 (Jumat, 27 Mei 2022) dan Terendah: 24 (Jumat, 27 Mei 2022).
Nilai tertinggi PM 2.5 direkam: 100 (Januari 2020).
Tingkat terendah dari partikulat Matter PM 2.5 polusi terjadi di bulan: Agustus (15).
Seberapa tinggi tingkat CO? (karbon monoksida (CO))
100 (Bagus)
Seberapa tinggi tingkat NO2? (nitrogen dioksida (NO2))
8 (Bagus)
Bagaimana tingkat O3 hari ini di Tieling Shi? (ozon (O3))
0 (Bagus)
Apa tingkat polusi SO2? (sulfur dioksida (SO2))
9 (Bagus)
Data saat ini Jumat, 27 Mei 2022 12.00
PM10 7 (Bagus)
PM2,5 2 (Bagus)
CO 100 (Bagus)
NO2 8 (Bagus)
O3 0 (Bagus)
SO2 9 (Bagus)
Data tentang polusi udara dari beberapa hari terakhir di Tieling Shi
index
2022-05-27
pm10
32
Moderate
pm25
24
Moderate
co
468
Good
no2
21
Good
o3
32
Good
so2
5
Good
data source »
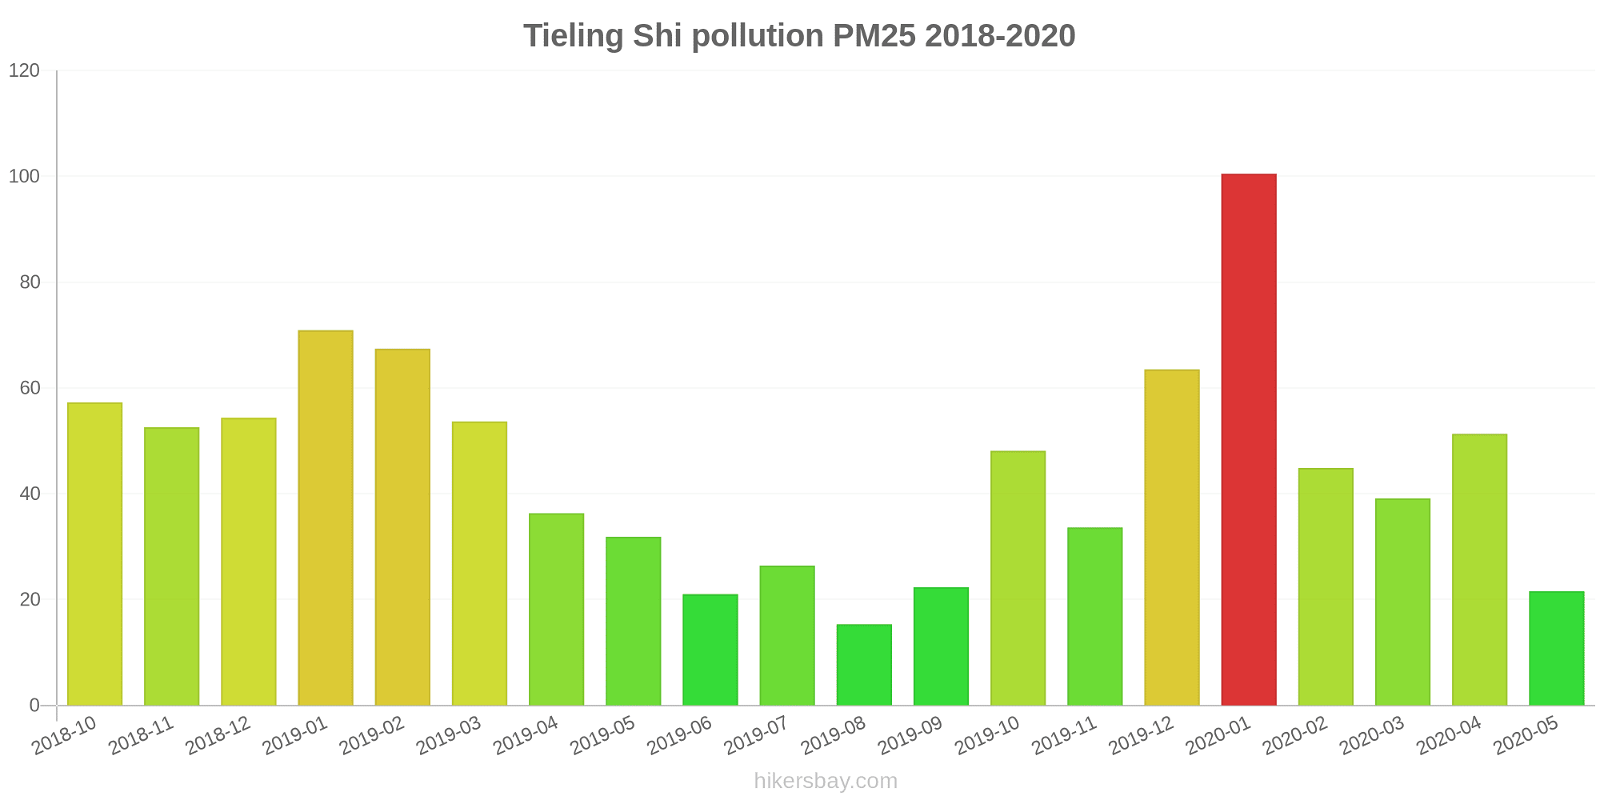
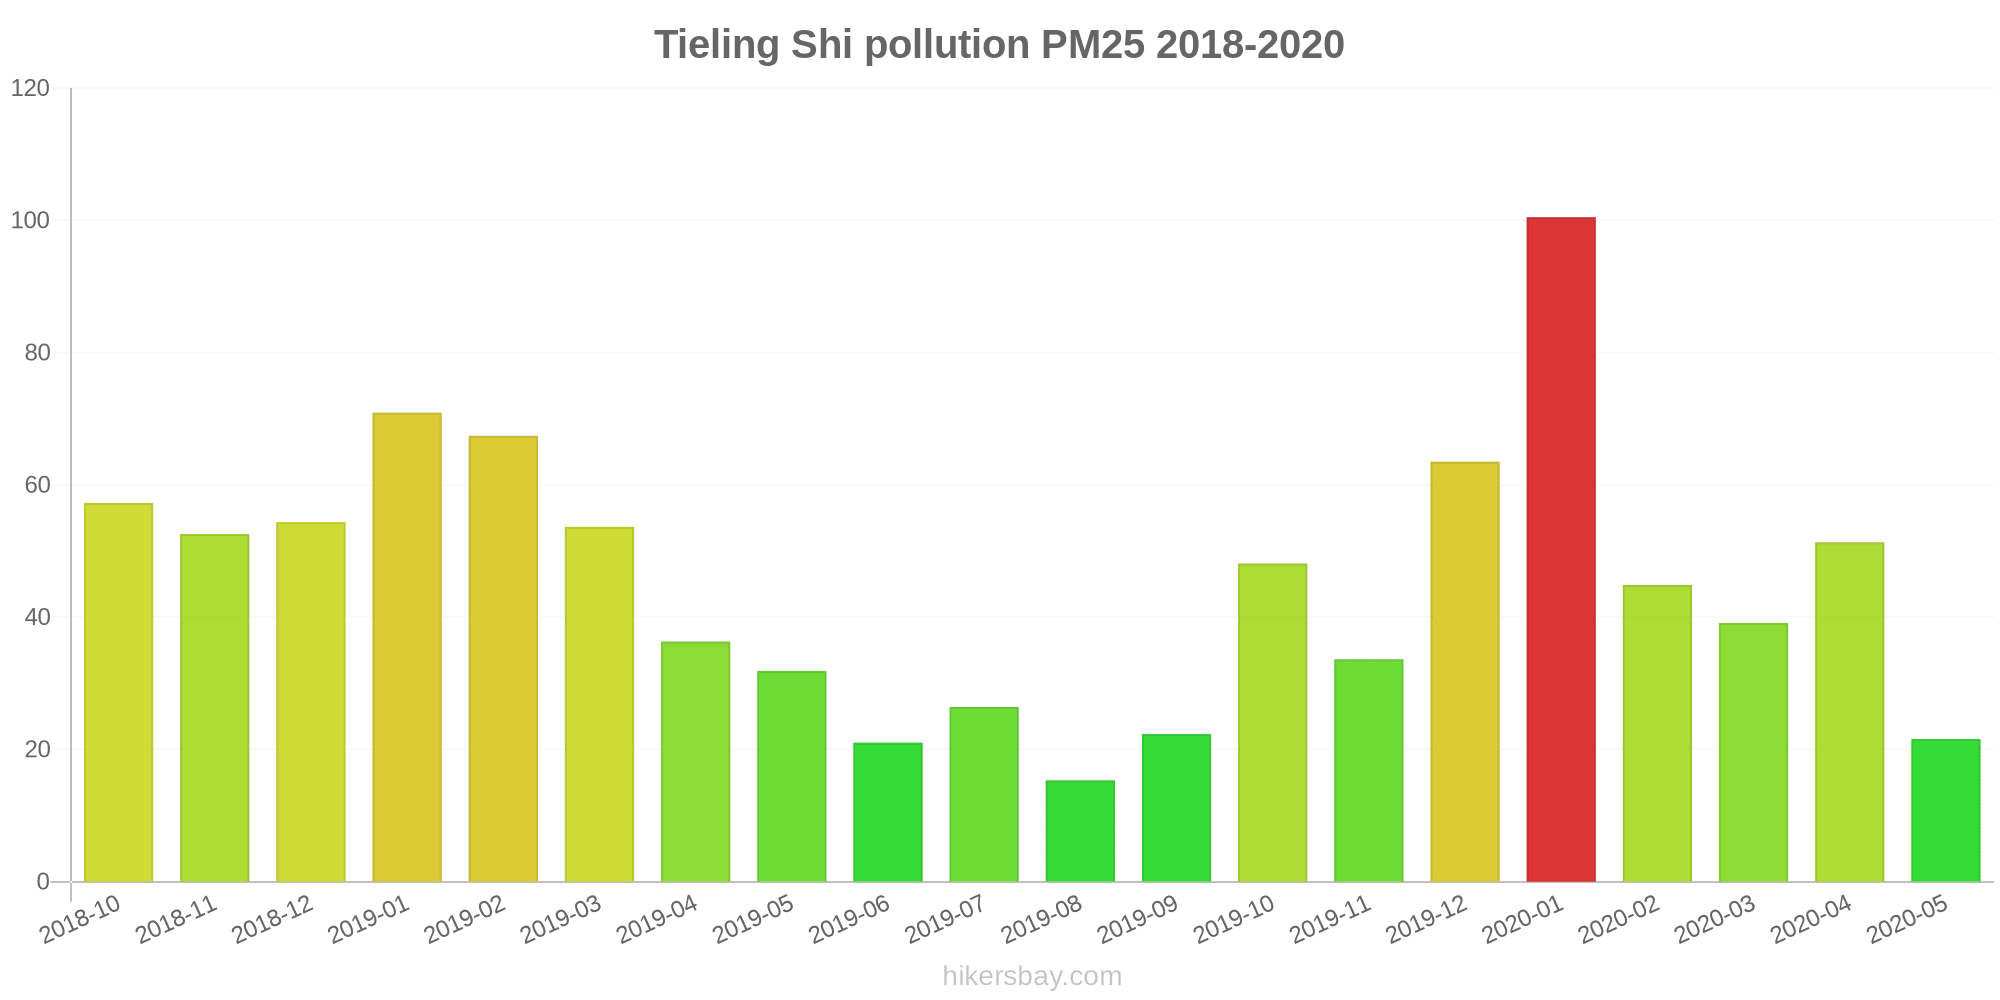
Polusi udara di Tieling Shi dari Oktober 2018 ke Mei 2020
index
2020-05
2020-04
2020-03
2020-02
2020-01
2019-12
2019-11
2019-10
2019-09
2019-08
2019-07
2019-06
2019-05
2019-04
2019-03
2019-02
2019-01
2018-12
2018-11
2018-10
pm25
22 (Moderate)
51 (Unhealthy for Sensitive Groups)
39 (Unhealthy for Sensitive Groups)
45 (Unhealthy for Sensitive Groups)
100 (Very Unhealthy)
64 (Unhealthy)
34 (Moderate)
48 (Unhealthy for Sensitive Groups)
22 (Moderate)
15 (Moderate)
26 (Moderate)
21 (Moderate)
32 (Moderate)
36 (Unhealthy for Sensitive Groups)
54 (Unhealthy for Sensitive Groups)
67 (Unhealthy)
71 (Unhealthy)
54 (Unhealthy for Sensitive Groups)
53 (Unhealthy for Sensitive Groups)
57 (Unhealthy)
co
401 (Good)
469 (Good)
479 (Good)
670 (Good)
493 (Good)
805 (Good)
476 (Good)
529 (Good)
555 (Good)
383 (Good)
461 (Good)
546 (Good)
430 (Good)
630 (Good)
680 (Good)
737 (Good)
344 (Good)
915 (Good)
830 (Good)
290 (Good)
no2
20 (Good)
27 (Good)
23 (Good)
19 (Good)
36 (Good)
35 (Good)
27 (Good)
33 (Good)
22 (Good)
15 (Good)
24 (Good)
28 (Good)
24 (Good)
30 (Good)
36 (Good)
36 (Good)
38 (Good)
33 (Good)
35 (Good)
33 (Good)
o3
131 (Unhealthy for Sensitive Groups)
128 (Unhealthy for Sensitive Groups)
103 (Moderate)
88 (Moderate)
79 (Moderate)
60 (Good)
56 (Good)
93 (Moderate)
110 (Moderate)
94 (Moderate)
163 (Unhealthy)
149 (Unhealthy for Sensitive Groups)
146 (Unhealthy for Sensitive Groups)
116 (Moderate)
110 (Moderate)
85 (Moderate)
63 (Good)
54 (Good)
59 (Good)
81 (Moderate)
pm10
80 (Unhealthy for Sensitive Groups)
99 (Unhealthy)
71 (Unhealthy for Sensitive Groups)
65 (Unhealthy for Sensitive Groups)
122 (Very Unhealthy)
83 (Unhealthy)
68 (Unhealthy for Sensitive Groups)
99 (Unhealthy)
60 (Unhealthy for Sensitive Groups)
31 (Moderate)
53 (Unhealthy for Sensitive Groups)
50 (Unhealthy for Sensitive Groups)
82 (Unhealthy)
116 (Very Unhealthy)
103 (Unhealthy)
95 (Unhealthy)
114 (Very Unhealthy)
83 (Unhealthy)
85 (Unhealthy)
78 (Unhealthy for Sensitive Groups)
so2
7.8 (Good)
10 (Good)
10 (Good)
11 (Good)
16 (Good)
14 (Good)
11 (Good)
9.8 (Good)
8 (Good)
6 (Good)
8.1 (Good)
9 (Good)
9.3 (Good)
10 (Good)
14 (Good)
21 (Good)
22 (Good)
19 (Good)
15 (Good)
12 (Good)
data source »
水上乐园
Jumat, 27 Mei 2022 12.00
PM10 6.7 (Bagus)
partikulat Matter (PM10) debu tersuspensi
PM2,5 1.7 (Bagus)
partikulat Matter (PM 2.5) debu
CO 100 (Bagus)
karbon monoksida (CO)
NO2 7.6 (Bagus)
nitrogen dioksida (NO2)
O3 0.02 (Bagus)
ozon (O3)
SO2 8.6 (Bagus)
sulfur dioksida (SO2)
银州路东段
Jumat, 27 Mei 2022 12.00
PM10 6.7 (Bagus)
partikulat Matter (PM10) debu tersuspensi
PM2,5 1.7 (Bagus)
partikulat Matter (PM 2.5) debu
CO 100 (Bagus)
karbon monoksida (CO)
NO2 7.6 (Bagus)
nitrogen dioksida (NO2)
O3 0.02 (Bagus)
ozon (O3)
SO2 8.6 (Bagus)
sulfur dioksida (SO2)
水上乐园
index
2022-05-27
pm10
32
pm25
24
co
468
no2
21
o3
32
so2
4.6
银州路东段
index
2022-05-27
pm10
32
pm25
24
co
468
no2
21
o3
32
so2
4.6
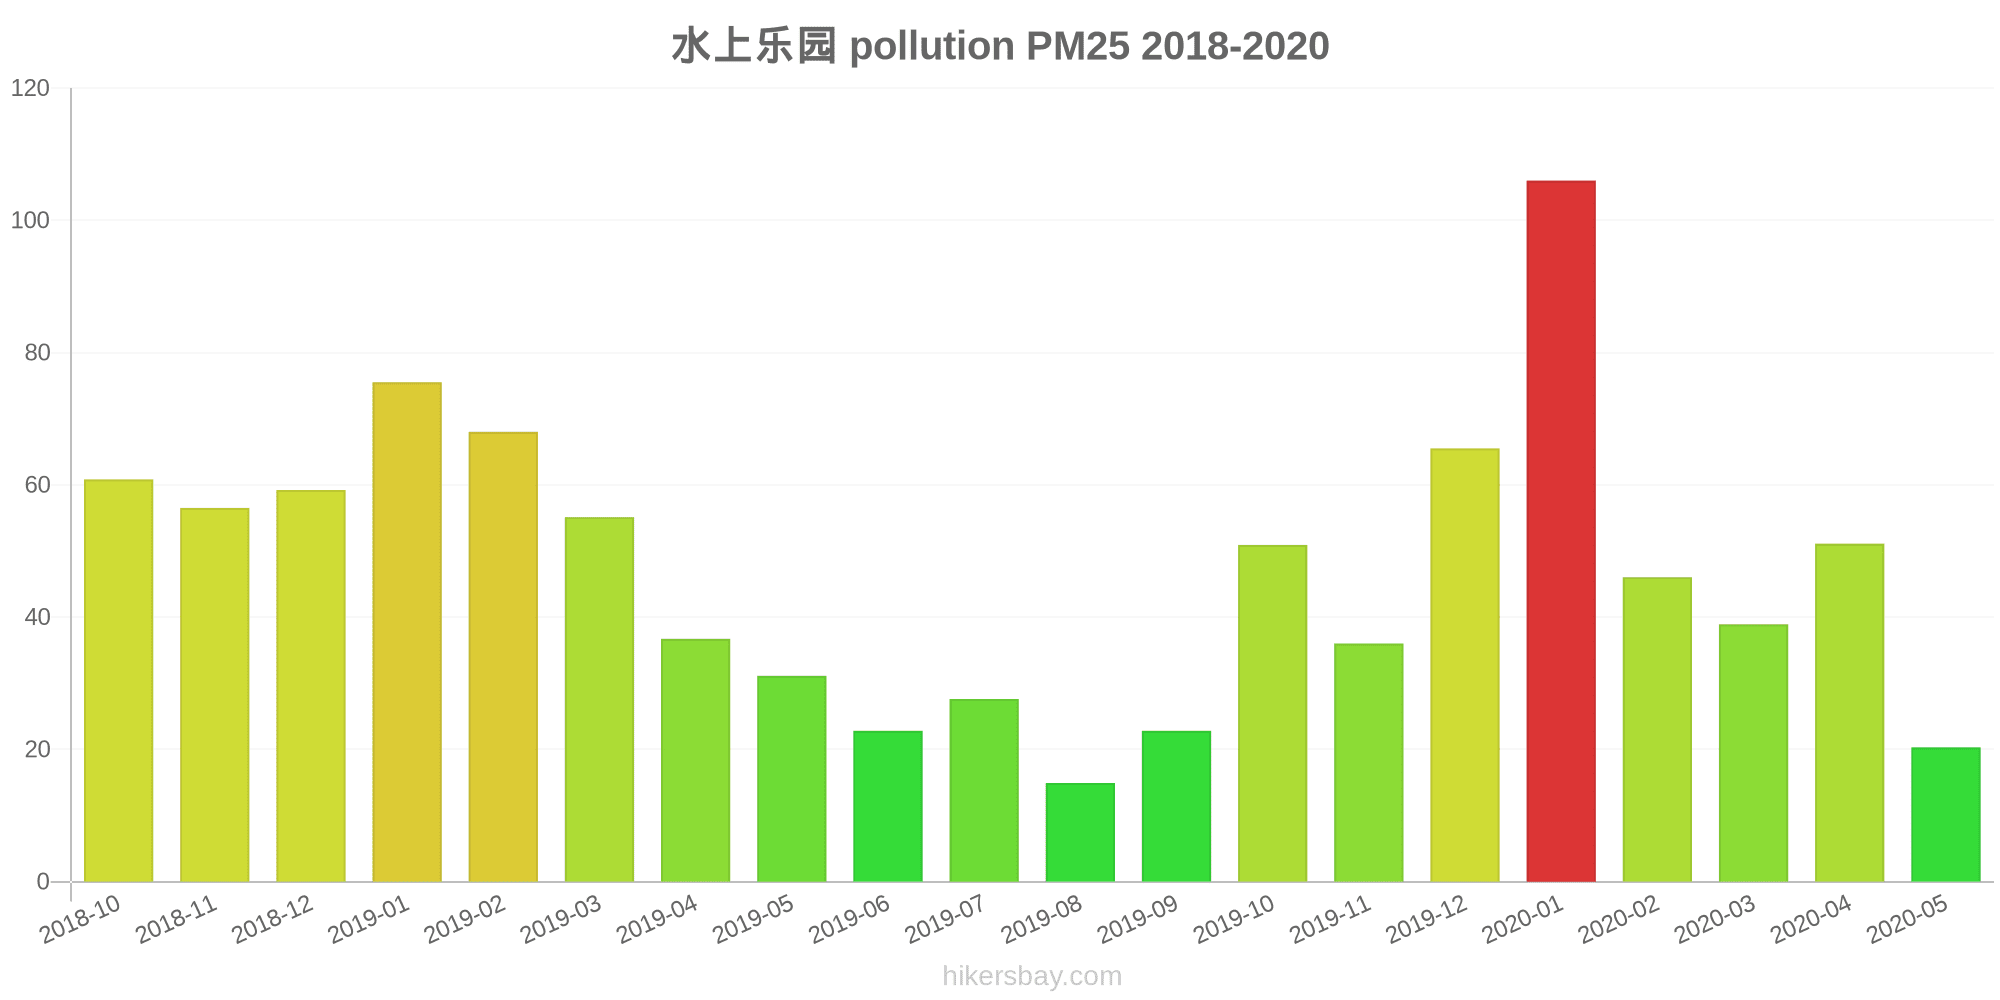
水上乐园
2018-10 2020-05

index
2020-05
2020-04
2020-03
2020-02
2020-01
2019-12
2019-11
2019-10
2019-09
2019-08
2019-07
2019-06
2019-05
2019-04
2019-03
2019-02
2019-01
2018-12
2018-11
2018-10
pm25
20
51
39
46
106
66
36
51
23
15
28
23
31
37
55
68
76
59
57
61
co
358
395
435
711
1
912
537
618
665
416
471
568
431
664
763
881
1
864
825
1
no2
20
29
24
21
36
34
26
37
24
16
26
31
29
33
39
39
38
31
34
33
o3
133
129
103
89
82
61
50
88
112
94
165
154
153
120
113
88
72
63
64
87
pm10
69
87
62
57
119
79
72
119
64
33
59
52
79
106
94
93
112
83
88
76
so2
8.1
10
11
12
19
15
12
11
8.8
6
8.9
11
9.8
10
17
26
27
21
18
14
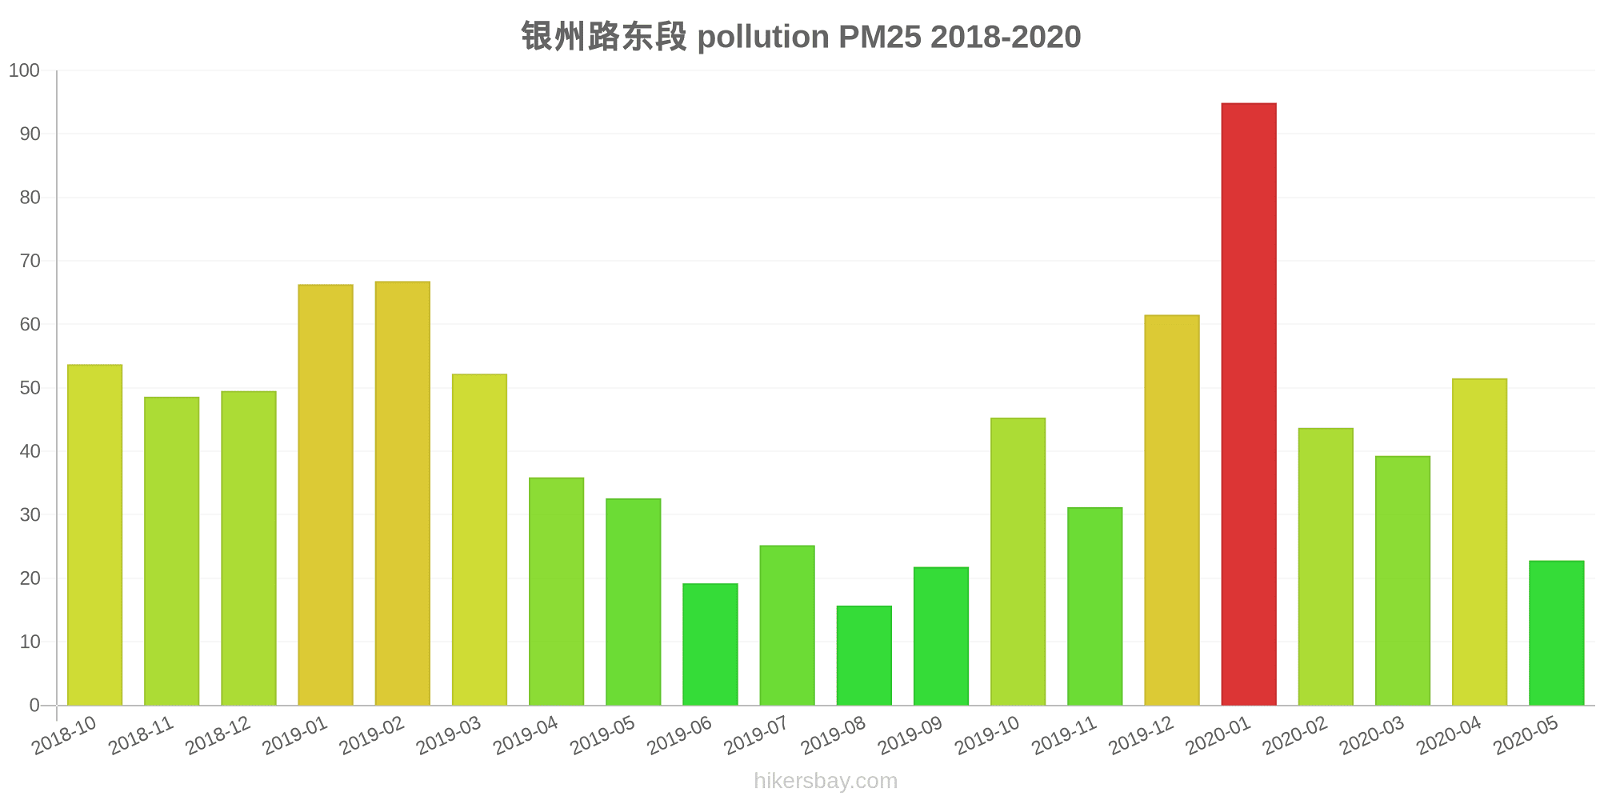
银州路东段
2018-10 2020-05
index
2020-05
2020-04
2020-03
2020-02
2020-01
2019-12
2019-11
2019-10
2019-09
2019-08
2019-07
2019-06
2019-05
2019-04
2019-03
2019-02
2019-01
2018-12
2018-11
2018-10
pm25
23
52
39
44
95
62
31
45
22
16
25
19
33
36
52
67
66
50
49
54
co
444
543
523
629
985
697
414
439
445
350
450
524
428
596
596
593
687
965
835
579
no2
19
25
21
18
36
36
28
29
21
15
21
25
19
26
33
33
38
35
37
34
o3
128
127
102
86
75
60
62
98
108
95
161
143
138
111
107
82
55
46
54
76
pm10
90
111
80
72
125
87
65
80
56
29
47
49
86
125
112
98
116
83
82
79
so2
7.5
9.6
10
11
14
12
10
9
7.3
6
7.3
7.5
8.9
10
12
17
17
16
12
8.9
* Pollution data source:
https://openaq.org
(ChinaAQIData)
The data is licensed under CC-By 4.0
PM10 7 (Bagus)
PM2,5 2 (Bagus)
CO 100 (Bagus)
NO2 8 (Bagus)
O3 0 (Bagus)
SO2 9 (Bagus)
Data tentang polusi udara dari beberapa hari terakhir di Tieling Shi
| index | 2022-05-27 |
|---|---|
| pm10 | 32 Moderate |
| pm25 | 24 Moderate |
| co | 468 Good |
| no2 | 21 Good |
| o3 | 32 Good |
| so2 | 5 Good |
| index | 2020-05 | 2020-04 | 2020-03 | 2020-02 | 2020-01 | 2019-12 | 2019-11 | 2019-10 | 2019-09 | 2019-08 | 2019-07 | 2019-06 | 2019-05 | 2019-04 | 2019-03 | 2019-02 | 2019-01 | 2018-12 | 2018-11 | 2018-10 |
|---|---|---|---|---|---|---|---|---|---|---|---|---|---|---|---|---|---|---|---|---|
| pm25 | 22 (Moderate) | 51 (Unhealthy for Sensitive Groups) | 39 (Unhealthy for Sensitive Groups) | 45 (Unhealthy for Sensitive Groups) | 100 (Very Unhealthy) | 64 (Unhealthy) | 34 (Moderate) | 48 (Unhealthy for Sensitive Groups) | 22 (Moderate) | 15 (Moderate) | 26 (Moderate) | 21 (Moderate) | 32 (Moderate) | 36 (Unhealthy for Sensitive Groups) | 54 (Unhealthy for Sensitive Groups) | 67 (Unhealthy) | 71 (Unhealthy) | 54 (Unhealthy for Sensitive Groups) | 53 (Unhealthy for Sensitive Groups) | 57 (Unhealthy) |
| co | 401 (Good) | 469 (Good) | 479 (Good) | 670 (Good) | 493 (Good) | 805 (Good) | 476 (Good) | 529 (Good) | 555 (Good) | 383 (Good) | 461 (Good) | 546 (Good) | 430 (Good) | 630 (Good) | 680 (Good) | 737 (Good) | 344 (Good) | 915 (Good) | 830 (Good) | 290 (Good) |
| no2 | 20 (Good) | 27 (Good) | 23 (Good) | 19 (Good) | 36 (Good) | 35 (Good) | 27 (Good) | 33 (Good) | 22 (Good) | 15 (Good) | 24 (Good) | 28 (Good) | 24 (Good) | 30 (Good) | 36 (Good) | 36 (Good) | 38 (Good) | 33 (Good) | 35 (Good) | 33 (Good) |
| o3 | 131 (Unhealthy for Sensitive Groups) | 128 (Unhealthy for Sensitive Groups) | 103 (Moderate) | 88 (Moderate) | 79 (Moderate) | 60 (Good) | 56 (Good) | 93 (Moderate) | 110 (Moderate) | 94 (Moderate) | 163 (Unhealthy) | 149 (Unhealthy for Sensitive Groups) | 146 (Unhealthy for Sensitive Groups) | 116 (Moderate) | 110 (Moderate) | 85 (Moderate) | 63 (Good) | 54 (Good) | 59 (Good) | 81 (Moderate) |
| pm10 | 80 (Unhealthy for Sensitive Groups) | 99 (Unhealthy) | 71 (Unhealthy for Sensitive Groups) | 65 (Unhealthy for Sensitive Groups) | 122 (Very Unhealthy) | 83 (Unhealthy) | 68 (Unhealthy for Sensitive Groups) | 99 (Unhealthy) | 60 (Unhealthy for Sensitive Groups) | 31 (Moderate) | 53 (Unhealthy for Sensitive Groups) | 50 (Unhealthy for Sensitive Groups) | 82 (Unhealthy) | 116 (Very Unhealthy) | 103 (Unhealthy) | 95 (Unhealthy) | 114 (Very Unhealthy) | 83 (Unhealthy) | 85 (Unhealthy) | 78 (Unhealthy for Sensitive Groups) |
| so2 | 7.8 (Good) | 10 (Good) | 10 (Good) | 11 (Good) | 16 (Good) | 14 (Good) | 11 (Good) | 9.8 (Good) | 8 (Good) | 6 (Good) | 8.1 (Good) | 9 (Good) | 9.3 (Good) | 10 (Good) | 14 (Good) | 21 (Good) | 22 (Good) | 19 (Good) | 15 (Good) | 12 (Good) |
PM10 6.7 (Bagus)
partikulat Matter (PM10) debu tersuspensiPM2,5 1.7 (Bagus)
partikulat Matter (PM 2.5) debuCO 100 (Bagus)
karbon monoksida (CO)NO2 7.6 (Bagus)
nitrogen dioksida (NO2)O3 0.02 (Bagus)
ozon (O3)SO2 8.6 (Bagus)
sulfur dioksida (SO2)PM10 6.7 (Bagus)
partikulat Matter (PM10) debu tersuspensiPM2,5 1.7 (Bagus)
partikulat Matter (PM 2.5) debuCO 100 (Bagus)
karbon monoksida (CO)NO2 7.6 (Bagus)
nitrogen dioksida (NO2)O3 0.02 (Bagus)
ozon (O3)SO2 8.6 (Bagus)
sulfur dioksida (SO2)水上乐园
| index | 2022-05-27 |
|---|---|
| pm10 | 32 |
| pm25 | 24 |
| co | 468 |
| no2 | 21 |
| o3 | 32 |
| so2 | 4.6 |
银州路东段
| index | 2022-05-27 |
|---|---|
| pm10 | 32 |
| pm25 | 24 |
| co | 468 |
| no2 | 21 |
| o3 | 32 |
| so2 | 4.6 |
水上乐园
| index | 2020-05 | 2020-04 | 2020-03 | 2020-02 | 2020-01 | 2019-12 | 2019-11 | 2019-10 | 2019-09 | 2019-08 | 2019-07 | 2019-06 | 2019-05 | 2019-04 | 2019-03 | 2019-02 | 2019-01 | 2018-12 | 2018-11 | 2018-10 |
|---|---|---|---|---|---|---|---|---|---|---|---|---|---|---|---|---|---|---|---|---|
| pm25 | 20 | 51 | 39 | 46 | 106 | 66 | 36 | 51 | 23 | 15 | 28 | 23 | 31 | 37 | 55 | 68 | 76 | 59 | 57 | 61 |
| co | 358 | 395 | 435 | 711 | 1 | 912 | 537 | 618 | 665 | 416 | 471 | 568 | 431 | 664 | 763 | 881 | 1 | 864 | 825 | 1 |
| no2 | 20 | 29 | 24 | 21 | 36 | 34 | 26 | 37 | 24 | 16 | 26 | 31 | 29 | 33 | 39 | 39 | 38 | 31 | 34 | 33 |
| o3 | 133 | 129 | 103 | 89 | 82 | 61 | 50 | 88 | 112 | 94 | 165 | 154 | 153 | 120 | 113 | 88 | 72 | 63 | 64 | 87 |
| pm10 | 69 | 87 | 62 | 57 | 119 | 79 | 72 | 119 | 64 | 33 | 59 | 52 | 79 | 106 | 94 | 93 | 112 | 83 | 88 | 76 |
| so2 | 8.1 | 10 | 11 | 12 | 19 | 15 | 12 | 11 | 8.8 | 6 | 8.9 | 11 | 9.8 | 10 | 17 | 26 | 27 | 21 | 18 | 14 |
银州路东段

| index | 2020-05 | 2020-04 | 2020-03 | 2020-02 | 2020-01 | 2019-12 | 2019-11 | 2019-10 | 2019-09 | 2019-08 | 2019-07 | 2019-06 | 2019-05 | 2019-04 | 2019-03 | 2019-02 | 2019-01 | 2018-12 | 2018-11 | 2018-10 |
|---|---|---|---|---|---|---|---|---|---|---|---|---|---|---|---|---|---|---|---|---|
| pm25 | 23 | 52 | 39 | 44 | 95 | 62 | 31 | 45 | 22 | 16 | 25 | 19 | 33 | 36 | 52 | 67 | 66 | 50 | 49 | 54 |
| co | 444 | 543 | 523 | 629 | 985 | 697 | 414 | 439 | 445 | 350 | 450 | 524 | 428 | 596 | 596 | 593 | 687 | 965 | 835 | 579 |
| no2 | 19 | 25 | 21 | 18 | 36 | 36 | 28 | 29 | 21 | 15 | 21 | 25 | 19 | 26 | 33 | 33 | 38 | 35 | 37 | 34 |
| o3 | 128 | 127 | 102 | 86 | 75 | 60 | 62 | 98 | 108 | 95 | 161 | 143 | 138 | 111 | 107 | 82 | 55 | 46 | 54 | 76 |
| pm10 | 90 | 111 | 80 | 72 | 125 | 87 | 65 | 80 | 56 | 29 | 47 | 49 | 86 | 125 | 112 | 98 | 116 | 83 | 82 | 79 |
| so2 | 7.5 | 9.6 | 10 | 11 | 14 | 12 | 10 | 9 | 7.3 | 6 | 7.3 | 7.5 | 8.9 | 10 | 12 | 17 | 17 | 16 | 12 | 8.9 |