Polusi udara di Shisanhucun: indeks kualitas udara real-time dan siaga asap.
Perkiraan kualitas polusi dan udara untuk Shisanhucun. Hari ini Selasa, 16 Juni 2026. Nilai polusi udara berikut telah tercatat untuk Shisanhucun:- partikulat Matter (PM 2.5) debu - 22 (Moderat)
- karbon monoksida (CO) - 219 (Bagus)
- ozon (O3) - 0 (Bagus)
- nitrogen dioksida (NO2) - 7 (Bagus)
- partikulat Matter (PM10) debu tersuspensi - 36 (Moderat)
- sulfur dioksida (SO2) - 8 (Bagus)

Apa kualitas udara di Shisanhucun hari ini? Apakah udara tercemar di Shisanhucun?. Apakah ada Smog?
Apa tingkat saat PM 2,5 in Shisanhucun? (partikulat Matter (PM 2.5) debu)
Hari ini PM 2.5 tingkat:
22 (Moderat)
Sebagai perbandingan, tingkat tertinggi PM 2,5 in Shisanhucun dalam 7 hari terakhir adalah: 23 (Jumat, 27 Mei 2022) dan Terendah: 23 (Jumat, 27 Mei 2022).
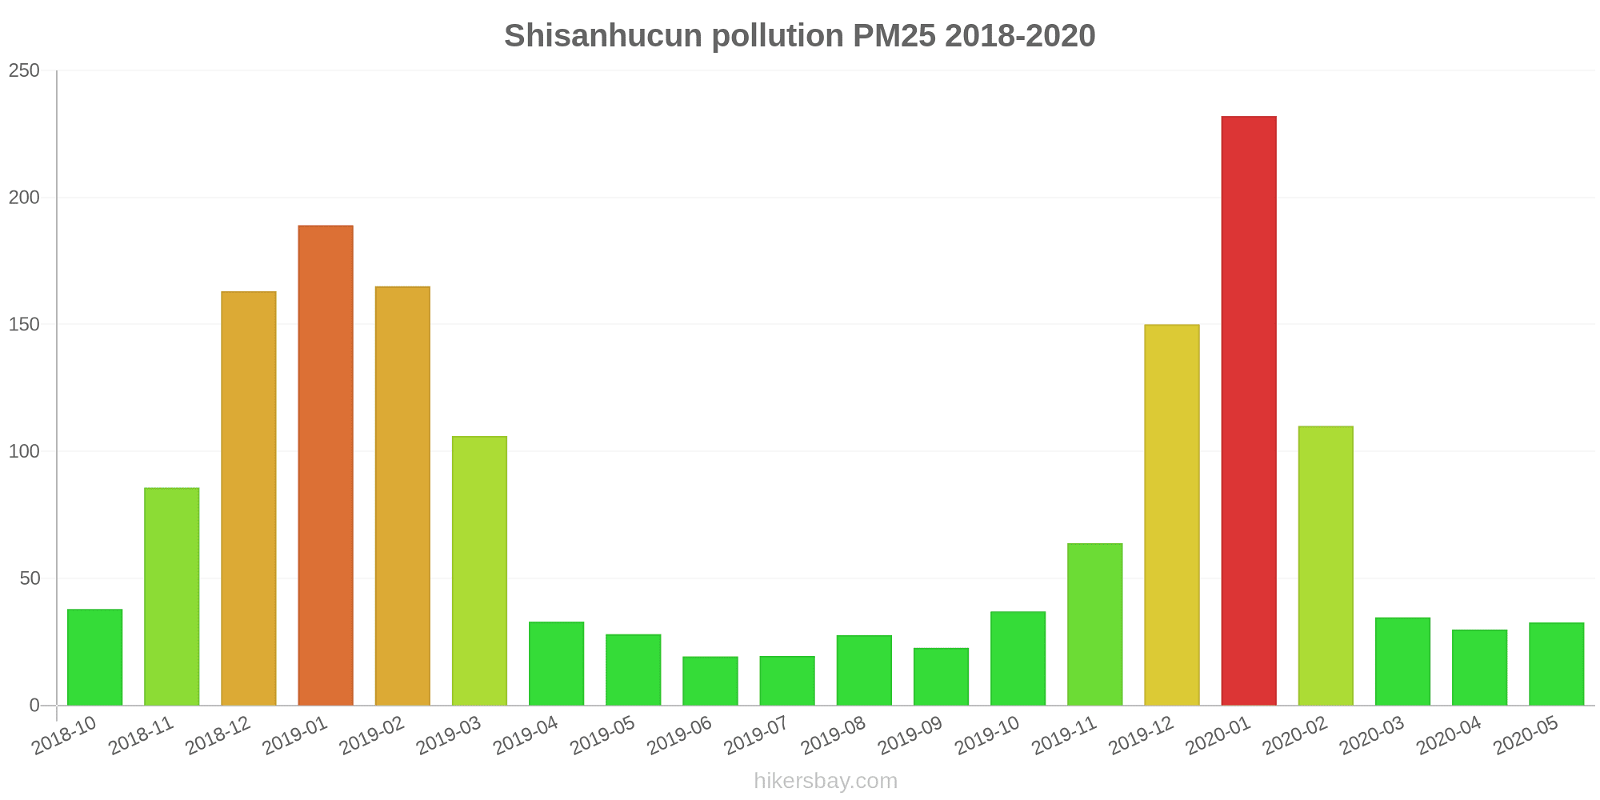
Nilai tertinggi PM 2.5 direkam: 232 (Januari 2020).
Tingkat terendah dari partikulat Matter PM 2.5 polusi terjadi di bulan: Juni (19).
Seberapa tinggi tingkat CO? (karbon monoksida (CO))
219 (Bagus)
Bagaimana tingkat O3 hari ini di Shisanhucun? (ozon (O3))
0 (Bagus)
Seberapa tinggi tingkat NO2? (nitrogen dioksida (NO2))
7 (Bagus)
Apa tingkat PM10 hari ini di Shisanhucun? (partikulat Matter (PM10) debu tersuspensi)
Level saat ini dari partikulat Matter PM10 di Shisanhucun adalah:
36 (Moderat)
Nilai PM10 tertinggi biasanya terjadi di bulan: 266 (Desember 2018).
Nilai terendah dari partikulat PM10 pencemaran Shisanhucun biasanya dicatat di: Juni (43).
Apa tingkat polusi SO2? (sulfur dioksida (SO2))
8 (Bagus)
Data saat ini Jumat, 27 Mei 2022 15.00
PM2,5 22 (Moderat)
CO 219 (Bagus)
O3 0 (Bagus)
NO2 7 (Bagus)
PM10 36 (Moderat)
SO2 8 (Bagus)
Data tentang polusi udara dari beberapa hari terakhir di Shisanhucun
index
2022-05-27
pm25
23
Moderate
co
475
Good
o3
25
Good
no2
21
Good
pm10
32
Moderate
so2
4
Good
data source »
Polusi udara di Shisanhucun dari Oktober 2018 ke Mei 2020
index
2020-05
2020-04
2020-03
2020-02
2020-01
2019-12
2019-11
2019-10
2019-09
2019-08
2019-07
2019-06
2019-05
2019-04
2019-03
2019-02
2019-01
2018-12
2018-11
2018-10
co
498 (Good)
645 (Good)
975 (Good)
1 (Good)
2 (Good)
2 (Good)
1 (Good)
869 (Good)
535 (Good)
553 (Good)
484 (Good)
471 (Good)
391 (Good)
402 (Good)
1 (Good)
1 (Good)
2 (Good)
1 (Good)
1 (Good)
1 (Good)
no2
22 (Good)
25 (Good)
25 (Good)
38 (Good)
59 (Moderate)
56 (Moderate)
39 (Good)
38 (Good)
30 (Good)
26 (Good)
24 (Good)
19 (Good)
20 (Good)
23 (Good)
34 (Good)
44 (Moderate)
54 (Moderate)
55 (Moderate)
40 (Moderate)
36 (Good)
o3
125 (Unhealthy for Sensitive Groups)
129 (Unhealthy for Sensitive Groups)
102 (Moderate)
119 (Moderate)
71 (Moderate)
35 (Good)
51 (Good)
91 (Moderate)
124 (Unhealthy for Sensitive Groups)
139 (Unhealthy for Sensitive Groups)
151 (Unhealthy)
129 (Unhealthy for Sensitive Groups)
124 (Unhealthy for Sensitive Groups)
114 (Moderate)
110 (Moderate)
101 (Moderate)
69 (Good)
50 (Good)
64 (Good)
70 (Good)
pm10
69 (Unhealthy for Sensitive Groups)
138 (Very Unhealthy)
58 (Unhealthy for Sensitive Groups)
113 (Very Unhealthy)
215 (Very bad Hazardous)
175 (Very bad Hazardous)
101 (Unhealthy)
89 (Unhealthy)
78 (Unhealthy for Sensitive Groups)
67 (Unhealthy for Sensitive Groups)
64 (Unhealthy for Sensitive Groups)
43 (Moderate)
64 (Unhealthy for Sensitive Groups)
69 (Unhealthy for Sensitive Groups)
129 (Very Unhealthy)
177 (Very bad Hazardous)
228 (Very bad Hazardous)
266 (Very bad Hazardous)
195 (Very bad Hazardous)
65 (Unhealthy for Sensitive Groups)
so2
5.6 (Good)
7.2 (Good)
6.5 (Good)
13 (Good)
14 (Good)
12 (Good)
15 (Good)
15 (Good)
12 (Good)
9.6 (Good)
8.4 (Good)
7.2 (Good)
8.7 (Good)
7.7 (Good)
13 (Good)
15 (Good)
17 (Good)
12 (Good)
15 (Good)
13 (Good)
pm25
33 (Moderate)
30 (Moderate)
35 (Moderate)
110 (Very bad Hazardous)
232 (Very bad Hazardous)
150 (Very bad Hazardous)
64 (Unhealthy)
37 (Unhealthy for Sensitive Groups)
23 (Moderate)
28 (Moderate)
19 (Moderate)
19 (Moderate)
28 (Moderate)
33 (Moderate)
106 (Very Unhealthy)
165 (Very bad Hazardous)
189 (Very bad Hazardous)
163 (Very bad Hazardous)
86 (Very Unhealthy)
38 (Unhealthy for Sensitive Groups)
data source »
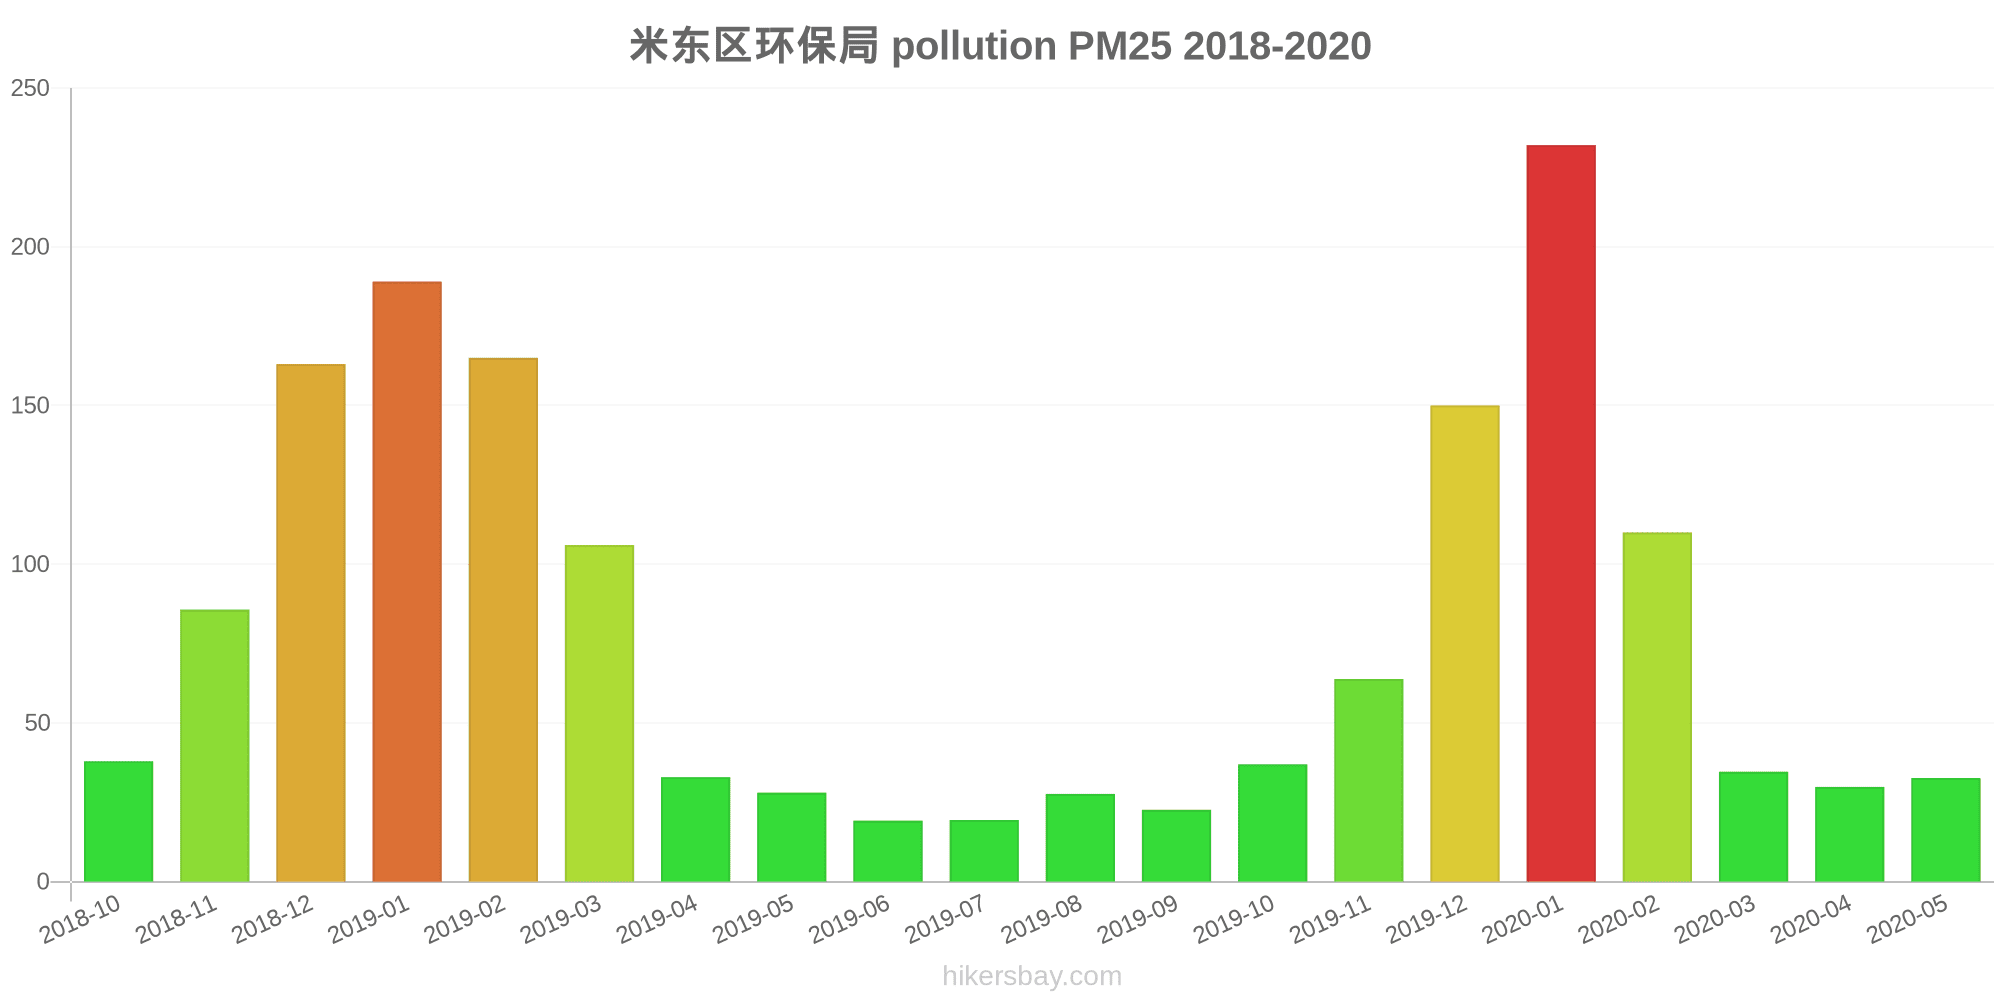
米东区环保局
Jumat, 27 Mei 2022 15.00
PM2,5 22 (Moderat)
partikulat Matter (PM 2.5) debu
CO 219 (Bagus)
karbon monoksida (CO)
O3 0.05 (Bagus)
ozon (O3)
NO2 7 (Bagus)
nitrogen dioksida (NO2)
PM10 36 (Moderat)
partikulat Matter (PM10) debu tersuspensi
SO2 7.7 (Bagus)
sulfur dioksida (SO2)
米东区环保局
index
2022-05-27
pm25
23
co
475
o3
25
no2
21
pm10
32
so2
4.4
米东区环保局
2018-10 2020-05

index
2020-05
2020-04
2020-03
2020-02
2020-01
2019-12
2019-11
2019-10
2019-09
2019-08
2019-07
2019-06
2019-05
2019-04
2019-03
2019-02
2019-01
2018-12
2018-11
2018-10
pm25
33
30
35
110
232
150
64
37
23
28
19
19
28
33
106
165
189
163
86
38
co
498
645
975
1
2
2
1
869
535
553
484
471
391
402
1
1
2
1
1
1
no2
22
25
25
38
59
56
39
38
30
26
24
19
20
23
34
44
54
55
40
36
o3
125
129
102
119
71
35
51
91
124
139
151
129
124
114
110
101
69
50
64
70
so2
5.6
7.2
6.5
13
14
12
15
15
12
9.6
8.4
7.2
8.7
7.7
13
15
17
12
15
13
pm10
69
138
58
113
215
175
101
89
78
67
64
43
64
69
129
177
228
266
195
65
* Pollution data source:
https://openaq.org
(ChinaAQIData)
The data is licensed under CC-By 4.0
PM2,5 22 (Moderat)
CO 219 (Bagus)
O3 0 (Bagus)
NO2 7 (Bagus)
PM10 36 (Moderat)
SO2 8 (Bagus)
Data tentang polusi udara dari beberapa hari terakhir di Shisanhucun
| index | 2022-05-27 |
|---|---|
| pm25 | 23 Moderate |
| co | 475 Good |
| o3 | 25 Good |
| no2 | 21 Good |
| pm10 | 32 Moderate |
| so2 | 4 Good |

| index | 2020-05 | 2020-04 | 2020-03 | 2020-02 | 2020-01 | 2019-12 | 2019-11 | 2019-10 | 2019-09 | 2019-08 | 2019-07 | 2019-06 | 2019-05 | 2019-04 | 2019-03 | 2019-02 | 2019-01 | 2018-12 | 2018-11 | 2018-10 |
|---|---|---|---|---|---|---|---|---|---|---|---|---|---|---|---|---|---|---|---|---|
| co | 498 (Good) | 645 (Good) | 975 (Good) | 1 (Good) | 2 (Good) | 2 (Good) | 1 (Good) | 869 (Good) | 535 (Good) | 553 (Good) | 484 (Good) | 471 (Good) | 391 (Good) | 402 (Good) | 1 (Good) | 1 (Good) | 2 (Good) | 1 (Good) | 1 (Good) | 1 (Good) |
| no2 | 22 (Good) | 25 (Good) | 25 (Good) | 38 (Good) | 59 (Moderate) | 56 (Moderate) | 39 (Good) | 38 (Good) | 30 (Good) | 26 (Good) | 24 (Good) | 19 (Good) | 20 (Good) | 23 (Good) | 34 (Good) | 44 (Moderate) | 54 (Moderate) | 55 (Moderate) | 40 (Moderate) | 36 (Good) |
| o3 | 125 (Unhealthy for Sensitive Groups) | 129 (Unhealthy for Sensitive Groups) | 102 (Moderate) | 119 (Moderate) | 71 (Moderate) | 35 (Good) | 51 (Good) | 91 (Moderate) | 124 (Unhealthy for Sensitive Groups) | 139 (Unhealthy for Sensitive Groups) | 151 (Unhealthy) | 129 (Unhealthy for Sensitive Groups) | 124 (Unhealthy for Sensitive Groups) | 114 (Moderate) | 110 (Moderate) | 101 (Moderate) | 69 (Good) | 50 (Good) | 64 (Good) | 70 (Good) |
| pm10 | 69 (Unhealthy for Sensitive Groups) | 138 (Very Unhealthy) | 58 (Unhealthy for Sensitive Groups) | 113 (Very Unhealthy) | 215 (Very bad Hazardous) | 175 (Very bad Hazardous) | 101 (Unhealthy) | 89 (Unhealthy) | 78 (Unhealthy for Sensitive Groups) | 67 (Unhealthy for Sensitive Groups) | 64 (Unhealthy for Sensitive Groups) | 43 (Moderate) | 64 (Unhealthy for Sensitive Groups) | 69 (Unhealthy for Sensitive Groups) | 129 (Very Unhealthy) | 177 (Very bad Hazardous) | 228 (Very bad Hazardous) | 266 (Very bad Hazardous) | 195 (Very bad Hazardous) | 65 (Unhealthy for Sensitive Groups) |
| so2 | 5.6 (Good) | 7.2 (Good) | 6.5 (Good) | 13 (Good) | 14 (Good) | 12 (Good) | 15 (Good) | 15 (Good) | 12 (Good) | 9.6 (Good) | 8.4 (Good) | 7.2 (Good) | 8.7 (Good) | 7.7 (Good) | 13 (Good) | 15 (Good) | 17 (Good) | 12 (Good) | 15 (Good) | 13 (Good) |
| pm25 | 33 (Moderate) | 30 (Moderate) | 35 (Moderate) | 110 (Very bad Hazardous) | 232 (Very bad Hazardous) | 150 (Very bad Hazardous) | 64 (Unhealthy) | 37 (Unhealthy for Sensitive Groups) | 23 (Moderate) | 28 (Moderate) | 19 (Moderate) | 19 (Moderate) | 28 (Moderate) | 33 (Moderate) | 106 (Very Unhealthy) | 165 (Very bad Hazardous) | 189 (Very bad Hazardous) | 163 (Very bad Hazardous) | 86 (Very Unhealthy) | 38 (Unhealthy for Sensitive Groups) |
PM2,5 22 (Moderat)
partikulat Matter (PM 2.5) debuCO 219 (Bagus)
karbon monoksida (CO)O3 0.05 (Bagus)
ozon (O3)NO2 7 (Bagus)
nitrogen dioksida (NO2)PM10 36 (Moderat)
partikulat Matter (PM10) debu tersuspensiSO2 7.7 (Bagus)
sulfur dioksida (SO2)米东区环保局
| index | 2022-05-27 |
|---|---|
| pm25 | 23 |
| co | 475 |
| o3 | 25 |
| no2 | 21 |
| pm10 | 32 |
| so2 | 4.4 |
米东区环保局
| index | 2020-05 | 2020-04 | 2020-03 | 2020-02 | 2020-01 | 2019-12 | 2019-11 | 2019-10 | 2019-09 | 2019-08 | 2019-07 | 2019-06 | 2019-05 | 2019-04 | 2019-03 | 2019-02 | 2019-01 | 2018-12 | 2018-11 | 2018-10 |
|---|---|---|---|---|---|---|---|---|---|---|---|---|---|---|---|---|---|---|---|---|
| pm25 | 33 | 30 | 35 | 110 | 232 | 150 | 64 | 37 | 23 | 28 | 19 | 19 | 28 | 33 | 106 | 165 | 189 | 163 | 86 | 38 |
| co | 498 | 645 | 975 | 1 | 2 | 2 | 1 | 869 | 535 | 553 | 484 | 471 | 391 | 402 | 1 | 1 | 2 | 1 | 1 | 1 |
| no2 | 22 | 25 | 25 | 38 | 59 | 56 | 39 | 38 | 30 | 26 | 24 | 19 | 20 | 23 | 34 | 44 | 54 | 55 | 40 | 36 |
| o3 | 125 | 129 | 102 | 119 | 71 | 35 | 51 | 91 | 124 | 139 | 151 | 129 | 124 | 114 | 110 | 101 | 69 | 50 | 64 | 70 |
| so2 | 5.6 | 7.2 | 6.5 | 13 | 14 | 12 | 15 | 15 | 12 | 9.6 | 8.4 | 7.2 | 8.7 | 7.7 | 13 | 15 | 17 | 12 | 15 | 13 |
| pm10 | 69 | 138 | 58 | 113 | 215 | 175 | 101 | 89 | 78 | 67 | 64 | 43 | 64 | 69 | 129 | 177 | 228 | 266 | 195 | 65 |