Polusi udara di Xincheng Dongmencun: indeks kualitas udara real-time dan siaga asap.
Perkiraan kualitas polusi dan udara untuk Xincheng Dongmencun. Hari ini Selasa, 16 Juni 2026. Nilai polusi udara berikut telah tercatat untuk Xincheng Dongmencun:- partikulat Matter (PM 2.5) debu - 22 (Moderat)
- karbon monoksida (CO) - 219 (Bagus)
- ozon (O3) - 0 (Bagus)
- nitrogen dioksida (NO2) - 7 (Bagus)
- partikulat Matter (PM10) debu tersuspensi - 36 (Moderat)
- sulfur dioksida (SO2) - 8 (Bagus)

Apa kualitas udara di Xincheng Dongmencun hari ini? Apakah udara tercemar di Xincheng Dongmencun?. Apakah ada Smog?
Apa tingkat saat PM 2,5 in Xincheng Dongmencun? (partikulat Matter (PM 2.5) debu)
Hari ini PM 2.5 tingkat:
22 (Moderat)
Sebagai perbandingan, tingkat tertinggi PM 2,5 in Xincheng Dongmencun dalam 7 hari terakhir adalah: 23 (Jumat, 27 Mei 2022) dan Terendah: 23 (Jumat, 27 Mei 2022).
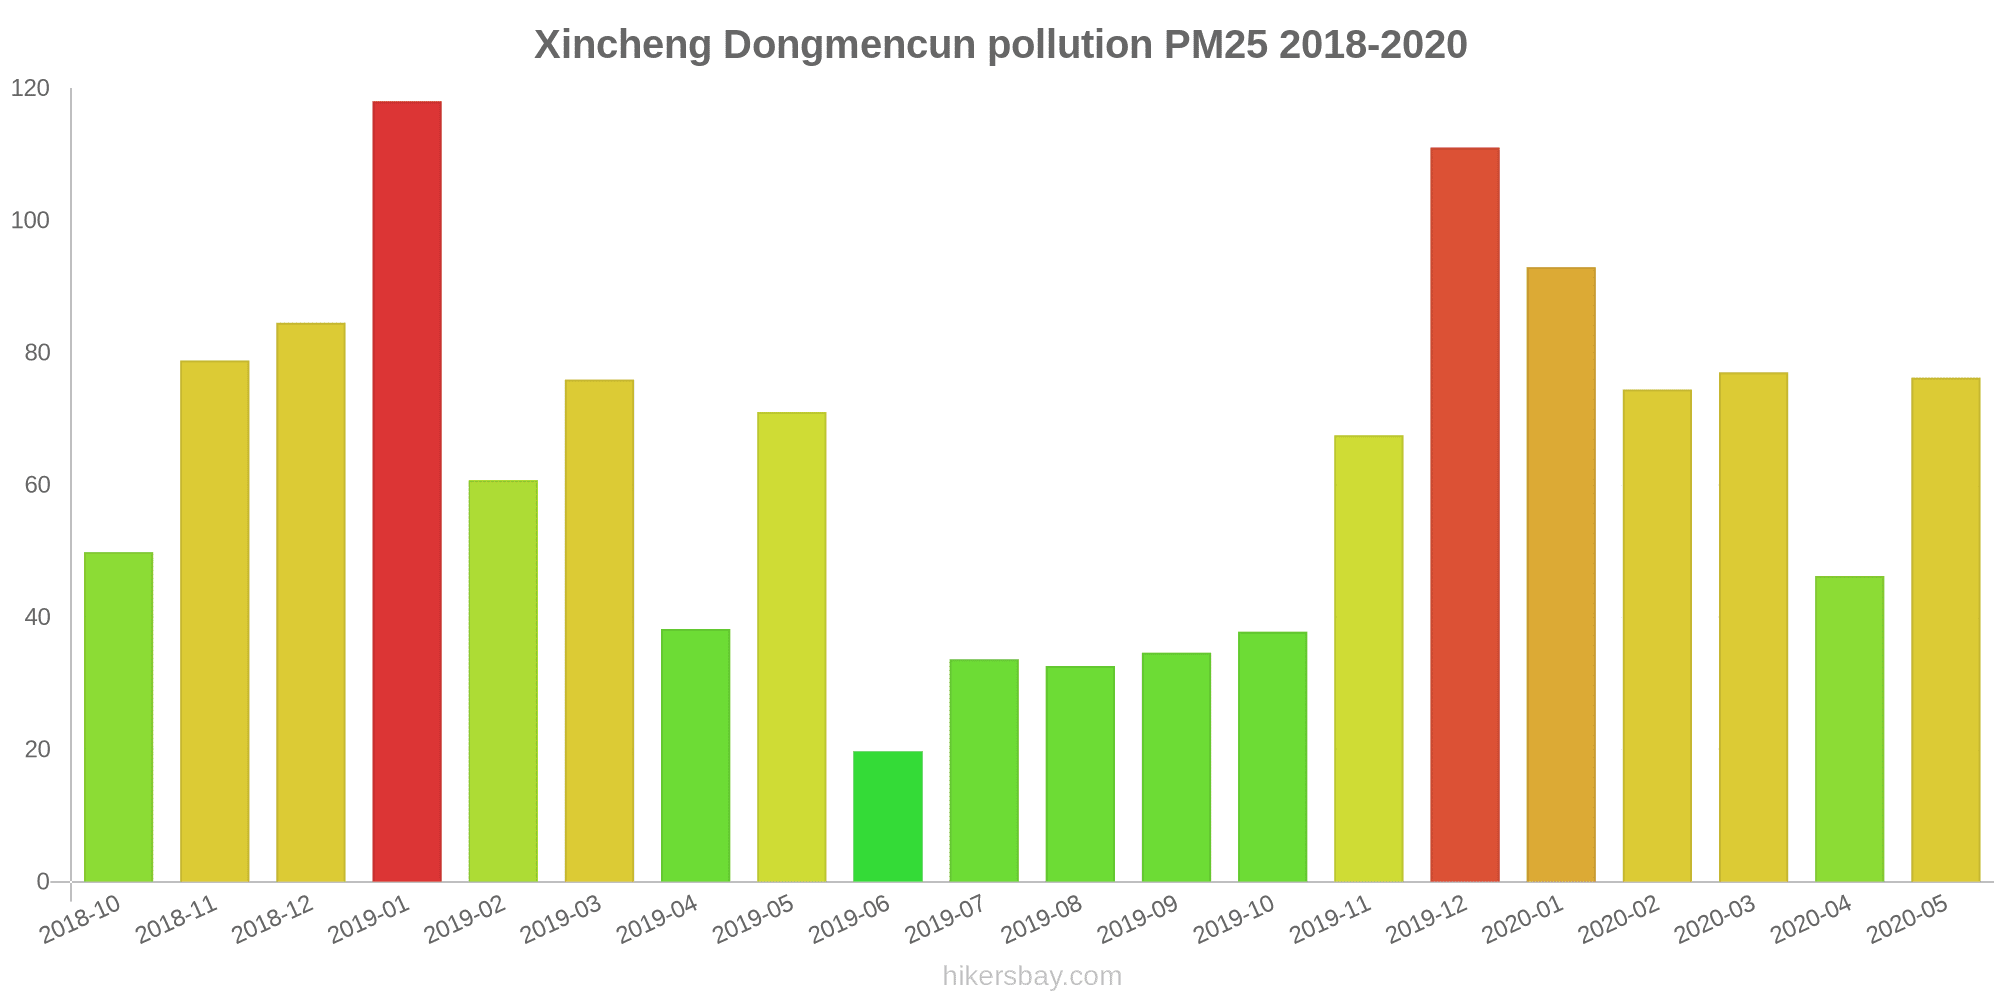
Nilai tertinggi PM 2.5 direkam: 118 (Januari 2019).
Tingkat terendah dari partikulat Matter PM 2.5 polusi terjadi di bulan: Juni (20).
Seberapa tinggi tingkat CO? (karbon monoksida (CO))
219 (Bagus)
Bagaimana tingkat O3 hari ini di Xincheng Dongmencun? (ozon (O3))
0 (Bagus)
Seberapa tinggi tingkat NO2? (nitrogen dioksida (NO2))
7 (Bagus)
Apa tingkat PM10 hari ini di Xincheng Dongmencun? (partikulat Matter (PM10) debu tersuspensi)
Level saat ini dari partikulat Matter PM10 di Xincheng Dongmencun adalah:
36 (Moderat)
Nilai PM10 tertinggi biasanya terjadi di bulan: 334 (Maret 2020).
Nilai terendah dari partikulat PM10 pencemaran Xincheng Dongmencun biasanya dicatat di: Juni (76).
Apa tingkat polusi SO2? (sulfur dioksida (SO2))
8 (Bagus)
Data saat ini Jumat, 27 Mei 2022 15.00
PM2,5 22 (Moderat)
CO 219 (Bagus)
O3 0 (Bagus)
NO2 7 (Bagus)
PM10 36 (Moderat)
SO2 8 (Bagus)
Data tentang polusi udara dari beberapa hari terakhir di Xincheng Dongmencun
index
2022-05-27
pm25
23
Moderate
co
475
Good
o3
25
Good
no2
21
Good
pm10
32
Moderate
so2
4
Good
data source »
Polusi udara di Xincheng Dongmencun dari Oktober 2018 ke Mei 2020

index
2020-05
2020-04
2020-03
2020-02
2020-01
2019-12
2019-11
2019-10
2019-09
2019-08
2019-07
2019-06
2019-05
2019-04
2019-03
2019-02
2019-01
2018-12
2018-11
2018-10
pm25
76 (Very Unhealthy)
46 (Unhealthy for Sensitive Groups)
77 (Very Unhealthy)
74 (Unhealthy)
93 (Very Unhealthy)
111 (Very bad Hazardous)
68 (Unhealthy)
38 (Unhealthy for Sensitive Groups)
35 (Moderate)
33 (Moderate)
34 (Moderate)
20 (Moderate)
71 (Unhealthy)
38 (Unhealthy for Sensitive Groups)
76 (Very Unhealthy)
61 (Unhealthy)
118 (Very bad Hazardous)
85 (Very Unhealthy)
79 (Very Unhealthy)
50 (Unhealthy for Sensitive Groups)
co
574 (Good)
584 (Good)
743 (Good)
2 (Good)
2 (Good)
2 (Good)
1 (Good)
786 (Good)
642 (Good)
696 (Good)
646 (Good)
596 (Good)
598 (Good)
708 (Good)
1 (Good)
1 (Good)
2 (Good)
2 (Good)
1 (Good)
1 (Good)
no2
20 (Good)
23 (Good)
23 (Good)
35 (Good)
49 (Moderate)
60 (Moderate)
50 (Moderate)
35 (Good)
27 (Good)
24 (Good)
23 (Good)
22 (Good)
22 (Good)
29 (Good)
38 (Good)
35 (Good)
50 (Moderate)
45 (Moderate)
46 (Moderate)
40 (Good)
o3
125 (Unhealthy for Sensitive Groups)
118 (Moderate)
99 (Moderate)
107 (Moderate)
69 (Good)
43 (Good)
63 (Good)
86 (Moderate)
112 (Moderate)
125 (Unhealthy for Sensitive Groups)
132 (Unhealthy for Sensitive Groups)
139 (Unhealthy for Sensitive Groups)
121 (Unhealthy for Sensitive Groups)
129 (Unhealthy for Sensitive Groups)
104 (Moderate)
76 (Moderate)
52 (Good)
41 (Good)
56 (Good)
80 (Moderate)
pm10
265 (Very bad Hazardous)
169 (Very bad Hazardous)
334 (Very bad Hazardous)
155 (Very bad Hazardous)
144 (Very Unhealthy)
197 (Very bad Hazardous)
193 (Very bad Hazardous)
127 (Very Unhealthy)
126 (Very Unhealthy)
111 (Very Unhealthy)
103 (Unhealthy)
76 (Unhealthy for Sensitive Groups)
208 (Very bad Hazardous)
116 (Very Unhealthy)
278 (Very bad Hazardous)
170 (Very bad Hazardous)
301 (Very bad Hazardous)
305 (Very bad Hazardous)
272 (Very bad Hazardous)
204 (Very bad Hazardous)
so2
5.7 (Good)
6.6 (Good)
8 (Good)
13 (Good)
14 (Good)
16 (Good)
12 (Good)
6.3 (Good)
6.9 (Good)
6.6 (Good)
5.5 (Good)
6.3 (Good)
6.1 (Good)
5.5 (Good)
9.3 (Good)
14 (Good)
19 (Good)
15 (Good)
12 (Good)
7.5 (Good)
data source »
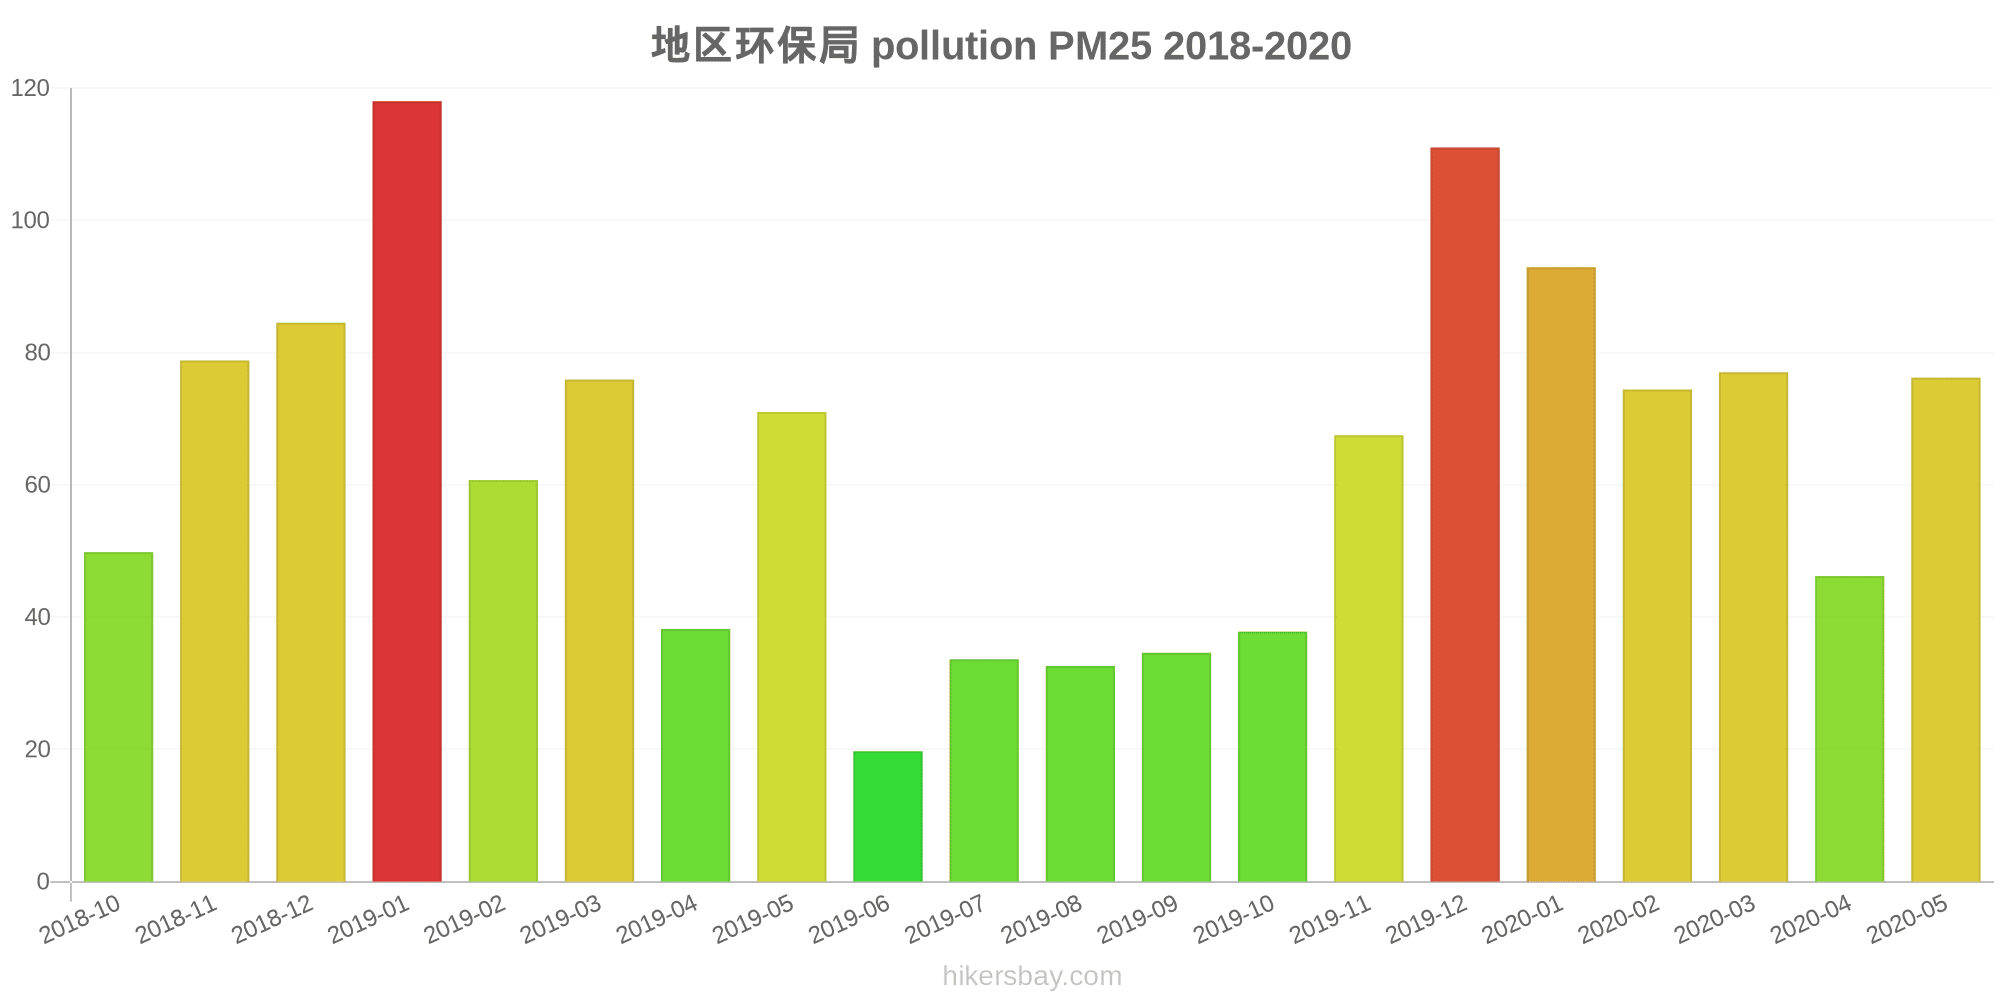
地区环保局
Jumat, 27 Mei 2022 15.00
PM2,5 22 (Moderat)
partikulat Matter (PM 2.5) debu
CO 219 (Bagus)
karbon monoksida (CO)
O3 0.05 (Bagus)
ozon (O3)
NO2 7 (Bagus)
nitrogen dioksida (NO2)
PM10 36 (Moderat)
partikulat Matter (PM10) debu tersuspensi
SO2 7.7 (Bagus)
sulfur dioksida (SO2)
地区环保局
index
2022-05-27
pm25
23
co
475
o3
25
no2
21
pm10
32
so2
4.4
地区环保局
2018-10 2020-05

index
2020-05
2020-04
2020-03
2020-02
2020-01
2019-12
2019-11
2019-10
2019-09
2019-08
2019-07
2019-06
2019-05
2019-04
2019-03
2019-02
2019-01
2018-12
2018-11
2018-10
pm25
76
46
77
74
93
111
68
38
35
33
34
20
71
38
76
61
118
85
79
50
co
574
584
743
2
2
2
1
786
642
696
646
596
598
708
1
1
2
2
1
1
no2
20
23
23
35
49
60
50
35
27
24
23
22
22
29
38
35
50
45
46
40
o3
125
118
99
107
69
43
63
86
112
125
132
139
121
129
104
76
52
41
56
80
pm10
265
169
334
155
144
197
193
127
126
111
103
76
208
116
278
170
301
305
272
204
so2
5.7
6.6
8
13
14
16
12
6.3
6.9
6.6
5.5
6.3
6.1
5.5
9.3
14
19
15
12
7.5
* Pollution data source:
https://openaq.org
(ChinaAQIData)
The data is licensed under CC-By 4.0
PM2,5 22 (Moderat)
CO 219 (Bagus)
O3 0 (Bagus)
NO2 7 (Bagus)
PM10 36 (Moderat)
SO2 8 (Bagus)
Data tentang polusi udara dari beberapa hari terakhir di Xincheng Dongmencun
| index | 2022-05-27 |
|---|---|
| pm25 | 23 Moderate |
| co | 475 Good |
| o3 | 25 Good |
| no2 | 21 Good |
| pm10 | 32 Moderate |
| so2 | 4 Good |
| index | 2020-05 | 2020-04 | 2020-03 | 2020-02 | 2020-01 | 2019-12 | 2019-11 | 2019-10 | 2019-09 | 2019-08 | 2019-07 | 2019-06 | 2019-05 | 2019-04 | 2019-03 | 2019-02 | 2019-01 | 2018-12 | 2018-11 | 2018-10 |
|---|---|---|---|---|---|---|---|---|---|---|---|---|---|---|---|---|---|---|---|---|
| pm25 | 76 (Very Unhealthy) | 46 (Unhealthy for Sensitive Groups) | 77 (Very Unhealthy) | 74 (Unhealthy) | 93 (Very Unhealthy) | 111 (Very bad Hazardous) | 68 (Unhealthy) | 38 (Unhealthy for Sensitive Groups) | 35 (Moderate) | 33 (Moderate) | 34 (Moderate) | 20 (Moderate) | 71 (Unhealthy) | 38 (Unhealthy for Sensitive Groups) | 76 (Very Unhealthy) | 61 (Unhealthy) | 118 (Very bad Hazardous) | 85 (Very Unhealthy) | 79 (Very Unhealthy) | 50 (Unhealthy for Sensitive Groups) |
| co | 574 (Good) | 584 (Good) | 743 (Good) | 2 (Good) | 2 (Good) | 2 (Good) | 1 (Good) | 786 (Good) | 642 (Good) | 696 (Good) | 646 (Good) | 596 (Good) | 598 (Good) | 708 (Good) | 1 (Good) | 1 (Good) | 2 (Good) | 2 (Good) | 1 (Good) | 1 (Good) |
| no2 | 20 (Good) | 23 (Good) | 23 (Good) | 35 (Good) | 49 (Moderate) | 60 (Moderate) | 50 (Moderate) | 35 (Good) | 27 (Good) | 24 (Good) | 23 (Good) | 22 (Good) | 22 (Good) | 29 (Good) | 38 (Good) | 35 (Good) | 50 (Moderate) | 45 (Moderate) | 46 (Moderate) | 40 (Good) |
| o3 | 125 (Unhealthy for Sensitive Groups) | 118 (Moderate) | 99 (Moderate) | 107 (Moderate) | 69 (Good) | 43 (Good) | 63 (Good) | 86 (Moderate) | 112 (Moderate) | 125 (Unhealthy for Sensitive Groups) | 132 (Unhealthy for Sensitive Groups) | 139 (Unhealthy for Sensitive Groups) | 121 (Unhealthy for Sensitive Groups) | 129 (Unhealthy for Sensitive Groups) | 104 (Moderate) | 76 (Moderate) | 52 (Good) | 41 (Good) | 56 (Good) | 80 (Moderate) |
| pm10 | 265 (Very bad Hazardous) | 169 (Very bad Hazardous) | 334 (Very bad Hazardous) | 155 (Very bad Hazardous) | 144 (Very Unhealthy) | 197 (Very bad Hazardous) | 193 (Very bad Hazardous) | 127 (Very Unhealthy) | 126 (Very Unhealthy) | 111 (Very Unhealthy) | 103 (Unhealthy) | 76 (Unhealthy for Sensitive Groups) | 208 (Very bad Hazardous) | 116 (Very Unhealthy) | 278 (Very bad Hazardous) | 170 (Very bad Hazardous) | 301 (Very bad Hazardous) | 305 (Very bad Hazardous) | 272 (Very bad Hazardous) | 204 (Very bad Hazardous) |
| so2 | 5.7 (Good) | 6.6 (Good) | 8 (Good) | 13 (Good) | 14 (Good) | 16 (Good) | 12 (Good) | 6.3 (Good) | 6.9 (Good) | 6.6 (Good) | 5.5 (Good) | 6.3 (Good) | 6.1 (Good) | 5.5 (Good) | 9.3 (Good) | 14 (Good) | 19 (Good) | 15 (Good) | 12 (Good) | 7.5 (Good) |
PM2,5 22 (Moderat)
partikulat Matter (PM 2.5) debuCO 219 (Bagus)
karbon monoksida (CO)O3 0.05 (Bagus)
ozon (O3)NO2 7 (Bagus)
nitrogen dioksida (NO2)PM10 36 (Moderat)
partikulat Matter (PM10) debu tersuspensiSO2 7.7 (Bagus)
sulfur dioksida (SO2)地区环保局
| index | 2022-05-27 |
|---|---|
| pm25 | 23 |
| co | 475 |
| o3 | 25 |
| no2 | 21 |
| pm10 | 32 |
| so2 | 4.4 |
地区环保局
| index | 2020-05 | 2020-04 | 2020-03 | 2020-02 | 2020-01 | 2019-12 | 2019-11 | 2019-10 | 2019-09 | 2019-08 | 2019-07 | 2019-06 | 2019-05 | 2019-04 | 2019-03 | 2019-02 | 2019-01 | 2018-12 | 2018-11 | 2018-10 |
|---|---|---|---|---|---|---|---|---|---|---|---|---|---|---|---|---|---|---|---|---|
| pm25 | 76 | 46 | 77 | 74 | 93 | 111 | 68 | 38 | 35 | 33 | 34 | 20 | 71 | 38 | 76 | 61 | 118 | 85 | 79 | 50 |
| co | 574 | 584 | 743 | 2 | 2 | 2 | 1 | 786 | 642 | 696 | 646 | 596 | 598 | 708 | 1 | 1 | 2 | 2 | 1 | 1 |
| no2 | 20 | 23 | 23 | 35 | 49 | 60 | 50 | 35 | 27 | 24 | 23 | 22 | 22 | 29 | 38 | 35 | 50 | 45 | 46 | 40 |
| o3 | 125 | 118 | 99 | 107 | 69 | 43 | 63 | 86 | 112 | 125 | 132 | 139 | 121 | 129 | 104 | 76 | 52 | 41 | 56 | 80 |
| pm10 | 265 | 169 | 334 | 155 | 144 | 197 | 193 | 127 | 126 | 111 | 103 | 76 | 208 | 116 | 278 | 170 | 301 | 305 | 272 | 204 |
| so2 | 5.7 | 6.6 | 8 | 13 | 14 | 16 | 12 | 6.3 | 6.9 | 6.6 | 5.5 | 6.3 | 6.1 | 5.5 | 9.3 | 14 | 19 | 15 | 12 | 7.5 |