Polusi udara di Gaozhantuncun: indeks kualitas udara real-time dan siaga asap.
Perkiraan kualitas polusi dan udara untuk Gaozhantuncun. Hari ini Selasa, 16 Juni 2026. Nilai polusi udara berikut telah tercatat untuk Gaozhantuncun:- partikulat Matter (PM10) debu tersuspensi - 7 (Bagus)
- partikulat Matter (PM 2.5) debu - 2 (Bagus)
- karbon monoksida (CO) - 100 (Bagus)
- nitrogen dioksida (NO2) - 8 (Bagus)
- ozon (O3) - 0 (Bagus)
- sulfur dioksida (SO2) - 9 (Bagus)

Apa kualitas udara di Gaozhantuncun hari ini? Apakah udara tercemar di Gaozhantuncun?. Apakah ada Smog?
Apa tingkat PM10 hari ini di Gaozhantuncun? (partikulat Matter (PM10) debu tersuspensi)
Level saat ini dari partikulat Matter PM10 di Gaozhantuncun adalah:
7 (Bagus)
Nilai PM10 tertinggi biasanya terjadi di bulan: 182 (Januari 2019).
Nilai terendah dari partikulat PM10 pencemaran Gaozhantuncun biasanya dicatat di: Agustus (47).
Apa tingkat saat PM 2,5 in Gaozhantuncun? (partikulat Matter (PM 2.5) debu)
Hari ini PM 2.5 tingkat:
2 (Bagus)
Sebagai perbandingan, tingkat tertinggi PM 2,5 in Gaozhantuncun dalam 7 hari terakhir adalah: 24 (Jumat, 27 Mei 2022) dan Terendah: 24 (Jumat, 27 Mei 2022).
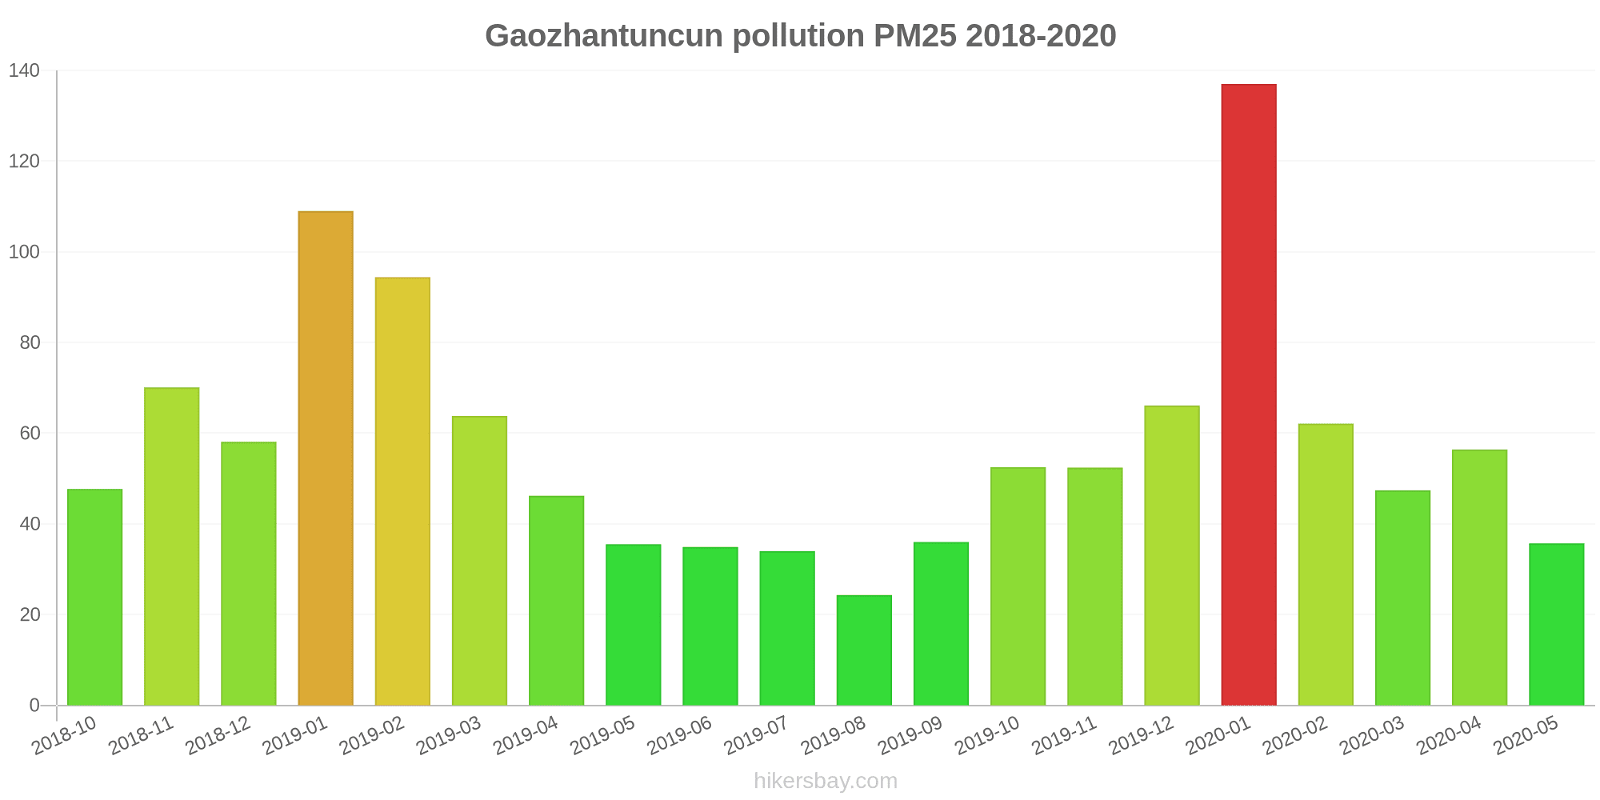
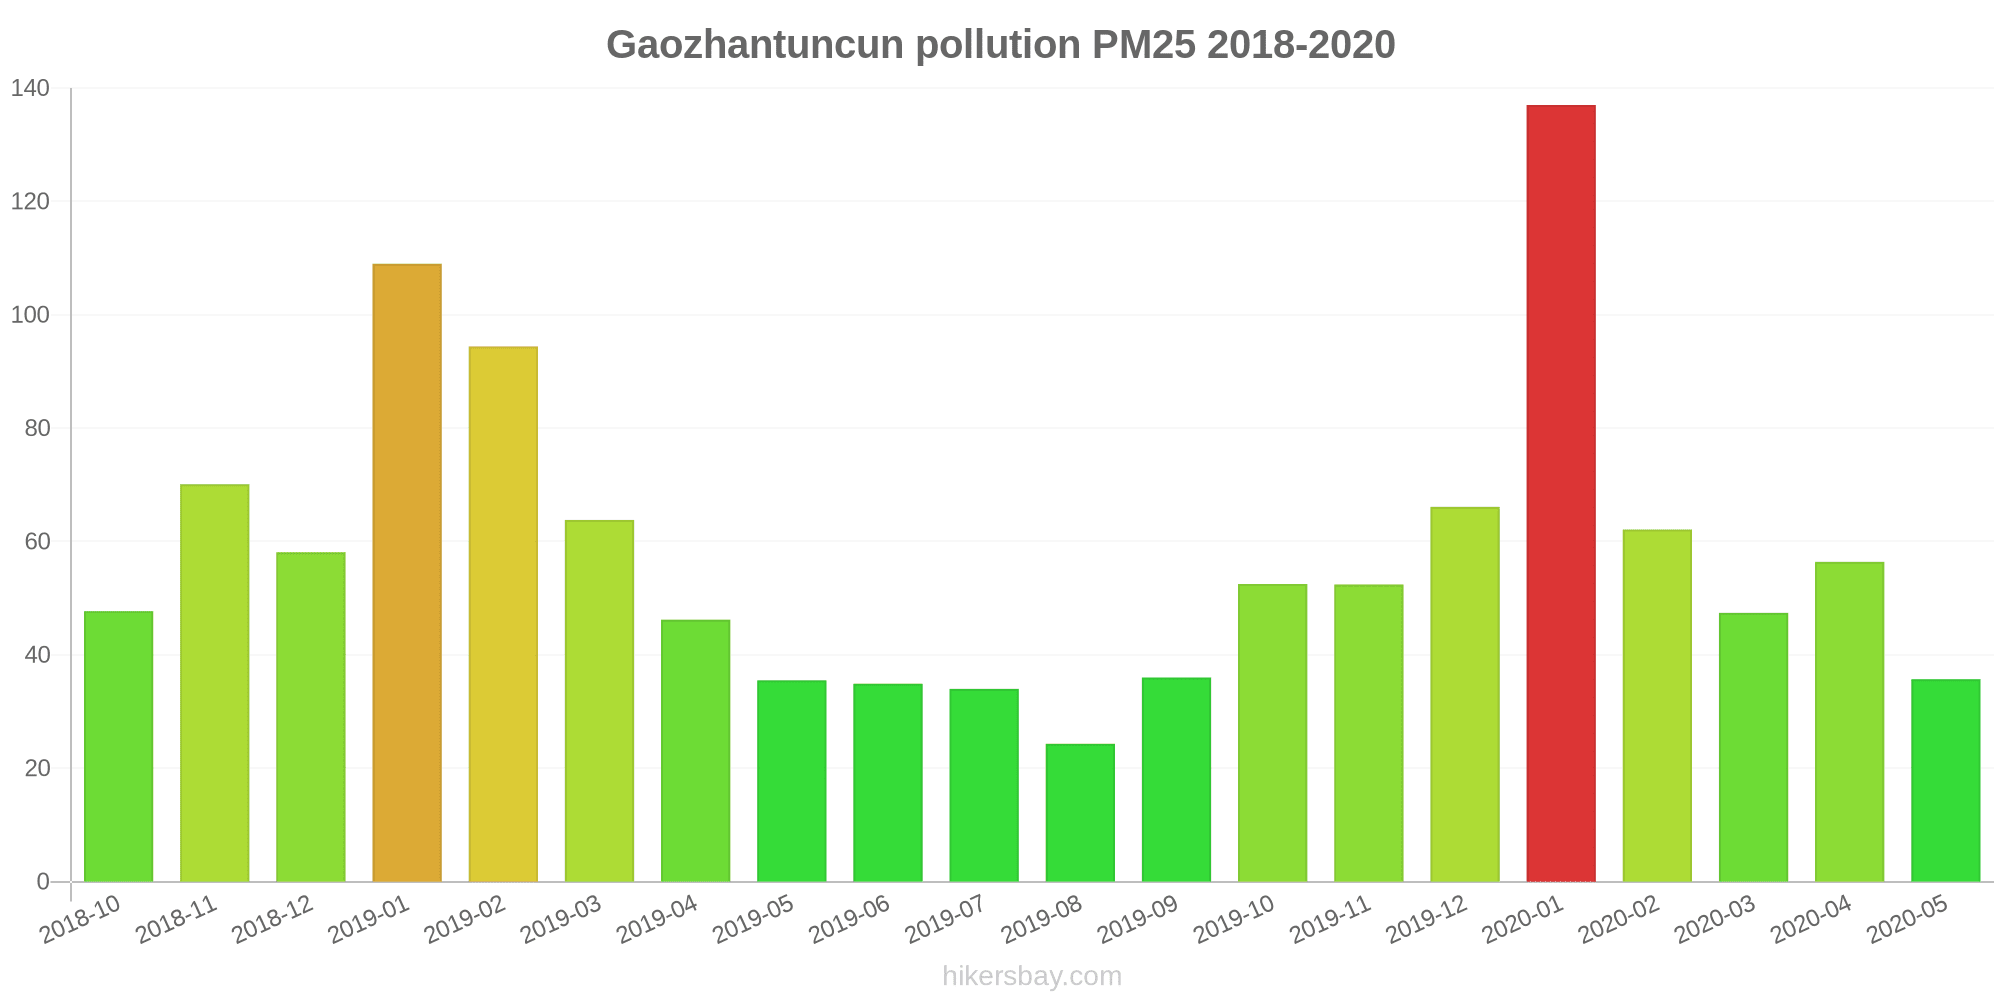
Nilai tertinggi PM 2.5 direkam: 137 (Januari 2020).
Tingkat terendah dari partikulat Matter PM 2.5 polusi terjadi di bulan: Agustus (24).
Seberapa tinggi tingkat CO? (karbon monoksida (CO))
100 (Bagus)
Seberapa tinggi tingkat NO2? (nitrogen dioksida (NO2))
8 (Bagus)
Bagaimana tingkat O3 hari ini di Gaozhantuncun? (ozon (O3))
0 (Bagus)
Apa tingkat polusi SO2? (sulfur dioksida (SO2))
9 (Bagus)
Data saat ini Jumat, 27 Mei 2022 12.00
PM10 7 (Bagus)
PM2,5 2 (Bagus)
CO 100 (Bagus)
NO2 8 (Bagus)
O3 0 (Bagus)
SO2 9 (Bagus)
Data tentang polusi udara dari beberapa hari terakhir di Gaozhantuncun
index
2022-05-27
pm10
32
Moderate
pm25
24
Moderate
co
468
Good
no2
21
Good
o3
32
Good
so2
5
Good
data source »
Polusi udara di Gaozhantuncun dari Oktober 2018 ke Mei 2020
index
2020-05
2020-04
2020-03
2020-02
2020-01
2019-12
2019-11
2019-10
2019-09
2019-08
2019-07
2019-06
2019-05
2019-04
2019-03
2019-02
2019-01
2018-12
2018-11
2018-10
pm25
36 (Unhealthy for Sensitive Groups)
56 (Unhealthy)
47 (Unhealthy for Sensitive Groups)
62 (Unhealthy)
137 (Very bad Hazardous)
66 (Unhealthy)
52 (Unhealthy for Sensitive Groups)
53 (Unhealthy for Sensitive Groups)
36 (Unhealthy for Sensitive Groups)
24 (Moderate)
34 (Moderate)
35 (Moderate)
36 (Unhealthy for Sensitive Groups)
46 (Unhealthy for Sensitive Groups)
64 (Unhealthy)
94 (Very Unhealthy)
109 (Very Unhealthy)
58 (Unhealthy)
70 (Unhealthy)
48 (Unhealthy for Sensitive Groups)
co
973 (Good)
1 (Good)
1 (Good)
1 (Good)
2 (Good)
1 (Good)
1 (Good)
1 (Good)
1 (Good)
1 (Good)
1 (Good)
1 (Good)
914 (Good)
1 (Good)
1 (Good)
1 (Good)
2 (Good)
1 (Good)
1 (Good)
1 (Good)
no2
27 (Good)
35 (Good)
33 (Good)
40 (Good)
66 (Moderate)
48 (Moderate)
45 (Moderate)
40 (Moderate)
32 (Good)
21 (Good)
18 (Good)
26 (Good)
21 (Good)
30 (Good)
35 (Good)
45 (Moderate)
51 (Moderate)
44 (Moderate)
49 (Moderate)
37 (Good)
o3
132 (Unhealthy for Sensitive Groups)
132 (Unhealthy for Sensitive Groups)
102 (Moderate)
75 (Moderate)
60 (Good)
57 (Good)
57 (Good)
103 (Moderate)
125 (Unhealthy for Sensitive Groups)
111 (Moderate)
169 (Unhealthy)
147 (Unhealthy for Sensitive Groups)
148 (Unhealthy for Sensitive Groups)
115 (Moderate)
109 (Moderate)
87 (Moderate)
62 (Good)
50 (Good)
56 (Good)
78 (Moderate)
pm10
81 (Unhealthy)
115 (Very Unhealthy)
87 (Unhealthy)
96 (Unhealthy)
179 (Very bad Hazardous)
107 (Unhealthy)
108 (Unhealthy)
112 (Very Unhealthy)
80 (Unhealthy for Sensitive Groups)
47 (Moderate)
57 (Unhealthy for Sensitive Groups)
54 (Unhealthy for Sensitive Groups)
67 (Unhealthy for Sensitive Groups)
122 (Very Unhealthy)
121 (Very Unhealthy)
140 (Very Unhealthy)
182 (Very bad Hazardous)
111 (Very Unhealthy)
129 (Very Unhealthy)
106 (Unhealthy)
so2
17 (Good)
22 (Good)
19 (Good)
22 (Good)
32 (Good)
26 (Good)
30 (Good)
19 (Good)
20 (Good)
9.8 (Good)
10 (Good)
15 (Good)
16 (Good)
20 (Good)
23 (Good)
31 (Good)
34 (Good)
32 (Good)
28 (Good)
19 (Good)
data source »
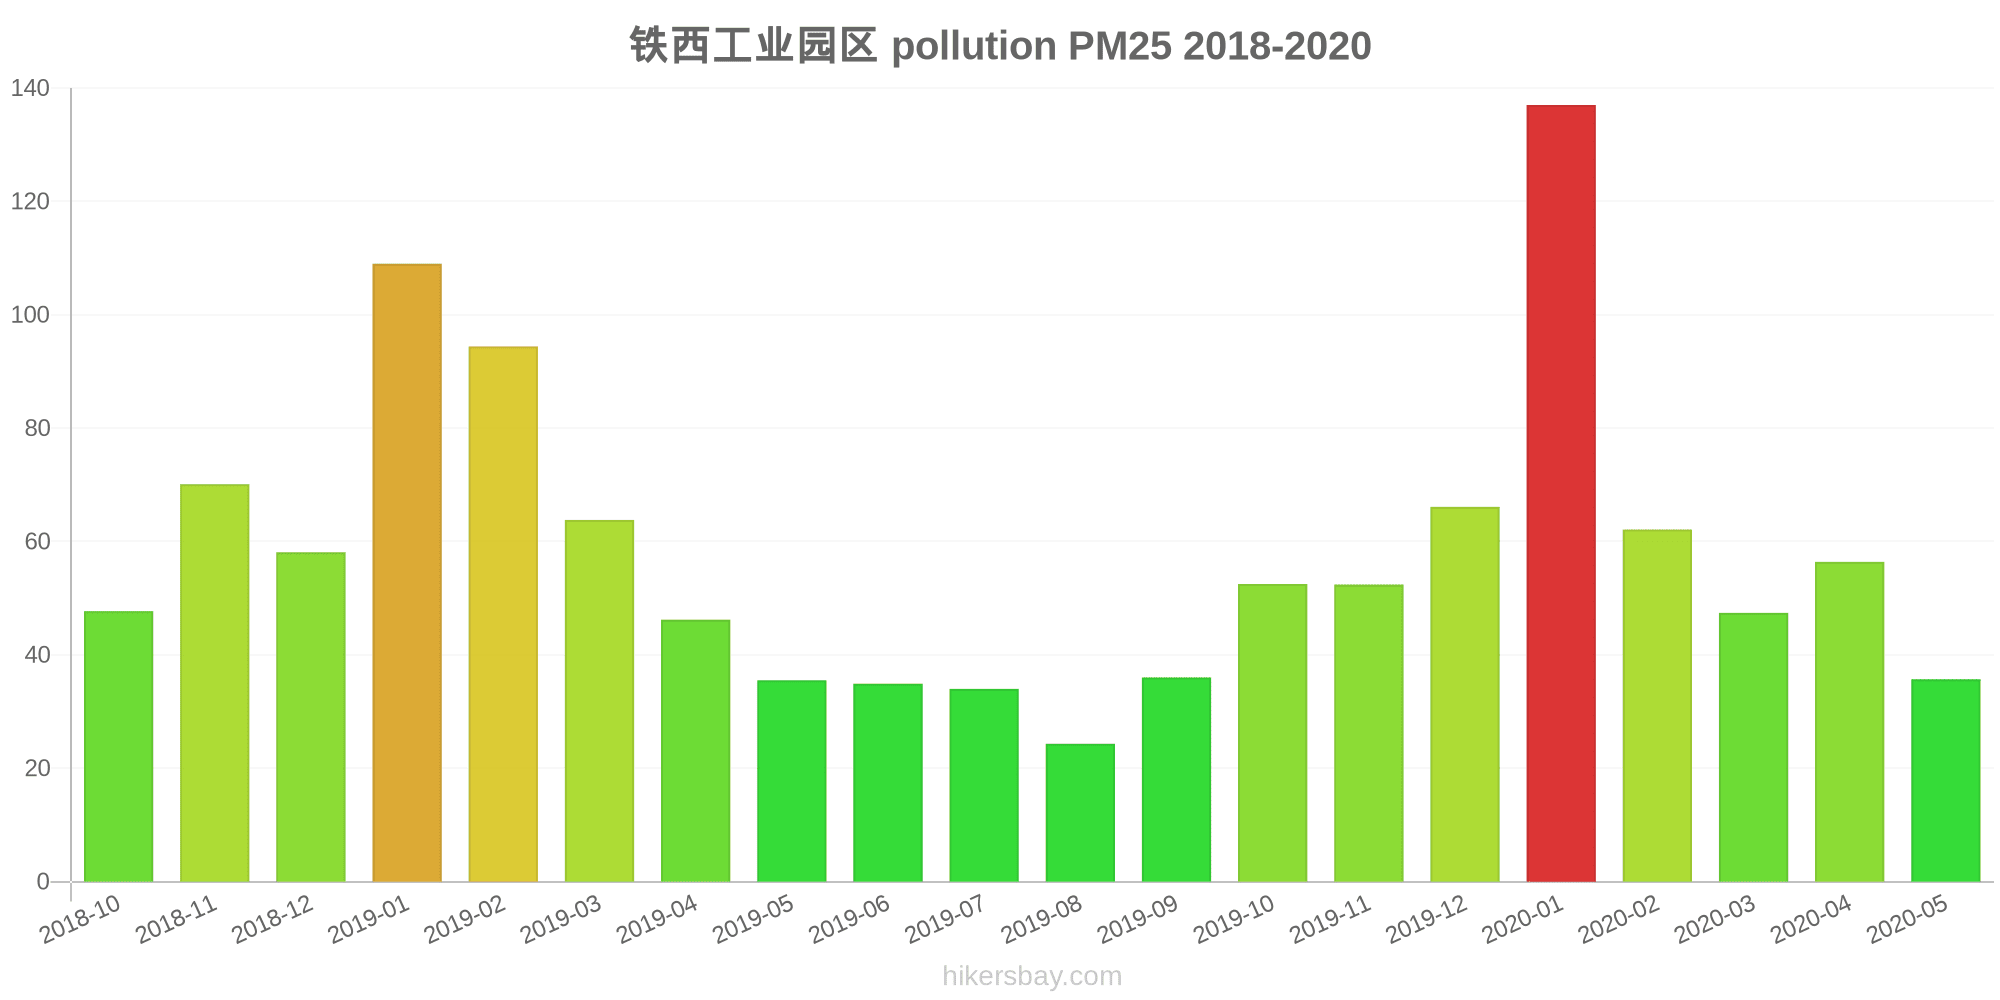
铁西工业园区
Jumat, 27 Mei 2022 12.00
PM10 6.7 (Bagus)
partikulat Matter (PM10) debu tersuspensi
PM2,5 1.7 (Bagus)
partikulat Matter (PM 2.5) debu
CO 100 (Bagus)
karbon monoksida (CO)
NO2 7.6 (Bagus)
nitrogen dioksida (NO2)
O3 0.02 (Bagus)
ozon (O3)
SO2 8.6 (Bagus)
sulfur dioksida (SO2)
铁西工业园区
index
2022-05-27
pm10
32
pm25
24
co
468
no2
21
o3
32
so2
4.6
铁西工业园区
2018-10 2020-05

index
2020-05
2020-04
2020-03
2020-02
2020-01
2019-12
2019-11
2019-10
2019-09
2019-08
2019-07
2019-06
2019-05
2019-04
2019-03
2019-02
2019-01
2018-12
2018-11
2018-10
pm25
36
56
47
62
137
66
52
53
36
24
34
35
36
46
64
94
109
58
70
48
co
973
1
1
1
2
1
1
1
1
1
1
1
914
1
1
1
2
1
1
1
no2
27
35
33
40
66
48
45
40
32
21
18
26
21
30
35
45
51
44
49
37
o3
132
132
102
75
60
57
57
103
125
111
169
147
148
115
109
87
62
50
56
78
pm10
81
115
87
96
179
107
108
112
80
47
57
54
67
122
121
140
182
111
129
106
so2
17
22
19
22
32
26
30
19
20
9.8
10
15
16
20
23
31
34
32
28
19
* Pollution data source:
https://openaq.org
(ChinaAQIData)
The data is licensed under CC-By 4.0
PM10 7 (Bagus)
PM2,5 2 (Bagus)
CO 100 (Bagus)
NO2 8 (Bagus)
O3 0 (Bagus)
SO2 9 (Bagus)
Data tentang polusi udara dari beberapa hari terakhir di Gaozhantuncun
| index | 2022-05-27 |
|---|---|
| pm10 | 32 Moderate |
| pm25 | 24 Moderate |
| co | 468 Good |
| no2 | 21 Good |
| o3 | 32 Good |
| so2 | 5 Good |
| index | 2020-05 | 2020-04 | 2020-03 | 2020-02 | 2020-01 | 2019-12 | 2019-11 | 2019-10 | 2019-09 | 2019-08 | 2019-07 | 2019-06 | 2019-05 | 2019-04 | 2019-03 | 2019-02 | 2019-01 | 2018-12 | 2018-11 | 2018-10 |
|---|---|---|---|---|---|---|---|---|---|---|---|---|---|---|---|---|---|---|---|---|
| pm25 | 36 (Unhealthy for Sensitive Groups) | 56 (Unhealthy) | 47 (Unhealthy for Sensitive Groups) | 62 (Unhealthy) | 137 (Very bad Hazardous) | 66 (Unhealthy) | 52 (Unhealthy for Sensitive Groups) | 53 (Unhealthy for Sensitive Groups) | 36 (Unhealthy for Sensitive Groups) | 24 (Moderate) | 34 (Moderate) | 35 (Moderate) | 36 (Unhealthy for Sensitive Groups) | 46 (Unhealthy for Sensitive Groups) | 64 (Unhealthy) | 94 (Very Unhealthy) | 109 (Very Unhealthy) | 58 (Unhealthy) | 70 (Unhealthy) | 48 (Unhealthy for Sensitive Groups) |
| co | 973 (Good) | 1 (Good) | 1 (Good) | 1 (Good) | 2 (Good) | 1 (Good) | 1 (Good) | 1 (Good) | 1 (Good) | 1 (Good) | 1 (Good) | 1 (Good) | 914 (Good) | 1 (Good) | 1 (Good) | 1 (Good) | 2 (Good) | 1 (Good) | 1 (Good) | 1 (Good) |
| no2 | 27 (Good) | 35 (Good) | 33 (Good) | 40 (Good) | 66 (Moderate) | 48 (Moderate) | 45 (Moderate) | 40 (Moderate) | 32 (Good) | 21 (Good) | 18 (Good) | 26 (Good) | 21 (Good) | 30 (Good) | 35 (Good) | 45 (Moderate) | 51 (Moderate) | 44 (Moderate) | 49 (Moderate) | 37 (Good) |
| o3 | 132 (Unhealthy for Sensitive Groups) | 132 (Unhealthy for Sensitive Groups) | 102 (Moderate) | 75 (Moderate) | 60 (Good) | 57 (Good) | 57 (Good) | 103 (Moderate) | 125 (Unhealthy for Sensitive Groups) | 111 (Moderate) | 169 (Unhealthy) | 147 (Unhealthy for Sensitive Groups) | 148 (Unhealthy for Sensitive Groups) | 115 (Moderate) | 109 (Moderate) | 87 (Moderate) | 62 (Good) | 50 (Good) | 56 (Good) | 78 (Moderate) |
| pm10 | 81 (Unhealthy) | 115 (Very Unhealthy) | 87 (Unhealthy) | 96 (Unhealthy) | 179 (Very bad Hazardous) | 107 (Unhealthy) | 108 (Unhealthy) | 112 (Very Unhealthy) | 80 (Unhealthy for Sensitive Groups) | 47 (Moderate) | 57 (Unhealthy for Sensitive Groups) | 54 (Unhealthy for Sensitive Groups) | 67 (Unhealthy for Sensitive Groups) | 122 (Very Unhealthy) | 121 (Very Unhealthy) | 140 (Very Unhealthy) | 182 (Very bad Hazardous) | 111 (Very Unhealthy) | 129 (Very Unhealthy) | 106 (Unhealthy) |
| so2 | 17 (Good) | 22 (Good) | 19 (Good) | 22 (Good) | 32 (Good) | 26 (Good) | 30 (Good) | 19 (Good) | 20 (Good) | 9.8 (Good) | 10 (Good) | 15 (Good) | 16 (Good) | 20 (Good) | 23 (Good) | 31 (Good) | 34 (Good) | 32 (Good) | 28 (Good) | 19 (Good) |
PM10 6.7 (Bagus)
partikulat Matter (PM10) debu tersuspensiPM2,5 1.7 (Bagus)
partikulat Matter (PM 2.5) debuCO 100 (Bagus)
karbon monoksida (CO)NO2 7.6 (Bagus)
nitrogen dioksida (NO2)O3 0.02 (Bagus)
ozon (O3)SO2 8.6 (Bagus)
sulfur dioksida (SO2)铁西工业园区
| index | 2022-05-27 |
|---|---|
| pm10 | 32 |
| pm25 | 24 |
| co | 468 |
| no2 | 21 |
| o3 | 32 |
| so2 | 4.6 |
铁西工业园区
| index | 2020-05 | 2020-04 | 2020-03 | 2020-02 | 2020-01 | 2019-12 | 2019-11 | 2019-10 | 2019-09 | 2019-08 | 2019-07 | 2019-06 | 2019-05 | 2019-04 | 2019-03 | 2019-02 | 2019-01 | 2018-12 | 2018-11 | 2018-10 |
|---|---|---|---|---|---|---|---|---|---|---|---|---|---|---|---|---|---|---|---|---|
| pm25 | 36 | 56 | 47 | 62 | 137 | 66 | 52 | 53 | 36 | 24 | 34 | 35 | 36 | 46 | 64 | 94 | 109 | 58 | 70 | 48 |
| co | 973 | 1 | 1 | 1 | 2 | 1 | 1 | 1 | 1 | 1 | 1 | 1 | 914 | 1 | 1 | 1 | 2 | 1 | 1 | 1 |
| no2 | 27 | 35 | 33 | 40 | 66 | 48 | 45 | 40 | 32 | 21 | 18 | 26 | 21 | 30 | 35 | 45 | 51 | 44 | 49 | 37 |
| o3 | 132 | 132 | 102 | 75 | 60 | 57 | 57 | 103 | 125 | 111 | 169 | 147 | 148 | 115 | 109 | 87 | 62 | 50 | 56 | 78 |
| pm10 | 81 | 115 | 87 | 96 | 179 | 107 | 108 | 112 | 80 | 47 | 57 | 54 | 67 | 122 | 121 | 140 | 182 | 111 | 129 | 106 |
| so2 | 17 | 22 | 19 | 22 | 32 | 26 | 30 | 19 | 20 | 9.8 | 10 | 15 | 16 | 20 | 23 | 31 | 34 | 32 | 28 | 19 |