Polusi udara di Yingchengzicun: indeks kualitas udara real-time dan siaga asap.
Perkiraan kualitas polusi dan udara untuk Yingchengzicun. Hari ini Minggu, 21 Juni 2026. Nilai polusi udara berikut telah tercatat untuk Yingchengzicun:- partikulat Matter (PM10) debu tersuspensi - 7 (Bagus)
- partikulat Matter (PM 2.5) debu - 2 (Bagus)
- karbon monoksida (CO) - 100 (Bagus)
- nitrogen dioksida (NO2) - 8 (Bagus)
- ozon (O3) - 0 (Bagus)
- sulfur dioksida (SO2) - 9 (Bagus)

Apa kualitas udara di Yingchengzicun hari ini? Apakah udara tercemar di Yingchengzicun?. Apakah ada Smog?
Apa tingkat PM10 hari ini di Yingchengzicun? (partikulat Matter (PM10) debu tersuspensi)
Level saat ini dari partikulat Matter PM10 di Yingchengzicun adalah:
7 (Bagus)
Nilai PM10 tertinggi biasanya terjadi di bulan: 162 (Januari 2020).
Nilai terendah dari partikulat PM10 pencemaran Yingchengzicun biasanya dicatat di: Agustus (31).
Apa tingkat saat PM 2,5 in Yingchengzicun? (partikulat Matter (PM 2.5) debu)
Hari ini PM 2.5 tingkat:
2 (Bagus)
Sebagai perbandingan, tingkat tertinggi PM 2,5 in Yingchengzicun dalam 7 hari terakhir adalah: 24 (Jumat, 27 Mei 2022) dan Terendah: 24 (Jumat, 27 Mei 2022).
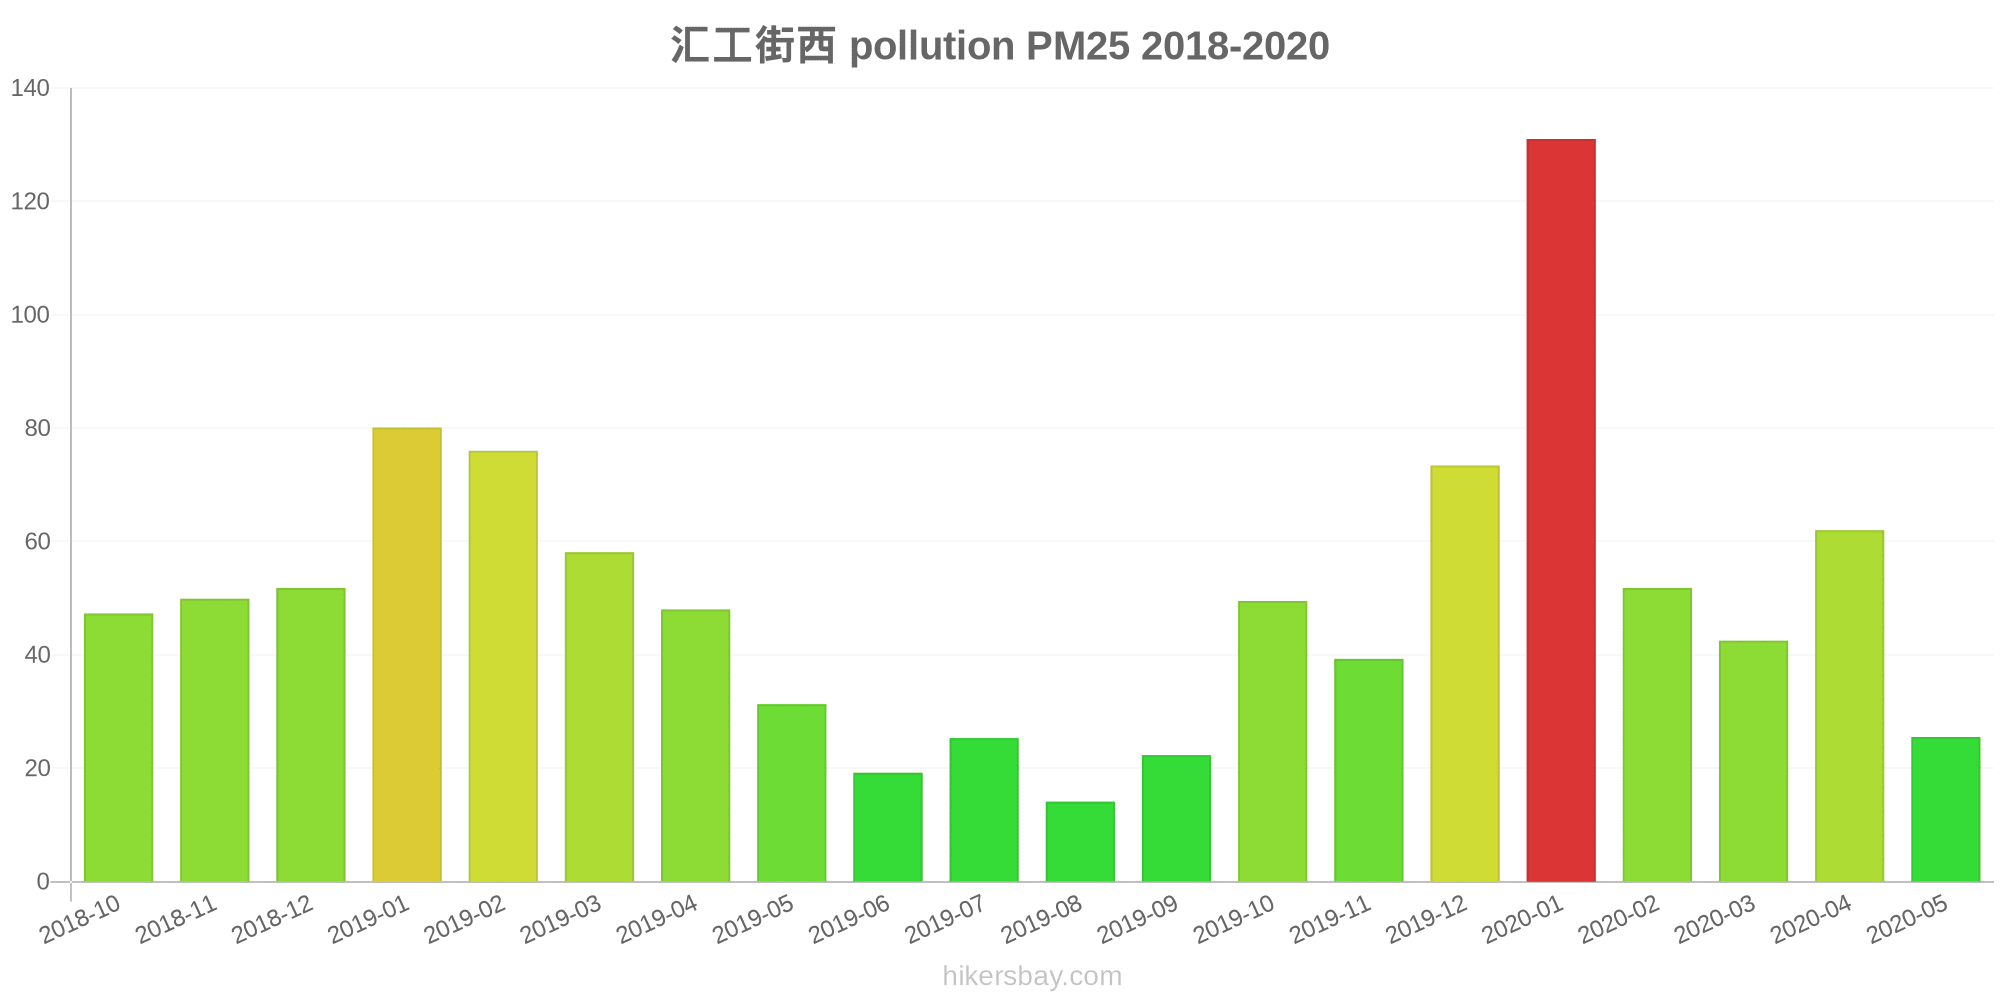
Nilai tertinggi PM 2.5 direkam: 131 (Januari 2020).
Tingkat terendah dari partikulat Matter PM 2.5 polusi terjadi di bulan: Agustus (14).
Seberapa tinggi tingkat CO? (karbon monoksida (CO))
100 (Bagus)
Seberapa tinggi tingkat NO2? (nitrogen dioksida (NO2))
8 (Bagus)
Bagaimana tingkat O3 hari ini di Yingchengzicun? (ozon (O3))
0 (Bagus)
Apa tingkat polusi SO2? (sulfur dioksida (SO2))
9 (Bagus)
Data saat ini Jumat, 27 Mei 2022 12.00
PM10 7 (Bagus)
PM2,5 2 (Bagus)
CO 100 (Bagus)
NO2 8 (Bagus)
O3 0 (Bagus)
SO2 9 (Bagus)
Data tentang polusi udara dari beberapa hari terakhir di Yingchengzicun
index
2022-05-27
pm10
32
Moderate
pm25
24
Moderate
co
468
Good
no2
21
Good
o3
32
Good
so2
5
Good
data source »
Polusi udara di Yingchengzicun dari Oktober 2018 ke Mei 2020

index
2020-05
2020-04
2020-03
2020-02
2020-01
2019-12
2019-11
2019-10
2019-09
2019-08
2019-07
2019-06
2019-05
2019-04
2019-03
2019-02
2019-01
2018-12
2018-11
2018-10
pm25
26 (Moderate)
62 (Unhealthy)
43 (Unhealthy for Sensitive Groups)
52 (Unhealthy for Sensitive Groups)
131 (Very bad Hazardous)
73 (Unhealthy)
39 (Unhealthy for Sensitive Groups)
50 (Unhealthy for Sensitive Groups)
22 (Moderate)
14 (Moderate)
25 (Moderate)
19 (Moderate)
31 (Moderate)
48 (Unhealthy for Sensitive Groups)
58 (Unhealthy)
76 (Very Unhealthy)
80 (Very Unhealthy)
52 (Unhealthy for Sensitive Groups)
50 (Unhealthy for Sensitive Groups)
47 (Unhealthy for Sensitive Groups)
co
535 (Good)
670 (Good)
681 (Good)
772 (Good)
1 (Good)
744 (Good)
642 (Good)
659 (Good)
631 (Good)
388 (Good)
493 (Good)
597 (Good)
486 (Good)
697 (Good)
469 (Good)
639 (Good)
860 (Good)
832 (Good)
897 (Good)
756 (Good)
no2
29 (Good)
42 (Moderate)
30 (Good)
31 (Good)
59 (Moderate)
42 (Moderate)
30 (Good)
33 (Good)
24 (Good)
12 (Good)
22 (Good)
27 (Good)
26 (Good)
32 (Good)
37 (Good)
39 (Good)
46 (Moderate)
33 (Good)
34 (Good)
31 (Good)
o3
114 (Moderate)
125 (Unhealthy for Sensitive Groups)
101 (Moderate)
84 (Moderate)
78 (Moderate)
64 (Good)
63 (Good)
100 (Moderate)
120 (Unhealthy for Sensitive Groups)
105 (Moderate)
157 (Unhealthy)
141 (Unhealthy for Sensitive Groups)
131 (Unhealthy for Sensitive Groups)
103 (Moderate)
96 (Moderate)
76 (Moderate)
55 (Good)
58 (Good)
62 (Good)
79 (Moderate)
pm10
81 (Unhealthy)
107 (Unhealthy)
70 (Unhealthy for Sensitive Groups)
72 (Unhealthy for Sensitive Groups)
162 (Very bad Hazardous)
97 (Unhealthy)
70 (Unhealthy for Sensitive Groups)
92 (Unhealthy)
55 (Unhealthy for Sensitive Groups)
31 (Moderate)
52 (Unhealthy for Sensitive Groups)
44 (Moderate)
84 (Unhealthy)
126 (Very Unhealthy)
102 (Unhealthy)
105 (Unhealthy)
122 (Very Unhealthy)
82 (Unhealthy)
83 (Unhealthy)
74 (Unhealthy for Sensitive Groups)
so2
7.8 (Good)
13 (Good)
11 (Good)
14 (Good)
28 (Good)
20 (Good)
16 (Good)
14 (Good)
11 (Good)
8.1 (Good)
13 (Good)
15 (Good)
10 (Good)
18 (Good)
18 (Good)
17 (Good)
25 (Good)
24 (Good)
24 (Good)
15 (Good)
data source »
汇工街西
Jumat, 27 Mei 2022 12.00
PM10 6.7 (Bagus)
partikulat Matter (PM10) debu tersuspensi
PM2,5 1.7 (Bagus)
partikulat Matter (PM 2.5) debu
CO 100 (Bagus)
karbon monoksida (CO)
NO2 7.6 (Bagus)
nitrogen dioksida (NO2)
O3 0.02 (Bagus)
ozon (O3)
SO2 8.6 (Bagus)
sulfur dioksida (SO2)
汇工街西
index
2022-05-27
pm10
32
pm25
24
co
468
no2
21
o3
32
so2
4.6
汇工街西
2018-10 2020-05

index
2020-05
2020-04
2020-03
2020-02
2020-01
2019-12
2019-11
2019-10
2019-09
2019-08
2019-07
2019-06
2019-05
2019-04
2019-03
2019-02
2019-01
2018-12
2018-11
2018-10
pm25
26
62
43
52
131
73
39
50
22
14
25
19
31
48
58
76
80
52
50
47
co
535
670
681
772
1
744
642
659
631
388
493
597
486
697
469
639
860
832
897
756
no2
29
42
30
31
59
42
30
33
24
12
22
27
26
32
37
39
46
33
34
31
o3
114
125
101
84
78
64
63
100
120
105
157
141
131
103
96
76
55
58
62
79
pm10
81
107
70
72
162
97
70
92
55
31
52
44
84
126
102
105
122
82
83
74
so2
7.8
13
11
14
28
20
16
14
11
8.1
13
15
10
18
18
17
25
24
24
15
* Pollution data source:
https://openaq.org
(ChinaAQIData)
The data is licensed under CC-By 4.0
PM10 7 (Bagus)
PM2,5 2 (Bagus)
CO 100 (Bagus)
NO2 8 (Bagus)
O3 0 (Bagus)
SO2 9 (Bagus)
Data tentang polusi udara dari beberapa hari terakhir di Yingchengzicun
| index | 2022-05-27 |
|---|---|
| pm10 | 32 Moderate |
| pm25 | 24 Moderate |
| co | 468 Good |
| no2 | 21 Good |
| o3 | 32 Good |
| so2 | 5 Good |

| index | 2020-05 | 2020-04 | 2020-03 | 2020-02 | 2020-01 | 2019-12 | 2019-11 | 2019-10 | 2019-09 | 2019-08 | 2019-07 | 2019-06 | 2019-05 | 2019-04 | 2019-03 | 2019-02 | 2019-01 | 2018-12 | 2018-11 | 2018-10 |
|---|---|---|---|---|---|---|---|---|---|---|---|---|---|---|---|---|---|---|---|---|
| pm25 | 26 (Moderate) | 62 (Unhealthy) | 43 (Unhealthy for Sensitive Groups) | 52 (Unhealthy for Sensitive Groups) | 131 (Very bad Hazardous) | 73 (Unhealthy) | 39 (Unhealthy for Sensitive Groups) | 50 (Unhealthy for Sensitive Groups) | 22 (Moderate) | 14 (Moderate) | 25 (Moderate) | 19 (Moderate) | 31 (Moderate) | 48 (Unhealthy for Sensitive Groups) | 58 (Unhealthy) | 76 (Very Unhealthy) | 80 (Very Unhealthy) | 52 (Unhealthy for Sensitive Groups) | 50 (Unhealthy for Sensitive Groups) | 47 (Unhealthy for Sensitive Groups) |
| co | 535 (Good) | 670 (Good) | 681 (Good) | 772 (Good) | 1 (Good) | 744 (Good) | 642 (Good) | 659 (Good) | 631 (Good) | 388 (Good) | 493 (Good) | 597 (Good) | 486 (Good) | 697 (Good) | 469 (Good) | 639 (Good) | 860 (Good) | 832 (Good) | 897 (Good) | 756 (Good) |
| no2 | 29 (Good) | 42 (Moderate) | 30 (Good) | 31 (Good) | 59 (Moderate) | 42 (Moderate) | 30 (Good) | 33 (Good) | 24 (Good) | 12 (Good) | 22 (Good) | 27 (Good) | 26 (Good) | 32 (Good) | 37 (Good) | 39 (Good) | 46 (Moderate) | 33 (Good) | 34 (Good) | 31 (Good) |
| o3 | 114 (Moderate) | 125 (Unhealthy for Sensitive Groups) | 101 (Moderate) | 84 (Moderate) | 78 (Moderate) | 64 (Good) | 63 (Good) | 100 (Moderate) | 120 (Unhealthy for Sensitive Groups) | 105 (Moderate) | 157 (Unhealthy) | 141 (Unhealthy for Sensitive Groups) | 131 (Unhealthy for Sensitive Groups) | 103 (Moderate) | 96 (Moderate) | 76 (Moderate) | 55 (Good) | 58 (Good) | 62 (Good) | 79 (Moderate) |
| pm10 | 81 (Unhealthy) | 107 (Unhealthy) | 70 (Unhealthy for Sensitive Groups) | 72 (Unhealthy for Sensitive Groups) | 162 (Very bad Hazardous) | 97 (Unhealthy) | 70 (Unhealthy for Sensitive Groups) | 92 (Unhealthy) | 55 (Unhealthy for Sensitive Groups) | 31 (Moderate) | 52 (Unhealthy for Sensitive Groups) | 44 (Moderate) | 84 (Unhealthy) | 126 (Very Unhealthy) | 102 (Unhealthy) | 105 (Unhealthy) | 122 (Very Unhealthy) | 82 (Unhealthy) | 83 (Unhealthy) | 74 (Unhealthy for Sensitive Groups) |
| so2 | 7.8 (Good) | 13 (Good) | 11 (Good) | 14 (Good) | 28 (Good) | 20 (Good) | 16 (Good) | 14 (Good) | 11 (Good) | 8.1 (Good) | 13 (Good) | 15 (Good) | 10 (Good) | 18 (Good) | 18 (Good) | 17 (Good) | 25 (Good) | 24 (Good) | 24 (Good) | 15 (Good) |
PM10 6.7 (Bagus)
partikulat Matter (PM10) debu tersuspensiPM2,5 1.7 (Bagus)
partikulat Matter (PM 2.5) debuCO 100 (Bagus)
karbon monoksida (CO)NO2 7.6 (Bagus)
nitrogen dioksida (NO2)O3 0.02 (Bagus)
ozon (O3)SO2 8.6 (Bagus)
sulfur dioksida (SO2)汇工街西
| index | 2022-05-27 |
|---|---|
| pm10 | 32 |
| pm25 | 24 |
| co | 468 |
| no2 | 21 |
| o3 | 32 |
| so2 | 4.6 |
汇工街西
| index | 2020-05 | 2020-04 | 2020-03 | 2020-02 | 2020-01 | 2019-12 | 2019-11 | 2019-10 | 2019-09 | 2019-08 | 2019-07 | 2019-06 | 2019-05 | 2019-04 | 2019-03 | 2019-02 | 2019-01 | 2018-12 | 2018-11 | 2018-10 |
|---|---|---|---|---|---|---|---|---|---|---|---|---|---|---|---|---|---|---|---|---|
| pm25 | 26 | 62 | 43 | 52 | 131 | 73 | 39 | 50 | 22 | 14 | 25 | 19 | 31 | 48 | 58 | 76 | 80 | 52 | 50 | 47 |
| co | 535 | 670 | 681 | 772 | 1 | 744 | 642 | 659 | 631 | 388 | 493 | 597 | 486 | 697 | 469 | 639 | 860 | 832 | 897 | 756 |
| no2 | 29 | 42 | 30 | 31 | 59 | 42 | 30 | 33 | 24 | 12 | 22 | 27 | 26 | 32 | 37 | 39 | 46 | 33 | 34 | 31 |
| o3 | 114 | 125 | 101 | 84 | 78 | 64 | 63 | 100 | 120 | 105 | 157 | 141 | 131 | 103 | 96 | 76 | 55 | 58 | 62 | 79 |
| pm10 | 81 | 107 | 70 | 72 | 162 | 97 | 70 | 92 | 55 | 31 | 52 | 44 | 84 | 126 | 102 | 105 | 122 | 82 | 83 | 74 |
| so2 | 7.8 | 13 | 11 | 14 | 28 | 20 | 16 | 14 | 11 | 8.1 | 13 | 15 | 10 | 18 | 18 | 17 | 25 | 24 | 24 | 15 |