Polusi udara di Liaogongzhuangcun: indeks kualitas udara real-time dan siaga asap.
Perkiraan kualitas polusi dan udara untuk Liaogongzhuangcun. Hari ini Sabtu, 13 Juni 2026. Nilai polusi udara berikut telah tercatat untuk Liaogongzhuangcun:- nitrogen dioksida (NO2) - 7 (Bagus)
- partikulat Matter (PM10) debu tersuspensi - 19 (Bagus)
- ozon (O3) - 91 (Moderat)
- partikulat Matter (PM 2.5) debu - 10 (Bagus)
- sulfur dioksida (SO2) - 0 (Bagus)
- karbon monoksida (CO) - 100 (Bagus)

Apa kualitas udara di Liaogongzhuangcun hari ini? Apakah udara tercemar di Liaogongzhuangcun?. Apakah ada Smog?
Seberapa tinggi tingkat NO2? (nitrogen dioksida (NO2))
7 (Bagus)
Apa tingkat PM10 hari ini di Liaogongzhuangcun? (partikulat Matter (PM10) debu tersuspensi)
Level saat ini dari partikulat Matter PM10 di Liaogongzhuangcun adalah:
19 (Bagus)
Nilai PM10 tertinggi biasanya terjadi di bulan: 105 (November 2018).
Nilai terendah dari partikulat PM10 pencemaran Liaogongzhuangcun biasanya dicatat di: Agustus (41).
Bagaimana tingkat O3 hari ini di Liaogongzhuangcun? (ozon (O3))
91 (Moderat)
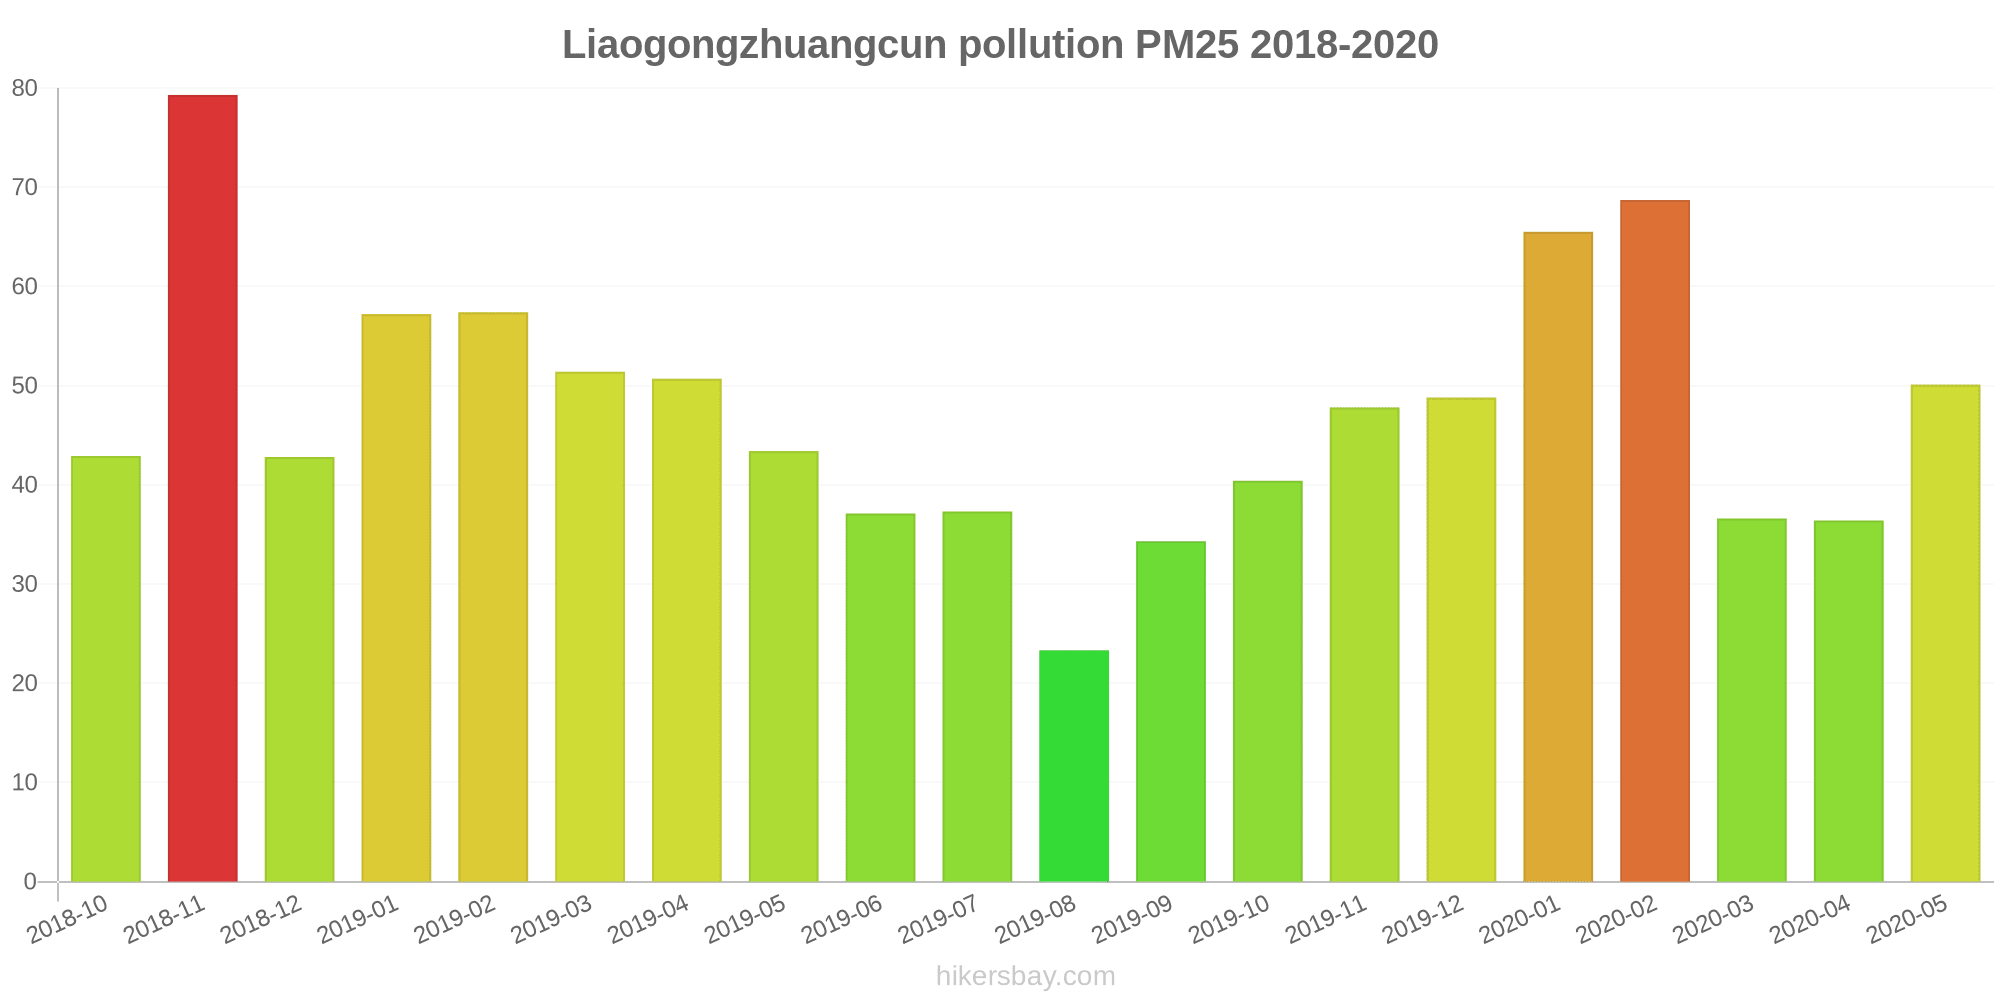
Apa tingkat saat PM 2,5 in Liaogongzhuangcun? (partikulat Matter (PM 2.5) debu)
Hari ini PM 2.5 tingkat:
10 (Bagus)
Sebagai perbandingan, tingkat tertinggi PM 2,5 in Liaogongzhuangcun dalam 7 hari terakhir adalah: 20 (Jumat, 27 Mei 2022) dan Terendah: 20 (Jumat, 27 Mei 2022).
Nilai tertinggi PM 2.5 direkam: 79 (November 2018).
Tingkat terendah dari partikulat Matter PM 2.5 polusi terjadi di bulan: Agustus (23).
Apa tingkat polusi SO2? (sulfur dioksida (SO2))
0 (Bagus)
Seberapa tinggi tingkat CO? (karbon monoksida (CO))
100 (Bagus)
Data saat ini Jumat, 27 Mei 2022 12.00
NO2 7 (Bagus)
PM10 19 (Bagus)
O3 91 (Moderat)
PM2,5 10 (Bagus)
SO2 0 (Bagus)
CO 100 (Bagus)
Data tentang polusi udara dari beberapa hari terakhir di Liaogongzhuangcun
index
2022-05-27
no2
20
Good
pm10
27
Moderate
o3
39
Good
pm25
20
Moderate
so2
5
Good
co
240
Good
data source »
Polusi udara di Liaogongzhuangcun dari Oktober 2018 ke Mei 2020

index
2020-05
2020-04
2020-03
2020-02
2020-01
2019-12
2019-11
2019-10
2019-09
2019-08
2019-07
2019-06
2019-05
2019-04
2019-03
2019-02
2019-01
2018-12
2018-11
2018-10
pm25
50 (Unhealthy for Sensitive Groups)
36 (Unhealthy for Sensitive Groups)
37 (Unhealthy for Sensitive Groups)
69 (Unhealthy)
66 (Unhealthy)
49 (Unhealthy for Sensitive Groups)
48 (Unhealthy for Sensitive Groups)
40 (Unhealthy for Sensitive Groups)
34 (Moderate)
23 (Moderate)
37 (Unhealthy for Sensitive Groups)
37 (Unhealthy for Sensitive Groups)
43 (Unhealthy for Sensitive Groups)
51 (Unhealthy for Sensitive Groups)
51 (Unhealthy for Sensitive Groups)
57 (Unhealthy)
57 (Unhealthy)
43 (Unhealthy for Sensitive Groups)
79 (Very Unhealthy)
43 (Unhealthy for Sensitive Groups)
co
610 (Good)
395 (Good)
491 (Good)
873 (Good)
992 (Good)
803 (Good)
758 (Good)
630 (Good)
642 (Good)
554 (Good)
655 (Good)
635 (Good)
455 (Good)
499 (Good)
548 (Good)
755 (Good)
929 (Good)
831 (Good)
1 (Good)
784 (Good)
no2
22 (Good)
25 (Good)
24 (Good)
22 (Good)
38 (Good)
47 (Moderate)
50 (Moderate)
42 (Moderate)
31 (Good)
29 (Good)
32 (Good)
29 (Good)
38 (Good)
34 (Good)
37 (Good)
33 (Good)
50 (Moderate)
45 (Moderate)
66 (Moderate)
60 (Moderate)
o3
144 (Unhealthy for Sensitive Groups)
126 (Unhealthy for Sensitive Groups)
89 (Moderate)
75 (Moderate)
61 (Good)
47 (Good)
43 (Good)
81 (Moderate)
171 (Unhealthy)
134 (Unhealthy for Sensitive Groups)
177 (Unhealthy)
192 (Very Unhealthy)
156 (Unhealthy)
123 (Unhealthy for Sensitive Groups)
107 (Moderate)
73 (Moderate)
56 (Good)
53 (Good)
57 (Good)
90 (Moderate)
pm10
69 (Unhealthy for Sensitive Groups)
72 (Unhealthy for Sensitive Groups)
58 (Unhealthy for Sensitive Groups)
60 (Unhealthy for Sensitive Groups)
70 (Unhealthy for Sensitive Groups)
68 (Unhealthy for Sensitive Groups)
91 (Unhealthy)
78 (Unhealthy for Sensitive Groups)
61 (Unhealthy for Sensitive Groups)
41 (Moderate)
52 (Unhealthy for Sensitive Groups)
63 (Unhealthy for Sensitive Groups)
90 (Unhealthy)
97 (Unhealthy)
88 (Unhealthy)
75 (Unhealthy for Sensitive Groups)
78 (Unhealthy for Sensitive Groups)
73 (Unhealthy for Sensitive Groups)
105 (Unhealthy)
60 (Unhealthy for Sensitive Groups)
so2
3.1 (Good)
3.6 (Good)
3.7 (Good)
3.3 (Good)
5.8 (Good)
3.3 (Good)
3.5 (Good)
2.7 (Good)
2.5 (Good)
3 (Good)
2.3 (Good)
3.7 (Good)
4.3 (Good)
4.5 (Good)
5.6 (Good)
5.9 (Good)
8.6 (Good)
5.9 (Good)
5.5 (Good)
3.2 (Good)
data source »
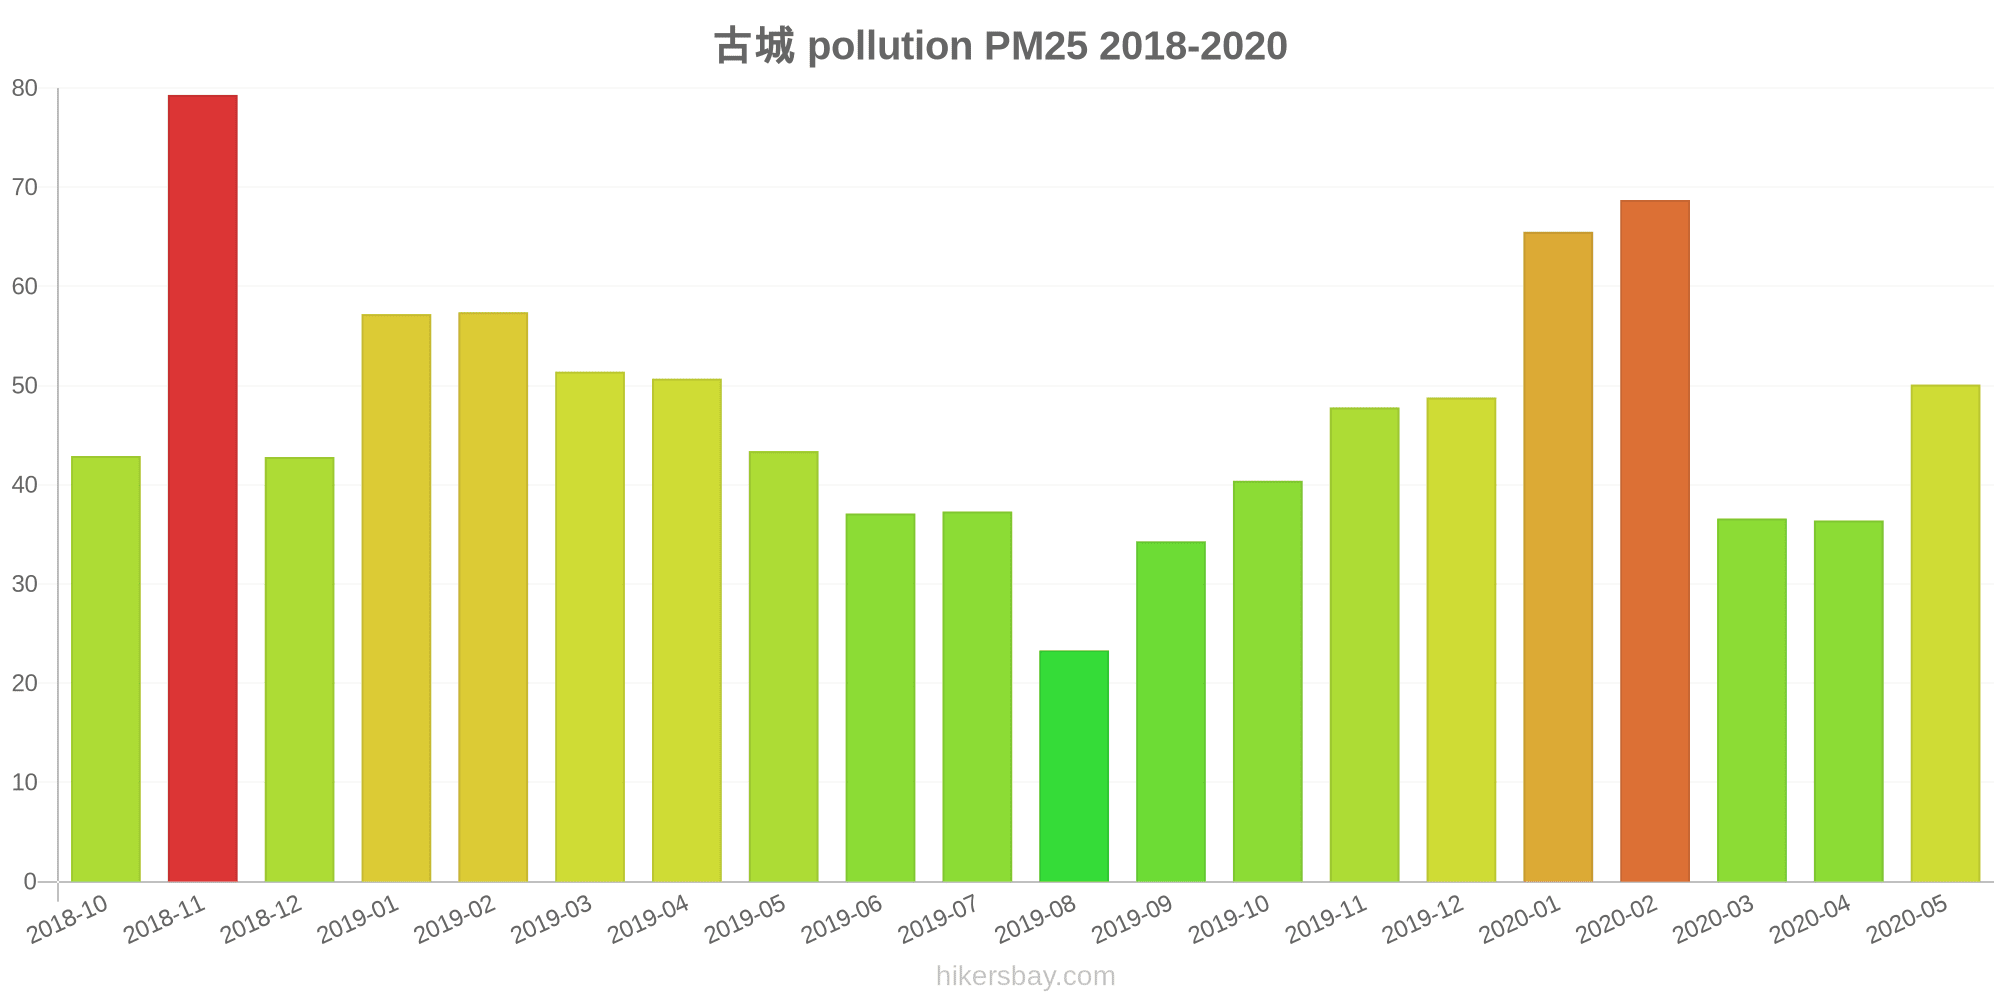
古城
Jumat, 27 Mei 2022 12.00
NO2 7.3 (Bagus)
nitrogen dioksida (NO2)
PM10 19 (Bagus)
partikulat Matter (PM10) debu tersuspensi
O3 91 (Moderat)
ozon (O3)
PM2,5 10 (Bagus)
partikulat Matter (PM 2.5) debu
SO2 0.1 (Bagus)
sulfur dioksida (SO2)
CO 100 (Bagus)
karbon monoksida (CO)
古城
index
2022-05-27
no2
20
pm10
27
o3
39
pm25
20
so2
4.9
co
240
古城
2018-10 2020-05

index
2020-05
2020-04
2020-03
2020-02
2020-01
2019-12
2019-11
2019-10
2019-09
2019-08
2019-07
2019-06
2019-05
2019-04
2019-03
2019-02
2019-01
2018-12
2018-11
2018-10
pm25
50
36
37
69
66
49
48
40
34
23
37
37
43
51
51
57
57
43
79
43
co
610
395
491
873
992
803
758
630
642
554
655
635
455
499
548
755
929
831
1
784
no2
22
25
24
22
38
47
50
42
31
29
32
29
38
34
37
33
50
45
66
60
o3
144
126
89
75
61
47
43
81
171
134
177
192
156
123
107
73
56
53
57
90
pm10
69
72
58
60
70
68
91
78
61
41
52
63
90
97
88
75
78
73
105
60
so2
3.1
3.6
3.7
3.3
5.8
3.3
3.5
2.7
2.5
3
2.3
3.7
4.3
4.5
5.6
5.9
8.6
5.9
5.5
3.2
* Pollution data source:
https://openaq.org
(ChinaAQIData)
The data is licensed under CC-By 4.0
NO2 7 (Bagus)
PM10 19 (Bagus)
O3 91 (Moderat)
PM2,5 10 (Bagus)
SO2 0 (Bagus)
CO 100 (Bagus)
Data tentang polusi udara dari beberapa hari terakhir di Liaogongzhuangcun
| index | 2022-05-27 |
|---|---|
| no2 | 20 Good |
| pm10 | 27 Moderate |
| o3 | 39 Good |
| pm25 | 20 Moderate |
| so2 | 5 Good |
| co | 240 Good |
| index | 2020-05 | 2020-04 | 2020-03 | 2020-02 | 2020-01 | 2019-12 | 2019-11 | 2019-10 | 2019-09 | 2019-08 | 2019-07 | 2019-06 | 2019-05 | 2019-04 | 2019-03 | 2019-02 | 2019-01 | 2018-12 | 2018-11 | 2018-10 |
|---|---|---|---|---|---|---|---|---|---|---|---|---|---|---|---|---|---|---|---|---|
| pm25 | 50 (Unhealthy for Sensitive Groups) | 36 (Unhealthy for Sensitive Groups) | 37 (Unhealthy for Sensitive Groups) | 69 (Unhealthy) | 66 (Unhealthy) | 49 (Unhealthy for Sensitive Groups) | 48 (Unhealthy for Sensitive Groups) | 40 (Unhealthy for Sensitive Groups) | 34 (Moderate) | 23 (Moderate) | 37 (Unhealthy for Sensitive Groups) | 37 (Unhealthy for Sensitive Groups) | 43 (Unhealthy for Sensitive Groups) | 51 (Unhealthy for Sensitive Groups) | 51 (Unhealthy for Sensitive Groups) | 57 (Unhealthy) | 57 (Unhealthy) | 43 (Unhealthy for Sensitive Groups) | 79 (Very Unhealthy) | 43 (Unhealthy for Sensitive Groups) |
| co | 610 (Good) | 395 (Good) | 491 (Good) | 873 (Good) | 992 (Good) | 803 (Good) | 758 (Good) | 630 (Good) | 642 (Good) | 554 (Good) | 655 (Good) | 635 (Good) | 455 (Good) | 499 (Good) | 548 (Good) | 755 (Good) | 929 (Good) | 831 (Good) | 1 (Good) | 784 (Good) |
| no2 | 22 (Good) | 25 (Good) | 24 (Good) | 22 (Good) | 38 (Good) | 47 (Moderate) | 50 (Moderate) | 42 (Moderate) | 31 (Good) | 29 (Good) | 32 (Good) | 29 (Good) | 38 (Good) | 34 (Good) | 37 (Good) | 33 (Good) | 50 (Moderate) | 45 (Moderate) | 66 (Moderate) | 60 (Moderate) |
| o3 | 144 (Unhealthy for Sensitive Groups) | 126 (Unhealthy for Sensitive Groups) | 89 (Moderate) | 75 (Moderate) | 61 (Good) | 47 (Good) | 43 (Good) | 81 (Moderate) | 171 (Unhealthy) | 134 (Unhealthy for Sensitive Groups) | 177 (Unhealthy) | 192 (Very Unhealthy) | 156 (Unhealthy) | 123 (Unhealthy for Sensitive Groups) | 107 (Moderate) | 73 (Moderate) | 56 (Good) | 53 (Good) | 57 (Good) | 90 (Moderate) |
| pm10 | 69 (Unhealthy for Sensitive Groups) | 72 (Unhealthy for Sensitive Groups) | 58 (Unhealthy for Sensitive Groups) | 60 (Unhealthy for Sensitive Groups) | 70 (Unhealthy for Sensitive Groups) | 68 (Unhealthy for Sensitive Groups) | 91 (Unhealthy) | 78 (Unhealthy for Sensitive Groups) | 61 (Unhealthy for Sensitive Groups) | 41 (Moderate) | 52 (Unhealthy for Sensitive Groups) | 63 (Unhealthy for Sensitive Groups) | 90 (Unhealthy) | 97 (Unhealthy) | 88 (Unhealthy) | 75 (Unhealthy for Sensitive Groups) | 78 (Unhealthy for Sensitive Groups) | 73 (Unhealthy for Sensitive Groups) | 105 (Unhealthy) | 60 (Unhealthy for Sensitive Groups) |
| so2 | 3.1 (Good) | 3.6 (Good) | 3.7 (Good) | 3.3 (Good) | 5.8 (Good) | 3.3 (Good) | 3.5 (Good) | 2.7 (Good) | 2.5 (Good) | 3 (Good) | 2.3 (Good) | 3.7 (Good) | 4.3 (Good) | 4.5 (Good) | 5.6 (Good) | 5.9 (Good) | 8.6 (Good) | 5.9 (Good) | 5.5 (Good) | 3.2 (Good) |
NO2 7.3 (Bagus)
nitrogen dioksida (NO2)PM10 19 (Bagus)
partikulat Matter (PM10) debu tersuspensiO3 91 (Moderat)
ozon (O3)PM2,5 10 (Bagus)
partikulat Matter (PM 2.5) debuSO2 0.1 (Bagus)
sulfur dioksida (SO2)CO 100 (Bagus)
karbon monoksida (CO)古城
| index | 2022-05-27 |
|---|---|
| no2 | 20 |
| pm10 | 27 |
| o3 | 39 |
| pm25 | 20 |
| so2 | 4.9 |
| co | 240 |
古城
| index | 2020-05 | 2020-04 | 2020-03 | 2020-02 | 2020-01 | 2019-12 | 2019-11 | 2019-10 | 2019-09 | 2019-08 | 2019-07 | 2019-06 | 2019-05 | 2019-04 | 2019-03 | 2019-02 | 2019-01 | 2018-12 | 2018-11 | 2018-10 |
|---|---|---|---|---|---|---|---|---|---|---|---|---|---|---|---|---|---|---|---|---|
| pm25 | 50 | 36 | 37 | 69 | 66 | 49 | 48 | 40 | 34 | 23 | 37 | 37 | 43 | 51 | 51 | 57 | 57 | 43 | 79 | 43 |
| co | 610 | 395 | 491 | 873 | 992 | 803 | 758 | 630 | 642 | 554 | 655 | 635 | 455 | 499 | 548 | 755 | 929 | 831 | 1 | 784 |
| no2 | 22 | 25 | 24 | 22 | 38 | 47 | 50 | 42 | 31 | 29 | 32 | 29 | 38 | 34 | 37 | 33 | 50 | 45 | 66 | 60 |
| o3 | 144 | 126 | 89 | 75 | 61 | 47 | 43 | 81 | 171 | 134 | 177 | 192 | 156 | 123 | 107 | 73 | 56 | 53 | 57 | 90 |
| pm10 | 69 | 72 | 58 | 60 | 70 | 68 | 91 | 78 | 61 | 41 | 52 | 63 | 90 | 97 | 88 | 75 | 78 | 73 | 105 | 60 |
| so2 | 3.1 | 3.6 | 3.7 | 3.3 | 5.8 | 3.3 | 3.5 | 2.7 | 2.5 | 3 | 2.3 | 3.7 | 4.3 | 4.5 | 5.6 | 5.9 | 8.6 | 5.9 | 5.5 | 3.2 |